

We assessed thermal and salinity limits in several ontogenetic stages and acclimation states of Delta Smelt to evaluate sensitivity to climate change stressors. Thermal tolerance decreased among successive stages, and juvenile tolerance limits were closest to current environmental conditions. Salinity impacted juvenile and adult survival in exposures over acute timescales.
Keywords: Conservation management, estuarine fishes, salinity tolerance, thermal tolerance
Abstract
Coastal ecosystems are among the most human-impacted habitats globally, and their management is often critically linked to recovery of declining native species. In the San Francisco Estuary, the Delta Smelt (Hypomesus transpacificus) is an endemic, endangered fish strongly tied to Californian conservation planning. The complex life history of Delta Smelt combined with dynamic seasonal and spatial abiotic conditions result in dissimilar environments experienced among ontogenetic stages, which may yield stage-specific susceptibility to abiotic stressors. Climate change is forecasted to increase San Francisco Estuary water temperature and salinity; therefore, understanding the influences of ontogeny and phenotypic plasticity on tolerance to these critical environmental parameters is particularly important for Delta Smelt and other San Francisco Estuary fishes. We assessed thermal and salinity limits in several ontogenetic stages and acclimation states of Delta Smelt, and paired these data with environmental data to evaluate sensitivity to climate-change stressors. Thermal tolerance decreased among successive stages, with larval fish exhibiting the highest tolerance and post-spawning adults having the lowest. Delta Smelt had limited capacity to increase tolerance through thermal acclimation, and comparisons with field temperature data revealed that juvenile tolerance limits are the closest to current environmental conditions, which may make this stage especially susceptible to future climate warming. Maximal water temperatures observed in situ exceeded tolerance limits of juveniles and adults. Although these temperature events are currently rare, if they increase in frequency as predicted, it could result in habitat loss at these locations despite other favourable conditions for Delta Smelt. In contrast, Delta Smelt tolerated salinities spanning the range of expected environmental conditions for each ontogenetic stage, but salinity did impact survival in juvenile and adult stages in exposures over acute time scales. Our results underscore the importance of considering ontogeny and phenotypic plasticity in assessing the impacts of climate change, particularly for species adapted to spatially and temporally heterogeneous environments.
Introduction
Coastal ecosystems are among the most human-impacted habitats globally (Lotze et al., 2006), and climate change is predicted to interact with existing stressors to generate effects spanning multiple physical and biological scales (Harley et al., 2006; Crain et al., 2008). The San Francisco Estuary (SFE) is one of the largest and most economically valuable estuarine systems in North America (Service, 2007), and anthropogenic use of the SFE has resulted in it being one of the most modified and controlled systems in the world (Nichols et al., 1986). Landscape-scale modifications have reduced habitat complexity and led to major declines of once numerous native species (Sommer et al., 2007; Moyle et al., 2010), exemplified by precipitous declines of multiple pelagic fish populations since the early 2000s (referred to as the pelagic organism decline; Feyrer et al., 2007; Sommer et al., 2007). One of the species affected by the pelagic organism decline is the Delta Smelt (Hypomesus transpacificus), a fish endemic to the SFE (Bennett, 2005).
Like many other species inhabiting human-altered ecosystems, the decline of Delta Smelt has been associated with numerous stressors, such as habitat loss, entrainment at water pumping stations (i.e. fish drawn through intakes; Castillo et al., 2012), competition and predation from non-native species, food limitation due to changes in the plankton community, altered abiotic conditions and contaminants (Sommer et al., 2007; Winder and Jassby, 2011; Brooks et al., 2012; Cloern and Jassby, 2012). Listed under both the Federal Endangered Species Act and California Endangered Species Act and an indicator of SFE ecological health, recovery of Delta Smelt is a critical component of statewide management efforts to balance ecosystem restoration with ecosystem services. Specifically, resource managers are tasked with providing a reliable water supply for farmlands and over 23 million Californians, as well as the maintenance of healthy wildlife populations and ecosystem function (NRC, 2012). Determining the best management actions to accomplish these sometimes conflicting objectives has been politically and publically debated in California for over a decade, making the scientific understanding of stressor impacts on Delta Smelt important not only to effective conservation, but also to statewide environmental policies.
The SFE is subject to strong tidal influences from the Pacific Ocean mixing with fluctuating freshwater input from the Sacramento and San Joaquin Rivers (Cloern and Jassby, 2012), producing a dynamic system with spatial and seasonal gradients in water parameters (e.g. temperature, salinity). These variations in abiotic conditions may influence behavioural responses and affect physiological processes across multiple levels of biological organization in fishes such as Delta Smelt (Fry, 1971; Hochachka and Somero, 2002). Temperature is a key determinant of fish survival and performance (Brett, 1971), resulting in fishes being generally adapted to the water temperatures that they routinely experience (Fangue et al., 2006; Eliason et al., 2011). Likewise, salinity is a critical abiotic condition for fishes, and tolerance is largely dependent on physiological responses to maintain ionic and osmotic balance (reviewed by Evans, 2008). Coping with temperature and salinity stress can be associated with a high energetic cost, such that optimal performance often occurs over a relatively narrow range for each parameter (Schulte et al., 2011; Hasenbein et al., 2013). Yet temperature and salinity tolerance limits are governed by the complex interplay of mechanisms of adaptation and phenotypic plasticity, such as acclimatization, i.e. reversible biochemical changes due to environmental exposure that can alter tolerance within individuals (Schulte et al., 2011). Individuals may be able to employ phenotypic plasticity to cope with thermal or salinity stress within a range of conditions; however, beyond a certain threshold, evolutionary adaptation via natural selection is necessary to avoid extirpation or, in the case of endemic fishes such as Delta Smelt with extremely limited options for range expansion, extinction (Hofmann and Todgham, 2009, McBryan et al., 2013).
The life history of Delta Smelt is composed of a largely annual life-cycle, in which life stages vary both spatially and seasonally in the SFE. Adults inhabit the lower SFE and migrate upstream annually in the late autumn to early winter to spawn (Fig. 1), and only a small percentage of adults survive their first spawn (Bennett, 2005). Larval fish develop in freshwater habitats until migrating downstream as juveniles towards the low-salinity zone (1–6 ppt) in late spring, where they remain throughout the summer and early autumn as they mature into adults (Bennett, 2005). Although Delta Smelt are not extremely strong swimmers (Swanson et al., 1998), they are thought to use tidal currents to accomplish this migrational pattern (Moyle et al., 2010). Water temperatures in the SFE usually peak in late summer and are lowest during winter months, with the highest temperatures occurring in freshwater habitat upstream (e.g. range 10–29°C for 2002–10; Fig. 1; Kimmerer, 2004; CDFW, 2013). Salinity increases from freshwater in upstream headwaters to seawater (∼34 ppt) commonly westward of Suisun Bay; however, the geographical position of the salinity gradient can also fluctuate temporally on scales from daily to seasonal to annual (CDFW, 2013). Thus, the dynamic environmental conditions combined with the seasonal migrations and the primarily annual life-cycle of Delta Smelt present distinct environmental conditions to each ontogenetic stage (Bennett, 2005; Moyle et al., 2010). This may confer differential tolerance for temperature and salinity among ontogenetic stages and result in particular stages having higher sensitivity to environmental change.
Figure 1:

Map of the San Francisco Estuary depicting estimated habitat regions for different ontogenetic stages of Delta Smelt, where abiotic conditions, including salinity and temperature, fluctuate spatially and temporally.
Understanding the influences of ontogeny and acclimatization responses on the temperature and salinity tolerance of the Delta Smelt is particularly important because forecasted impacts of climate change in SFE include increases in the mean and variability of these environmental parameters (Cayan et al., 2008; Cloern et al., 2011). These climatic effects will be likely to augment the impacts of anthropogenic water diversion, which has already reduced the amount of freshwater inflow into the SFE by ∼40% on average (Lund et al., 2010), resulting in higher salinities upstream during the autumn (Cloern and Jassby, 2012) and increased summer water temperatures (Moyle et al., 2010). As these changes occur, the ability of Delta Smelt and other SFE fishes to maintain fitness in their native habitats will depend on their tolerance limits, phenotypic plasticity, adaptive capacity and related biotic interactions (Helmuth, 2009; Hofmann and Todgham, 2009). Furthermore, as a largely annual species, Delta Smelt recruitment is almost exclusively dependent on the fitness of the cohort in the previous year (Bennett, 2005); combined with their limited range, this may make Delta Smelt susceptible to declines due to poor environmental conditions in a single year.
As management plans are designed and implemented in the SFE to protect and restore wildlife in the face of climate change (e.g. on-going planning of large-scale tidal marsh restoration by the US Fish and Wildlife Service), understanding the physiological responses of organisms is paramount to effective conservation (Wikelski and Cooke, 2006). Previous studies of the thermal and salinity tolerance of Delta Smelt reported physiological limits for adults at one acclimation temperature (Swanson et al., 2000), which are currently used for climate-change impact assessments (Cloern et al., 2011, Brown et al. 2013) across the entire SFE and specific management regulations, such as restriction of water diversion flows to protect larval and juvenile Delta Smelt (USFWS, 2008). In this study, we assess thermal and salinity tolerance across ontogenetic stages and acclimation conditions to investigate the phenotypic plasticity in Delta Smelt responses to these climate-change stressors. We then employ several tolerance indices to evaluate the ‘buffer’ between Delta Smelt physiological limits and current habitat conditions to demonstrate differential sensitivity to climate warming among ontogenetic stages in this endangered species. Our study underscores the importance of assessing differences across life-cycles to climate change projections, particularly for species adapted to spatially and temporally heterogeneous environments.
Materials and methods
Fish culture and holding conditions
Fish were spawned between February and April in 2012 or 2013 and reared in optimal culture conditions (15.4–16.7°C) determined for Delta Smelt at the UC Davis Fish Conservation and Culture Laboratory (FCCL; Byron, CA, USA; Baskerville-Bridges et al., 2005; Lindberg et al., 2013). The Delta Smelt refuge population breeding programme at FCCL incorporates a unique genetic management strategy that includes a variety of methods to minimize inbreeding, maintain genetic representation from the wild founding population and maximize genetic diversity (Fisch et al., 2009, 2013). We conducted experiments for five ontogenetic stages defined by days post hatch (dph), as follows: larval (30–32 dph), late-larval (60–64 dph), juvenile (140–164 dph), adult (200–250 dph) and post-spawning adults (>300 dph). We performed larval and late-larval fish experiments at FCCL, where fish were held under a natural photoperiod and fed live prey from cultures of rotifers (Brachionus plicatus) and brine shrimp nauplii (Artemia franciscana); Nannochloropsis (Reed Mariculture, Campbell, CA, USA) was used to increase water turbidity to promote feeding (Baskerville-Bridges et al., 2004). We conducted experiments for post-larval stages (juveniles, adults and post-spawning adults) at the UC Davis Putah Creek aquaculture facility. Post-larval fish were fed an ad libitum 2:1 mixture of Inve-NRD commercial feed (Inve Aquaculture, Salt Lake City, UT, USA) and Hikari plankton (Pentair Aquatic Ecosystems, Apopka, FL, USA) throughout the day via automatic feeders under a natural photoperiod. Water quality was monitored daily with a YSI 556 water quality instrument (YSI Incorporated, Yellow Springs, OH, USA) for pH (8.6 ± 0.38) and dissolved oxygen (100–105% saturation). We used biological filtration, via a custom wet–dry filter that trickled water over Bio-Balls in an oxygen-rich chamber, with flushing to remove nitrogenous waste, and monitored ammonia and nitrite daily using a colorimetric test kit (API, Calfont, PA, USA). All handling, care and experimental procedures used were reviewed and approved by the UC Davis Institutional Animal Care and Use Committee (IACUC Protocol # 16591).
Chronic lethal thermal maximum experiments
We quantified upper thermal acclimation limits using chronic thermal tolerance methodology (Bennett et al., 1997). We conducted chronic lethal thermal maximum (CLTmax) experiments only for post-larval stages (i.e. juveniles, adults and post-spawning adults) because larval fish require low light, black containers, minimal disturbance and elevated turbidities for feeding, and these rearing conditions inhibit accurate mortality estimations (Baskerville-Bridges et al., 2005). For each stage, we defined CLTmax as the highest temperature at which 50% (CLTmax50) and 95% (CLTmax95) morbidity was observed (Fields et al., 1987; Bennett and Beitinger, 1997). Fish remained in three 340 l holding tanks after 3 week acclimation periods (at 18.7 ± 0.2°C) while we increased temperature by 1°C/day until 100% mortality. We recorded temperature twice daily using a YSI 556 water quality instrument (YSI Incorporated) calibrated to a laboratory standard thermometer and hourly via iBCod temperature loggers (Alpha Mach, Inc., Ste-Julie, QC, Canada) submerged in each experimental tank.
Critical thermal maximum experiments
We determined upper temperature tolerance in Delta Smelt using critical thermal methodology (CTM; Beitinger et al., 2000), specifically quantifying critical thermal maximum (CTmax), defined as the upper temperature at which fish lose the ability to escape conditions that will ultimately lead to death (Cox, 1974). Larval and late-larval fish only were held at optimal culture temperatures of 16.4 ± 0.25°C at FCCL, and we split post-larval fish held at the UC Davis Putah Creek facility into the following three acclimation groups: low (12.0–12.5°C); medium (15.5–16.5°C); and high (18.5–19.5°C; Table S1). We brought fish to each of the acclimation conditions by increasing or decreasing temperature by 1°C/day, and subsequently held fish at the final acclimation temperatures for at least 3 weeks prior to CTmax experiments (Beitinger et al., 2000). For each CTmax trial, we placed a randomly selected fish in a 2 l black chamber filled with water at the respective acclimation temperature and covered with black mesh. We placed chambers in a 115 l water bath at acclimation temperature, and each chamber was fitted with an airstone to maintain dissolved oxygen at 100–105% saturation, a temperature logger and a glass thermometer calibrated to a laboratory standard thermometer. We fitted the water baths with titanium heaters, temperature controllers (Finnex Schuber Wright, Chicago, IL, USA) and Danner MD3 pumps (Pentair Aquatic Ecosystems, Apopka, FL, USA) to ensure even heating and circulation. Once in the chamber, each fish was given a 30–45 min habituation period prior to the start of the temperature increase. We used a thermal increase of 0.3°C/min for CTmax trials so that fish core temperatures would closely track changes in water temperature without allowing time for fish to acclimate thermally during the experiments (Becker and Genoway, 1979). We recorded temperatures and monitored fish for activity every 5 min until any abnormal behaviour was observed, after which we monitored fish continuously. We employed loss of equilibrium (LOE) as the end-point determining CTmax, signifying ‘ecological death’ (Cox, 1974; Becker and Genoway, 1979; Beitinger et al., 2000). Once LOE was reached, we recorded the temperature and immediately returned fish to adjacent chambers containing water at the fish's original acclimation temperature and allowed them to recover. Recovered fish were weighed (wet mass ± 0.1 g) and measured (fork length ± 0.5 mm) to assess covariation of fish size and treatments (Table S1), and returned to separate holding tanks to ensure they would not be selected for subsequent CTmax trials. We calculated CTmax as the arithmetic mean of the LOE temperatures for each stage and acclimation group (Cox, 1974; Beitinger et al., 2000).
Warming tolerance assessment
Warming tolerance (WT) is a measure of an organism's thermal buffer between the current habitat temperatures and its maximal thermal limits, with WT defined as the average amount of environmental temperature change an organism can tolerate before performance drops to fatal levels (Deutsch et al., 2008). We calculated WT metrics for each ontogenetic stage as follows:
 |
where  is the mean CTmax determined for each ontogenetic stage for fish at medium acclimation temperature in experiments described above, and Thabitat is the metrics (median, 95th centile, 99th centile and maximum) of habitat water temperatures regionally and seasonally relevant for each ontogenetic stage during 2002–10. We used surface temperature data from SFE seasonal environmental monitoring surveys for Thabitat, including the Fall Mid-Water Trawl (FMWT; September–December), 20 mm Survey (20 mm; April–June), Spring Kodiak Trawl (SKT; January–May) and Summer Townet Survey (TNS; June–August; CDFW, 2013). We constructed data sets of relevant habitat temperatures for each ontogenetic stage from survey data sets as follows: (i) standardizing duration by restricting all data sets to 2002–10; (ii) including only stations at which Delta Smelt were present during that time period; and (iii) including data seasonally relevant to each ontogenetic stage. Following steps (i)–(iii), the data used from selected stations in 2002–10 for each stage were as follows: larval, 20 mm; late-larval, 20 mm and TNS; juvenile, TNS and FMWT; adult, FMWT; and post-spawning adult, SKT. We then used constructed data sets to calculate Thabitat metrics and WT values for each stage.
Chronic lethal salinity maximum experiments
We quantified upper salinity acclimation limits using chronic salinity tolerance methodology (Swanson et al., 2000). Chronic lethal salinity maximum (CLSmax) exposures were conducted for juvenile and adult Delta Smelt because chronic salinity exposure is environmentally relevant for these ontogenetic stages, and culture requirements for larval fish precluded their inclusion in CLSmax experiments (larval fish require turbidity for feeding that visually impedes accurate quantification of mortality over the time scales required for CLSmax experiments). Fish remained in three 340 l holding tanks after acclimation periods while we increased salinity by 2.0 ppt/12 h via the addition of artificial sea salt (Instant Ocean; Spectrum Brands, Inc., Blacksburg, VA, USA) into the sump of the recirculating system. We checked tanks for mortalities and recorded salinities every 12 h prior to the next salinity increase. We recorded salinities with a YSI 556 instrument, calibrated with 10 000 μS/cm National Institute of Standards and Technology traceable conductivity standard (YSI Incorporated). We increased salinity to 100% mortality or until seawater conditions were reached (34.0 ppt). If the latter conditions occurred, we held fish at 34.0 ppt for 3 weeks to monitor daily survival and assess salinity-related delayed mortality.
Acute salinity maximum experiments
We determined upper salinity tolerance in Delta Smelt by conducting acute salinity maximum (ASmax) exposures. The experimental design differed between larval and post-larval stages due to culture requirements and the environmental relevance of salinity end-points between stages. We used preliminary range-finding salinity experiments to determine treatment levels for juvenile and adult fish, and chose treatment levels for late-larval fish a priori, including three environmentally relevant salinities (0.4, 2.0 and 6.0 ppt) and two higher levels that late-larval fish may experience in rare conditions (12.0 and 18.0 ppt). For late-larval fish, we placed 15 individuals in each 9.5 l black container filled with holding tank water and fitted with airstones, mesh-covered drains and water lines to create flow-through conditions. Following an overnight acclimation period, we ramped vessels over 6 h to targeted salinities via water delivered from head tanks using peristaltic pumps. Head tanks contained holding tank water brought to target salinities using Instant Ocean, and we conducted four replicates for each of the five target salinities. We checked and removed mortalities and recorded water quality hourly during the ramping phase, followed by monitoring at each designated time point (0–6, 12, 24, 30 and 48 h). After 48 h, we removed containers individually, euthanized and counted fish to confirm survival. We conducted juvenile and adult ASmax experiments by allowing fish to remain in recirculating tanks while Instant Ocean was added to sumps over a 6 h ramp to targeted salinities. Three salinities were chosen [2.3 (control), 18.5 and 34.0 ppt] based on chronic salinity experiment results, preliminary acute experiments demonstrating these stages to be resistant to lower salinities (L. M. Komoroske, unpublished data), and because these ontogenetic stages are more likely to experience higher salinities in situ (Bennett, 2005). We monitored tanks hourly for mortalities and water quality parameters during the ramping phase, at each designated time point (0–6, 12, 24 and 48 h) and daily up to 3 weeks. At the termination of the adult ASmax experiment, fish were randomly selected from each of the three salinity treatments for CTmax trials to assess differences in thermal tolerance due to sublethal salinity stress.
Statistical analyses
We performed all statistical analyses using R (version 2.15.2; R-CoreTeam, 2012) and associated packages ‘lme4’, ‘car’ and ‘multcomp’ (Hothorn et al., 2008). We analysed data using linear models (LMs) via the R core package (R-CoreTeam, 2012) and generalized linear mixed models (GLMMs) using ‘lme4’ (Bates et al., 2011). We generated model summary tables using ‘car’ (Fox and Weisberg, 2011) and conducted multiple comparisons for both LMs and GLMMs between treatment levels of fixed effects using ‘multcomp’ (Hothorn et al., 2008). For CLTmax analysis, we employed GLMMs with a binomial error distribution and logit link function (Bates et al., 2011) to determine differences in CLTmax among stages, including a random individual fish effect to account for repeated observations. We evaluated overdispersion by estimating the ratio of residual deviance to residual degrees of freedom (Dobson, 2002). To generate model estimates and confidence intervals for the fixed effects, we sampled from a naïve posterior distribution (60 000 times) for each stage of chronic temperatures at which 50% (CLTmax50) and 95% (CLTmax95) mortality would occur (McElreath, 2013). For CTmax analysis, we conducted two separate LMs because larval and late-larval fish were available at only one acclimation temperature. We applied the first LM to all ontogenetic stages at the medium acclimation temperature only, using ontogenetic stage as a single predictor of LOE. The second LM for post-larval fish employed ontogenetic stage (juvenile, adult and post-spawning adult), acclimation temperature and their interaction as predictors of LOE (R-CoreTeam, 2012). Fish size within each ontogenetic stage did not significantly affect CTmax for any acclimation group and was therefore not included in the final LMs as a covariate. We evaluated data assumptions and LM fit graphically, i.e. residual vs. fitted values, residual vs. predictor values and residual histograms (Zuur et al., 2009).
We assessed effects of salinity and exposure duration for ASmax with the same approach described for CLTmax, using separate logit link GLMMs for: (i) the late-larval stage and (ii) juveniles and adults. We also followed the juvenile–adult model with a GLMM to evaluate differences between ontogenetic stage and salinity specifically after 96 h of exposure (logit link function, including random effect of tank). Finally, we evaluated the effect of salinity on CTmax in adult fish following ASmax exposures using an LM with salinity as a single predictor of LOE. Pairwise comparisons were performed for all analyses using the glht() function in the ‘multcomp’ package, with an adjusted α = 0.05.
Results
Thermal tolerance
Delta Smelt exhibited decreasing thermal tolerance across successive ontogenetic stages over both chronic and acute time scales. In chronic exposures, CLTmax for post-larval stages revealed decreasing upper thermal acclimation limits across successive ontogenetic stages (Fig. 2a and Table 1; post hoc adjusted P < 0.001). Temperature estimates for both 50% mortality (CLT50) and 95% mortality (CLT95) were below CTmax for each ontogenetic stage (Table S2).
Figure 2:

Thermal tolerance of Delta Smelt. (a) Estimates of chronic lethal thermal maximum (CLTmax; continuous lines) and 95% confidence intervals (dashed lines) for juvenile (blue), adult (red) and post-spawning Delta Smelt (black). Points denote the CLTmax50 and CLTmax95 estimated mean and 95% confidence interval for each ontogenetic stage on the respective curves. (b) Critical thermal maximum (CTmax) temperatures (means ± SEM) for ontogenetic stages of Delta Smelt at different acclimation temperatures, with jitter (0.05) added to each point to avoid overlapping. Capital letters denote significantly different groups across all ontogenetic stages at medium acclimation temperature only; lower case letters denote significantly different groups among stages of non-larval fish at low, medium and high acclimation temperatures. Within each case, groups not sharing a common letter are significantly different at an adjusted α level of 0.05 as determined by a linear model and pairwise comparisons. PS-Adult denotes post-spawning Delta Smelt.
Table 1:
Model results for Delta Smelt thermal tolerance
| CTmax, medium acclimation all stages | SS | Df | F | P-value |
|---|---|---|---|---|
| Ontogenetic stage | 81.45 | 4 | 29.82 | <0.001* |
| Residuals | 53.95 | 79 |
| CTmax, post-larval stages | SS | Df | F | P-value |
|---|---|---|---|---|
| Ontogenetic stage | 151.43 | 2 | 92.22 | <0.001* |
| Acclimation temperature | 117.09 | 2 | 71.31 | <0.001* |
| Ontogenetic × acclimation temperature | 15.24 | 4 | 4.64 | 0.001* |
| Residuals | 171.57 | 209 |
| CLTpost-larval stages | Wald χ2 | Df | P-value | |
|---|---|---|---|---|
| Temperature | 2300.39 | 1 | <0.001* | |
| Ontogenetic stage | 263.47 | 2 | <0.001* | |
| Temperature × ontogenetic stage | 262.52 | 2 | <0.001* |
The CTmax analyses used linear models (Gaussian error distributions), and CLT analysis employed a generalized linear mixed model (binomial error distribution). See text for pairwise comparisons.
Acute thermal tolerance of Delta Smelt (CTmax) across all stages examined at the medium acclimation temperature was highest in larval fish (Fig. 2b, Table 1 and Table S2). The CTmax decreased with each subsequent ontogenetic stage (adjusted P ≤ 0.05), with the exceptions of between adults and juveniles (adjusted P = 0.95) and between adults and late-larval fish (adjusted P = 0.087).
For post-larval stages of Delta Smelt, acclimation temperature, ontogenetic stage and their interaction were significant factors influencing CTmax (Fig. 2b, Table 1 and Table S2). Within each stage, CTmax for the lowest acclimation group was significantly reduced relative to both medium and high acclimation temperature groups (adjusted P ≤ 0.03; Fig. 2b and Tables S2 and S3). However, the CTmax values of medium and high acclimation temperature groups did not differ from each other (adjusted P ≥ 0.24), indicating that effects of acclimation on thermal tolerance are minimal at higher temperatures in Delta Smelt.
Warming tolerance
Using current median environmental temperature metrics for Thabitat, all Delta Smelt ontogenetic stages exhibited a WT >8°C, with juvenile Delta Smelt exhibiting the lowest warming tolerance followed by late-larval fish (Fig. 3 and Table 2). However, applying additional Thabitat metrics that encompass extreme events with potential important biological consequences, the WT of all stages was greatly reduced (Table 2). In rare events, observed habitat temperatures exceeded the CTmax for juvenile and adult Delta Smelt, resulting in WT <0. Although post-spawning Delta Smelt have lower thermal tolerance relative to other stages, they had the highest WT due to expected seasonal timing of their presence (January–May). However, these results do not evaluate WT of fish surviving first-year spawning throughout subsequent seasons, potentially to spawn a second year, because no adequate thermal tolerance data were available for Delta Smelt beyond the first-year post-spawning stage.
Figure 3:
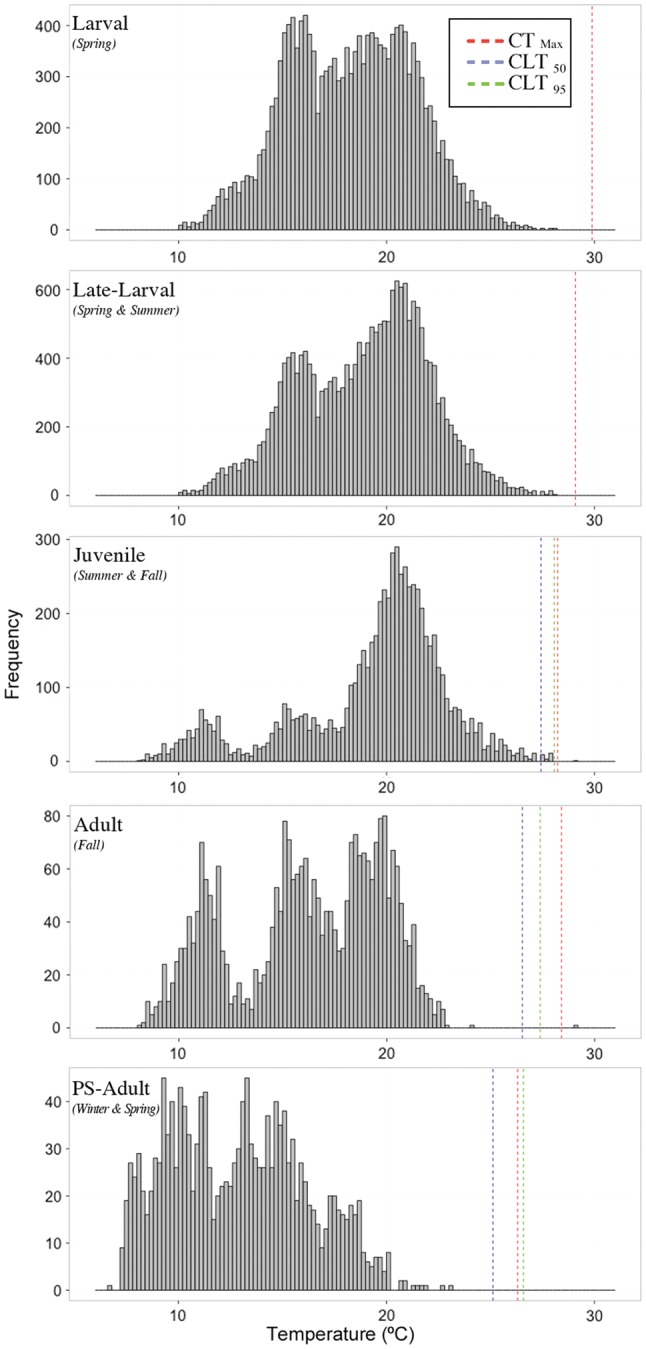
Habitat temperature profiles for each ontogenetic stage of Delta Smelt examined and the corresponding thermal tolerances determined in this study. The histograms depict constructed data sets of water temperature distributions relevant for each ontogenetic stage; red dashed lines indicate the mean CTmax for each stage of fish at medium acclimation temperature; dashed blue and green lines depict the CLTmax50 and CLTmax95, respectively, for each stage in post-larval fish.
Table 2:
Warming tolerance estimates for each stage of Delta Smelt, defined as  − Thabitat (metrics of habitat temperatures)
| Ontogenetic stage |
Thabitat |
|||
|---|---|---|---|---|
| Median | 95th centile | 99th centile | Maximum | |
| 30 dph | 11.58 | 6.88 | 4.98 | 1.88 |
| 60 dph | 9.79 | 5.49 | 3.59 | 1.09 |
| Juvenile | 8.03 | 4.13 | 2.03 | −0.77 |
| Adults | 11.91 | 7.41 | 6.31 | −0.59 |
| PS-Adults | 13.41 | 7.81 | 6.31 | 3.21 |
Salinity tolerance
Increased salinity affected Delta Smelt survival only in extreme conditions, and was dissimilar among stages. In ASmax exposures, salinity did not affect survival of late-larval fish among any environmentally relevant salinities (0.4–18 ppt; Table 3); however, both juvenile and adult survival was negatively affected by increased salinity (Fig. 4 and Table 3). For adults and juveniles, principal mortality occurred between 24 and 96 h; after 96 h, survival was reduced in the highest treatment (34.0 ppt) relative to medium (18.5 ppt) and control (2.3 ppt), and survival of juveniles was significantly lower than that of adults (post hoc adjusted P < 0.001). Survival in ASmax experiments at 96 h and 2.3 ppt was 100% for adults and 99.4% for juveniles; at 18.5 ppt it was 99.2% for adults and 100% for juveniles; and at 34.0 ppt it was 81.5% for adults and 64.5% for juveniles. These results indicate that a substantial proportion of Delta Smelt in these stages can withstand even extreme changes in salinity conditions. Furthermore, in CLSmax experiments, salinity did not affect adult or juvenile survival [survival was 100% for adults (n = 153) and 99.0% for juveniles (n = 287)], which covered the same salinity range (2.3–34.0 ppt), but with a slower rate of increase (2 ppt/12 h). We also did not detect delayed mortality in fish held at 34 ppt for 3 weeks after CLSmax exposures (survival at 3 weeks was 99.3% for adults and 99.0% for juveniles). Finally, CTmax among surviving adult Delta Smelt at the termination (14 days) of the ASmax experiments did not differ among 2.3, 18.5 and 34.0 ppt treatments (Table 3), indicating that acute salinity exposure did not impact thermal tolerance.
Table 3:
Model results for Delta Smelt salinity tolerance
| Acute salinityjuvenile and adult over 14-day exposure | Wald χ2 | Df | P-value | |
|---|---|---|---|---|
| Salinity | 24.78 | 3 | <0.001* | |
| Ontogenetic stage | 0.424 | 2 | 0.809 | |
| Experimental hour | 407.0 | 1 | <0.001* | |
| Salinity × stage | 7.742 | 2 | 0.021* | |
| Salinity × experimental hour | 2.775 | 2 | 0.250 | |
| Stage × experimental hour | 0.075 | 1 | 0.784 | |
| Salinity × stage × experimental hour | 0.004 | 2 | >0.998 |
| Acute salinityjuvenile and adult at 96 h exposure | Wald χ2 | Df | P-value | |
|---|---|---|---|---|
| Salinity | 66.2682 | 2 | <0.001* | |
| Ontogenetic stage | 10.2204 | 1 | 0.001* | |
| Salinity × stage | 0.0002 | 2 | >0.999 |
| Acute salinitylate-larval 48 h exposure | Wald χ2 | Df | P-value | |
|---|---|---|---|---|
| Salinity | 0.183 | 4 | 0.996 | |
| Experimental hour | 9.803 | 6 | 0.133 | |
| Salinity × experimental hour | 6.413 | 24 | 0.999 |
| CTmax, adults post 2-week salinity exposure | SS | Df | F | P-value |
|---|---|---|---|---|
| Salinity | 1.574 | 2 | 1.61 | 0.209 |
| Residuals | 27.40 | 56 |
We used generalized linear mixed models (binomial error distributions) to analyse acute salinity exposures, a linear model (Gaussian error distributions) CTmax across salinity groups. See text for pairwise comparisons.
Figure 4:

Cumulative proportional survival of juvenile and adult Delta Smelt in acute salinity maximum over 2 weeks of exposure (low salinity, 2.3 ppt, medium salinity, 18.5 ppt; and high salinity, 34.0 ppt). Late-larval data are not shown because they did not exhibit any significant difference in survival across salinity treatments.
Discussion
Understanding how organisms will respond to climate change is critical if conservation and management strategies are to be successful in the long term (Helmuth, 2009; Hoffmann and Sgro, 2011). The physiological capacity of organisms to cope with predicted alterations in abiotic conditions is a critical component of their responses to climate change, and can be heavily influenced by phenotypic plasticity and life history (Stillman, 2003; Wikelski and Cooke, 2006; Pörtner and Farrell, 2008). The thermal tolerance of Delta Smelt generally decreased among successive ontogenetic stages, and they had limited capacity to increase tolerance via thermal acclimation. Juvenile Delta Smelt exhibited the lowest WT, and rare maximal temperatures in situ have already been observed that exceed tolerance limits of juvenile and adult Delta Smelt. In contrast, the salinity tolerance of Delta Smelt spanned the range of expected environmental conditions for each ontogenetic stage; however, salinity did impact juvenile and adult survival under high fluctuation.
The higher thermal tolerance we observed in larval Delta Smelt relative to older stages is consistent with their developmental and evolutionary history. Delta Smelt swim bladder and fin development are not complete until ∼65 dph (∼20 mm total length; Mager et al., 2004), when they can fully control their buoyancy and efficiently use tidal and river currents to migrate. Before this time, they are likely to have limited control over their movements and are thought to be mostly demersal in shallow shoaling sandy areas (Mager et al., 2004; Moyle et al. 2010) where temperatures can quickly increase. The understanding of Delta Smelt larval behaviour and habitat preferences is currently limited to a few laboratory and field survey studies (Baskerville-Bridges et al., 2004; Dege and Brown, 2004; Mager et al., 2004), and Delta Smelt larvae have been observed in deeper river channel habitats (Grimaldo et al., 2004). However, if Delta Smelt have indeed evolved to use shallow shoaling sandy areas during these early ontogenetic stages, this could contribute to the increased thermal tolerance we observed in larval and late-larval stages. Organisms with limited mobility may exhibit higher environmental stress tolerance relative to mobile organisms that can cope behaviourally by moving to areas with favourable environmental conditions (Menge and Olson, 1990), so it may be that larval Delta Smelt with limited mobility may experience selective pressures favouring enhanced thermal tolerance. There is also some evidence that water export pumping schedules in the SFE may recently have favoured survival of smaller, late-spawned larval fish (Bennett et al., 2008; Bennett, 2011). If this is the case, anthropogenically driven selection coupled with seasonal conditions could also contribute to enhanced thermal tolerance because late-spawned larval fish must be able to survive in warmer late spring and early summer shallow waters.
Species with the highest risk of extinction from climate change are those that have little tolerance for warming, limited acclimation capacity and tight constraints on dispersal (Deutsch et al., 2008). While these concepts have primarily been taken to confer that tropical species are at higher risk relative to temperate species, these criteria are also met by many endemic aquatic species. These species include temperate fishes (Ficke et al., 2007) and invertebrates (Muhlfeld et al., 2011) that are adapted to regional conditions and confined to lakes, riverine or estuarine ecosystems that offer few avenues of dispersal. Native SFE fishes are adapted to the local abiotic conditions and have very little ability to disperse poleward if water temperatures make their current habitat unsuitable. As an endemic fish with largely non-overlapping generations (Bennett, 2005), Delta Smelt population persistence relies on individuals surviving high larval mortality pressures each year to reach reproductive stages. Coupled with water temperatures being closest to juvenile tolerance limits, these life-history dynamics potentially make Delta Smelt especially susceptible to population decline from a single hot year. Conversely, providing suitable thermal habitat for juveniles can also potentially have positive impacts on the population. Understanding these relationships provides insight into where and when to target management efforts. Recent climate-change assessments indicate that SFE waters are likely to become warmer and the low-salinity zone may move further upstream, limiting optimal habitat for Delta Smelt in the absence of mitigation actions (Brown et al., 2013). Effective conservation strategies to ensure that Delta Smelt habitat maintains suitable thermal conditions during summer and autumn may prove to be critical for the sustainability of this species in the wild.
Post-spawning Delta Smelt had higher WT despite their lowered tolerances because of the seasonal timing of this stage during winter and spring. However, a small percentage of adults are estimated to survive their first year post-spawning (Bennett, 2005), but to reach a second reproductive season they must be able to cope with environmental fluctuations throughout the following year. Second-year fish have higher fecundity (Bennett, 2005) but are rarely observed in situ, limiting their reproductive contribution to the population. While the lack of 2-year-old Delta Smelt in the wild may be attributable to many factors, such as food limitation, disease or susceptibility to predation, if they are not able to improve their tolerance after recovering from spawning, the thermal sensitivity of post-spawning fish may also play an important role in limiting their presence due to heightened water temperatures in summer and early autumn. The substantially lowered thermal tolerance of post-spawning adults also underscores the importance of considering timing of abiotic stressors with biological stressors, such as the energetic costs of gonadal development, migration and spawning, in evaluating species' sensitivity to climate change (Perry et al., 2005; Pörtner and Farrell, 2008).
In complex ecosystems with multiple stressors, such as the SFE, isolation and evaluation of the effects of individual factors is critical to understanding their contribution to observations in situ. Despite the high salinity tolerance we observed, the distribution of juvenile and adult Delta Smelt in the SFE has been strongly correlated with the low-salinity zone (1–6 ppt; Bennett, 2005; Feyrer et al., 2011). This suggests that other factors limit their ability to expand into high salinities, such as reduced physiological performance due to osmoregulatory costs (Hasenbein et al., 2013) or other ecological elements that co-vary with salinity, e.g. marine predators, food resources or habitat structure (Bennett, 2005). Thus, while the fundamental niche of Delta Smelt encompasses a wide salinity range, their realized niche may be principally in the low-salinity zone (Hutchinson, 1957), and the combined impacts of climate change and increased anthropogenic resource demands pushing the low-salinity zone further upstream could reduce Delta Smelt optimal habitat.
Our study demonstrates the need to consider life history in assessing climate-change impacts, particularly for species adapted to spatially and temporally heterogeneous environments. Synergistic effects between climate and other anthropogenic threats have been predicted to intensify climate-change impacts in other systems (Harley et al., 2006), and are also likely to occur in the highly anthropogenically modified SFE unless effective conservation approaches are implemented. With the multitude of biological stressors and competing human resource use needs in the SFE, this will undoubtedly be very challenging; however, understanding the physiological capacity of sensitive organisms to cope with altered temperature and salinity regimens is critical to the development of successful conservation and restoration strategies.
Supplementary material
Supplementary material is available at Conservation Physiology online.
Funding
This work was supported by the University of California Agricultural Experiment Station [grant number 2098-H to N.A.F.], the United States Department of Interior, Bureau of Reclamation [contract number R12AP20018 to R.E.C. and N.A.F.], the State and Federal Contractors Water Agency [grant number 201301957 to R.E.C.] and the California Delta Stewardship Council [contract number 201015533 to R.E.C. and N.A.F.]. Partial student funding was provided to M.H. by the Bavarian Elite Programme Universität Bayern e.V.-Scholarship for graduate students and post-graduate students, and to L.M.K. by the National Science Foundation Graduate-12 Fellowship Program [under DGE grant number 0841297 to S. L. Williams and B. Ludaescher] and the California Sea Grant Delta Science Doctoral Fellowship R/SF-56.
Supplementary Material
Acknowledgements
The authors thank FCCL staff, in particular L. Ellison, G. Tigan and M. Nagel, for extensive assistance facilitating experiments and providing experimental fish, as well as invaluable knowledge on the culture and handling of Delta Smelts. The authors thank D. Cocherell, R. Kaufman, P. Lutes and E. Hallen for providing experimental facilities and fish husbandry expertise, B. Decourten, J. Dexter and R, McPherson for their assistance with experiments, M. A. Whalen for statistical analysis consultation, F. Feyrer for graciously providing an SFE template shp file for use in Fig. 1, A. E. Steel for Geographic Information System technical expertise and S. Slater for consultation on analysis of SFE environmental monitoring data. The authors would also like to thank J. J. Cech Jr, R. L. Lewison and two anonymous reviewers for constructive comments on data interpretation and previous drafts that improved this manuscript.
References
- 1.Baskerville-Bridges B, Lindberg JC, Van Eenennaam J, Doroshov SI. (2004) The effect of light intensity, alga concentration, and prey density on the feeding behavior of Delta Smelt larvae. In Feyrer F, Brown L, Brown R, Orsi J, eds, Early Life History of Fishes in the San Francisco Estuary and Watershed. American Fisheries Society, Bethesda, MD, pp 219–227. [Google Scholar]
- 2.Baskerville-Bridges B, Lindberg JC, Doroshov SI. (2005) Manual for the Intensive Culture of Delta Smelt (Hypomesus transpacificus). Report to CALFED Bay-Delta Program. University of California, Davis, Sacramento, CA. [Google Scholar]
- 3.Bates D, Maechler M, Bolker B. (2011) lme4: Linear mixed-effects models using S4 classes (R software package). [Google Scholar]
- 4.Becker C, Genoway R. (1979) Evaluation of the critical thermal maximum for determining thermal tolerance of freshwater fish. Environ Biol Fish 4: 245–256. [Google Scholar]
- 5.Beitinger TL, Bennett WA, McCauley RW. (2000) Temperature tolerances of North American freshwater fishes exposed to dynamic changes in temperature. Environ Biol Fish 58: 237–275. [Google Scholar]
- 6.Bennett W. (2005) Critical assessment of Delta Smelt in the San Francisco Estuary, California. San Francisco Estuary Watershed Sci 3: 1–72. [Google Scholar]
- 7.Bennett W. (2011) The “big-mama” hypothesis: evaluating a subtle link between water export operations and the decline of Delta Smelt. Final Report, prepared for the State Water Resources Control Board, Sacramento, CA. [Google Scholar]
- 8.Bennett WA, Beitinger TL. (1997) Temperature tolerance of the sheepshead minnow, Cyprinodon variegatus. Copeia 1: 77–87. [Google Scholar]
- 9.Bennett WA, Currie RJ, Wagner PF, Beitinger TL. (1997) Cold tolerance and potential overwintering of the Red-Bellied Piranha Pygocentrus nattereri in the United States. Trans Am Fish Soc 126: 841–849. [Google Scholar]
- 10.Bennett WA, Hobbs JA, Teh SJ. (2008) Interplay of environmental forcing and growth-selective mortality in the poor year-class success of Delta Smelt in 2005. Final report: “Fish otolith and condition study 2005”. Prepared for the POD Management Team of the Interagency Ecological Program for the San Francisco Estuary, San Francisco, CA. [Google Scholar]
- 11.Brett JR. (1971) Energetic responses of salmon to temperature-study of some thermal relations in physiology and freshwater ecology of Sockeye Salmon (Oncorhynchus nerka). Am Zool 11: 99–113. [Google Scholar]
- 12.Brooks ML, Fleishman E, Brown LR, Lehman PW, Werner I, Scholz N, Mitchelmore C, Lovvorn JR, Johnson ML, Schlenk D, et al. (2012) Life histories, salinity zones, and sublethal contributions of contaminants to pelagic fish declines illustrated with a case study of San Francisco Estuary, California, USA. Estuar Coast 35: 603–621. [Google Scholar]
- 13.Brown LR, Bennett WA, Wagner RW, Morgan-King T, Knowles N, Feyrer F, Schoellhamer DH, Stacey MT, Dettinger M. (2013) Implications for future survival of delta smelt from four climate change scenarios for the Sacramento–San Joaquin Delta, California. Estuar Coast 36: 754–774. [Google Scholar]
- 14.Castillo G, Morinaka J, Lindberg J, Fujimura R, Baskerville-Bridges B, Hobbs J, Tigan G, Ellison L. (2012) Pre-screen loss and fish facility efficiency for Delta Smelt at the South Delta's State Water Project, California. San Francisco Estuary Watershed Sci 10: 1–23. [Google Scholar]
- 15.Cayan DR, Maurer EP, Dettinger MD, Tyree M, Hayhoe K. (2008) Climate change scenarios for the California region. Clim Change 87: S21–S42. [Google Scholar]
- 16.CDFW (California Department of Fish and Wildlife) (2013) Publically available survey data. http://www.dfg.ca.gov/delta/data/ [Google Scholar]
- 17.Cloern JE, Jassby AD. (2012) Drivers of change in estuarine-coastal ecosystems: discoveries from four decades of study in San Francisco Bay. Rev Geophys 50: pRG4001. [Google Scholar]
- 18.Cloern J, Knowles N, Brown L, Cayan D, Dettinger M, Morgan T, Schoellhamer D, Stacey M, van der Wegen M, Wagner R, et al. (2011) Projected evolution of California's San Francisco Bay-Delta-River system in a century of climate change. PLoS One 6: pe24465. [DOI] [PMC free article] [PubMed] [Google Scholar]
- 19.Cox D. (1974) Effects of three heating rates on the critical thermal maximum of Bluegill. In Gibbons W, Sharitz R, eds, Thermal Ecology. National Technical Information Service, Springfield, IL, pp 158–163. [Google Scholar]
- 20.Crain CM, Kroeker K, Halpern BS. (2008) Interactive and cumulative effects of multiple human stressors in marine systems. Ecol Lett 11: 1304–1315. [DOI] [PubMed] [Google Scholar]
- 21.Dege M, Brown LR. (2004) Effect of outflow and spring and summertime distribution and abundance of larval and juvenile fishes in the upper San Francisco Estuary. In Feyrer F, Brown LR, Brown RL, Orsi JJ, eds, Early Life History of Fishes in the San Francisco Estuary and Watershed. American Fisheries Society Symposium 39, Bethesda, MD, pp. 49–65. [Google Scholar]
- 22.Deutsch CA, Tewksbury JJ, Huey RB, Sheldon KS, Ghalambor CK, Haak DC, Martin PR. (2008) Impacts of climate warming on terrestrial ectotherms across latitude. Proc Natl Acad Sci USA 105: 6668–6672. [DOI] [PMC free article] [PubMed] [Google Scholar]
- 23.Dobson A. (2002) An Introduction to Generalized Linear Models. Chapman and Hall, London. [Google Scholar]
- 24.Eliason EJ, Clark TD, Hague MJ, Hanson LM, Gallagher ZS, Jeffries KM, Gale MK, Patterson DA, Hinch SG, Farrell AP. (2011) Differences in thermal tolerance among Sockeye Salmon populations. Science 332: 109–112. [DOI] [PubMed] [Google Scholar]
- 25.Evans D. (2008) Teleost fish osmoregulation: what have we learned since August Krogh, Homer Smith, and Ancel Keys. Am J Physiol Regul Integr Comp Physiol 295: R704–R713. [DOI] [PubMed] [Google Scholar]
- 26.Fangue NA, Hofmeister M, Schulte P. (2006) Intraspecific variation in thermal tolerance and heat shock protein gene expression in common killifish, Fundulus heteroclitus. J Exp Biol 209: 2859–2872. [DOI] [PubMed] [Google Scholar]
- 27.Feyrer F, Nobriga ML, Sommer TR. (2007) Multidecadal trends for three declining fish species: habitat patterns and mechanisms in the San Francisco Estuary, California, USA. Can J Fish Aquat Sci 64: 723–734. [Google Scholar]
- 28.Feyrer F, Newman K, Nobriga ML, Sommer TR. (2011) Modeling the effects of future outflow on the abiotic habitat of an imperiled estuarine fish. Estuar Coast 34: 120–128. [Google Scholar]
- 29.Ficke AD, Myrick CA, Hansen LJ. (2007) Potential impacts of global climate change on freshwater fisheries. Rev Fish Biol Fisher 17: 581–613. [Google Scholar]
- 30.Fields R, Lowe S, Kaminski C, Whitt G, Philipp D. (1987) Critical and chronic thermal maxima of northern and Florida Largemouth Bass and their reciprocal F1 and F2 hybrids. Trans Am Fish Soc 116: 856–863. [Google Scholar]
- 31.Fisch K, Petersen J, Baerwald M, Pedroia J, May B. (2009) Characterization of 24 microsatellite loci in delta smelt, Hypomesus transpacificus, and their cross-species amplification in two other smelt species of the Osmeridae family. Mol Ecol Resour 9: 405–408. [DOI] [PubMed] [Google Scholar]
- 32.Fisch K, Ivy J, Burton R, May B. (2013) Evaluating the performance of captive breeding techniques for conservation hatcheries: a case study of the delta smelt captive breeding program. J Hered 104: 92–104. [DOI] [PubMed] [Google Scholar]
- 33.Fox J, Weisberg S. (2011) An {R} Companion to Applied Regression. Sage, Thousand Oaks, CA. [Google Scholar]
- 34.Fry F. (1971) The effect of environmental factors on the physiology of fish. In Hoar W, Randall D, eds, Fish Physiology. Academic Press, New York, NY, pp 1–98. [Google Scholar]
- 35.Grimaldo LF, Miller RE, Peregrin CM, Hymanson ZP. (2004) Spatial and temporal distribution of native and alien ichthyoplankton in three habitat types of the Sacramento–San Joaquin Delta. In Feyrer F, Brown LR, Brown RL, Orsi JJ, eds, Early Life History of Fishes in the San Francisco Estuary and Watershed. American Fisheries Society Symposium 39, Bethesda, MD, pp. 81–96. [Google Scholar]
- 36.Harley CDG, Hughes AR, Hultgren KM, Miner BG, Sorte CJB, Thornber CS, Rodriguez LF, Tomanek L, Williams SL. (2006) The impacts of climate change in coastal marine systems. Ecol Lett 9: 228–241. [DOI] [PubMed] [Google Scholar]
- 37.Hasenbein M, Komoroske LM, Connon RE, Geist J, Fangue NA. (2013) Turbidity and salinity affect feeding performance and physiological stress in the endangered delta smelt. Integr Comp Biol 53: 620–634. [DOI] [PubMed] [Google Scholar]
- 38.Helmuth B. (2009) From cells to coastlines: how can we use physiology to forecast the impacts of climate change? J Exp Biol 212: 753–760. [DOI] [PubMed] [Google Scholar]
- 39.Hochachka P, Somero G. (2002) Biochemical Adaptation: Mechanism and Process in Physiological Evolution. Oxford University Press, New York, NY. [Google Scholar]
- 40.Hoffmann AA, Sgro CM. (2011) Climate change and evolutionary adaptation. Nature 470: 479–485. [DOI] [PubMed] [Google Scholar]
- 41.Hofmann G, Todgham A. (2009) Living in the now: physiological mechanisms to tolerate a rapidly changing environment. Annu Rev Physiol 404: 16–24. [DOI] [PubMed] [Google Scholar]
- 42.Hothorn T, Bretz F, Westfall P. (2008) Simultaneous inference in general parametric models. Biom J 50: 346–363. [DOI] [PubMed] [Google Scholar]
- 43.Hutchinson GE. (1957) Populaton studies – animal ecology and demography – concluding remarks. Cold Spring Harb Symp Quant Biol 22: 415–427. [Google Scholar]
- 44.Kimmerer W. (2004) Open-water processes of the San Francisco Estuary: from physical forcing to biological responses. San Francisco Estuary Watershed Sci 2: 1–142. [Google Scholar]
- 45.Lindberg J, Tigan G, Ellison L, Rettinghouse T, Nagel M, Fisch K. (2013) Aquaculture methods for a genetically managed population of endangered Delta Smelt. N Am J Aquacult 75: 186–196. [Google Scholar]
- 46.Lotze HK, Lenihan HS, Bourque BJ, Bradbury RH, Cooke RG, Kay MC, Kidwell SM, Kirby MX, Peterson CH, Jackson JBC. (2006) Depletion, degradation, and recovery potential of estuaries and coastal seas. Science 312: 1806–1809. [DOI] [PubMed] [Google Scholar]
- 47.Lund J, Hanak E, Fleenor W, Bennett W, Howitt R, Mount J, Moyle P. (2010) Comparing Futures for the Sacramento-San Joaquin Delta. Public Policy Institute of California, San Francisco, CA. [Google Scholar]
- 48.McBryan TL, Anttila K, Healy TM, Schulte PM. (2013) Responses to temperature and hypoxia as interacting stressors in fish: implications for adaptation to environmental change. Integr Comp Biol 53: 648–659. [DOI] [PubMed] [Google Scholar]
- 49.McElreath R. (2013) Statistical Rethinking R package. University of California, Davis, Davis, CA. [Google Scholar]
- 50.Mager R, Doroshov S, Van Eenennaam J, Brown R. (2004) Early life stages of Delta Smelt. In Feyrer F, Brown L, Brown R, Orsi J, eds, Early Life History of Fishes in the San Francisco Estuary and Watershed. American Fisheries Society, Bethesda, MD, pp 169–180. [Google Scholar]
- 51.Menge BA, Olson AM. (1990) Role of scale and environmental factors in regulation of community structure. Trends Ecol Evol 5: 52–57. [DOI] [PubMed] [Google Scholar]
- 52.Moyle P, Bennett W, Fleenor W, Lund J. (2010) Habitat variability and complexity in the upper San Francisco Estuary. San Francisco Estuary Watershed Sci 8: 1–24. [Google Scholar]
- 53.Muhlfeld CC, Giersch JJ, Hauer FR, Pederson GT, Luikart G, Peterson DP, Downs CC, Fagre DB. (2011) Climate change links fate of glaciers and an endemic alpine invertebrate. Clim Change 106: 337–345. [Google Scholar]
- 54.Nichols F, Cloern J, Luoma S, Peterson D. (1986) The modification of an estuary. Science 231: 567–573. [DOI] [PubMed] [Google Scholar]
- 55.NRC (National Research Council) (2012) Sustainable Water and Environmental Management in the California Bay-Delta. The National Academies Press, Washington, DC. [Google Scholar]
- 56.Perry AL, Low PJ, Ellis JR, Reynolds JD. (2005) Climate change and distribution shifts in marine fishes. Science 308: 1912–1915. [DOI] [PubMed] [Google Scholar]
- 57.Pörtner HO, Farrell AP. (2008) Physiology and climate change. Science 322: 690–692. [DOI] [PubMed] [Google Scholar]
- 58.R-Core Team (2012) R: A Language and Environment for Statistical Computing. R Foundation for Statistical Computing, Vienna, Austria. [Google Scholar]
- 59.Schulte P, Healy T, Fangue NA. (2011) Thermal performance curves, phenotypic plasticity, and the time scales of temperature exposure. Integr Comp Biol 51: 691–702. [DOI] [PubMed] [Google Scholar]
- 60.Service RF. (2007) Environmental restoration: Delta blues, California style. Science 317: 442–445. [DOI] [PubMed] [Google Scholar]
- 61.Sommer T, Armor C, Baxter R, Breuer R, Brown L, Chotkowski M, Culberson S, Feyrer F, Gingras M, Herbold B, et al. (2007) The collapse of pelagic fishes in the upper San Francisco estuary. Fisheries 32: 270–277. [Google Scholar]
- 62.Stillman JH. (2003) Acclimation capacity underlies susceptibility to climate change. Science 301: 65. [DOI] [PubMed] [Google Scholar]
- 63.Swanson C, Young PS, Cech JJ., Jr (1998) Swimming performance of delta smelt: maximum performance, and behavioral and kinematic limitations on swimming at submaximal velocities. J Exp Biol 201: 333–345. [DOI] [PubMed] [Google Scholar]
- 64.Swanson C, Reid T, Young PS, Cech JJ., Jr (2000) Comparative environmental tolerances of threatened Delta Smelt (Hypomesus transpacificus) and introduced Wakasagi (Hypomesus nipponensis) in an altered California estuary. Oecologia 123: 384–390. [DOI] [PubMed] [Google Scholar]
- 65.USFWS (United States Fish and Wildlife Service) (2008) Formal Endangered Species Act Consultation on the Proposed Coordinated Operations of the Central Valley Project and State Water Project. US Fish and Wildlife Service, Sacramento, CA. [Google Scholar]
- 66.Wikelski M, Cooke SJ. (2006) Conservation physiology. Trends Ecol Evol 21: 38–46. [DOI] [PubMed] [Google Scholar]
- 67.Winder M, Jassby AD. (2011) Shifts in zooplankton community structure: implications for food web processes in the upper San Francisco Estuary. Estuar Coast 34: 675–690. [Google Scholar]
- 68.Zuur A, Ieno E, Walker N, Saveliev A, Smith G. (2009) Mixed Effects Models and Extensions in Ecology with R. Springer, New York, NY. [Google Scholar]
Associated Data
This section collects any data citations, data availability statements, or supplementary materials included in this article.