Abstract
Glucose control, glucose variability (GV), and risk for hypoglycemia are intimately related, and it is now evident that GV is important in both the physiology and pathophysiology of diabetes. However, its quantitative assessment is complex because blood glucose (BG) fluctuations are characterized by both amplitude and timing. Additional numerical complications arise from the asymmetry of the BG scale. In this Perspective, we focus on the acute manifestations of GV, particularly on hypoglycemia, and review measures assessing the amplitude of GV from routine self-monitored BG data, as well as its timing from continuous glucose monitoring (CGM) data. With availability of CGM, the latter is not only possible but also a requirement—we can now assess rapid glucose fluctuations in real time and relate their speed and magnitude to clinically relevant outcomes. Our primary message is that diabetes control is all about optimization and balance between two key markers—frequency of hypoglycemia and HbA1c reflecting average BG and primarily driven by the extent of hyperglycemia. GV is a primary barrier to this optimization, including to automated technologies such as the “artificial pancreas.” Thus, it is time to standardize GV measurement and thereby streamline the assessment of its two most important components—amplitude and timing.
Introduction
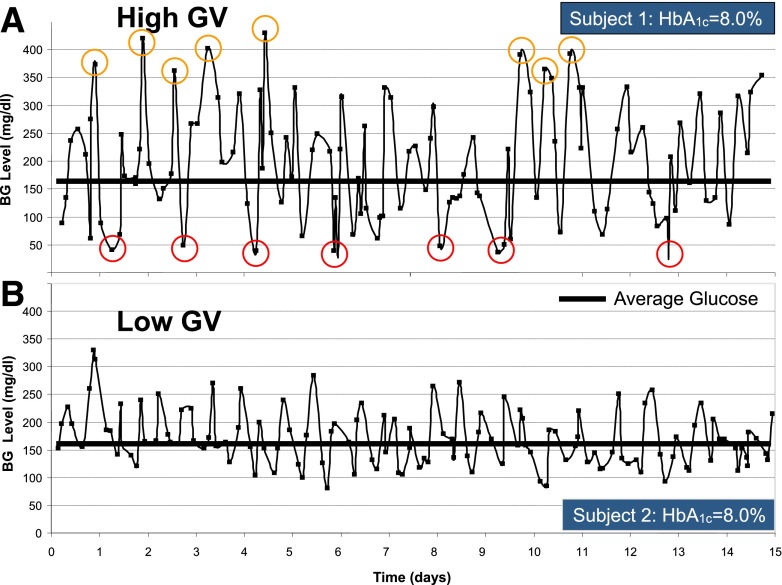
Although reducing hyperglycemia and targeting HbA1c values of 7% or less result in decreased risk of micro- and macrovascular complications (1–4), the risk for hypoglycemia increases with tightening glycemic control (5,6). Consequently, hypoglycemia has been implicated as the primary barrier to tight control (7,8). Thus, patients with diabetes face a lifelong optimization problem: reducing average glycemic levels and postprandial hyperglycemia while simultaneously avoiding hypoglycemia. A strategy for achieving such an optimization can only be successful if it reduces glucose variability (GV). This is because bringing average glycemia down is only possible if GV is constrained—otherwise blood glucose (BG) fluctuations would inevitably enter the range of hypoglycemia (9). This numerical assertion was recently reflected by a clinician’s Perspective stating: “The selection of a glycemic goal in a person with diabetes is a compromise between the documented upside of glycemic control—the partial prevention or delay of microvascular complications—and the documented downside of glycemic control—the recurrent morbidity and potential mortality of iatrogenic hypoglycemia” (8). Such a two-sided approach to the assessment of glycemic control is necessary because HbA1c fails to capture GV and the attendant risks associated with the extremes of hypo- and hyperglycemia. This effect is illustrated in Fig. 1, which presents 15-day glucose traces of two subjects who had identical HbA1c of 8.0%, but very different degrees of GV. As seen in Fig. 1, subject 1 and subject 2 had similar average glucose throughout the course of observation, but subject 1 (Fig. 1A) had visibly higher amplitude of glucose fluctuations, i.e., higher GV, which resulted in seven episodes of moderate hypoglycemia (≤50 mg/dL) and eight episodes of moderate hyperglycemia (≥350 mg/dL). In contrast, subject 2 had no such hypo- or hyperglycemic episodes. Thus, GV is a major determinant of a person’s risk for hypoglycemia or hyperglycemia, which in turn is reflected by the risk for complications associated with extreme glucose fluctuations (10).
Figure 1.
Fifteen-day glucose traces of two subjects who had identical HbA1c of 8.0% but different degrees of GV. High GV in subject 1 was reflected by numerous episodes of both hypo- and hyperglycemia (A), whereas low GV in subject 2 resulted in no such episodes (B).
Many studies, however, encountered a purely analytical problem—how to measure GV. A recent review argued that “there are better markers to assess the risk of diabetes than GV” (11). This argument depends heavily on the metrics used to quantify GV, and it can be similarly stated that there are better metrics to assess GV that reflect more accurately the risk of diabetes. The problem is that different ways of glucose monitoring result in different resolutions of observation of GV. For example, HbA1c captures only slow fluctuations in average glycemia taking place over several months, self-monitoring of BG (SMBG) a few times a day can capture daily variation in BG fluctuations, and contemporary continuous glucose monitoring (CGM) can take the GV monitoring resolution to the scale of minutes. With this analytical peculiarity in mind, we now focus on the causes, metrics, and clinical manifestations of GV, with a special emphasis on measuring the amplitude and the timing of glucose fluctuations and their relevance to underlying physiology and patient behavior.
Causes of GV
In health, glucose metabolism is tightly controlled by a hormonal network including the gut, liver, pancreas, and brain to ensure stable fasting BG levels and transient postprandial glucose fluctuations. In other words, BG fluctuations in type 1 diabetes result from the activity of a complex metabolic system perturbed by behavioral challenges. The frequency and extent of these challenges and the ability of the person’s system to absorb them determine the stability of glycemic control. The degree of system destabilization depends on each individual’s physiological parameters of glucose–insulin kinetics, including glucose appearance from food, insulin secretion, insulin sensitivity, and counterregulatory response. A major source of GV is the rapid onset of hyperglycemia due to the consumption of “high–glycemic index” foods. Moreover, sustained hyperglycemia engendered by foods with simple carbohydrates and high fat (classically pizza) may challenge therapy. Such foods often have hedonic qualities (e.g., comfort foods) leading to repeated challenges to glycemic stability. There is strong evidence that feeding behavior is abnormal in both uncontrolled diabetes and hypoglycemia and that feeding signals within the brain and hormones affecting feeding, such as leptin and ghrelin, are implicated in diabetes (12–14). Insulin secretion and action vary with the type and duration of diabetes. In type 1 diabetes, insulin secretion is virtually absent, which destroys the natural insulin–glucagon feedback loop and thereby diminishes the dampening effect of glucagon on hypoglycemia. In addition, insulin is typically administered subcutaneously, which adds delays to insulin action and thereby amplifies the amplitude of glucose fluctuations. In type 2 diabetes, increased insulin resistance and progressive loss of β-cell function result in higher and prolonged postprandial glucose excursions. Although observed in type 2 diabetes, impaired hypoglycemia counterregulation and increased GV in the hypoglycemic range are particularly relevant to type 1 diabetes: It has been shown that glucagon response is impaired (15), and epinephrine response is typically attenuated as well (16). Antecedent hypoglycemia shifts down BG thresholds for autonomic and cognitive responses, thereby further impairing both the hormonal defenses and the detection of hypoglycemia (17). Studies have established relationships between intensive therapy, hypoglycemia unawareness, and impaired counterregulation (16,18–20) and concluded that recurrent hypoglycemia spirals into a “vicious cycle” known as hyperglycemia-associated autonomic failure (HAAF) (21). Our studies showed that increased GV and the extent and frequency of low BG are major contributors to hypoglycemia and that such changes are detectable by frequent BG measurement (22–25). In addition, a study involving 34 subjects with type 1 diabetes found that higher insulin sensitivity and lower epinephrine response during hypoglycemia measured in a hospital setting were related to increased GV and risk for hypoglycemia measured in the field, irrespective of HbA1c and other patient characteristics (26).
Principal Components of Glucose Fluctuation: Amplitude and Timing
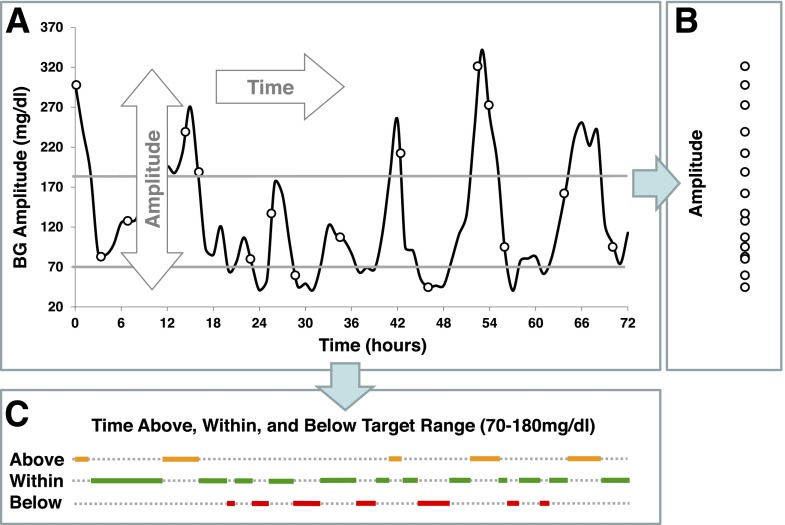
GV in diabetes is a process that develops in time. Most traditional metrics of GV focus on the amplitude of glucose fluctuations and ignore their timing component. Figure 2 presents the principal components of GV: amplitude and time (Fig. 2A). Amplitude is the projection of the BG data along the y-axis (Fig. 2B) and presents the extent of BG fluctuations without placing them in time. Timing is the projection of the data along the x-axis (Fig. 2C), which is representative of the duration of various events—in our example, the duration of time spent below, within, and above a predetermined BG target range of 70–180 mg/dL.
Figure 2.
Principal components of GV. Glucose fluctuations are a process in time that has two dimensions—amplitude and time (A). Projected along its amplitude axis, this process is measured by metrics such as SD or MAGE (B). Projected along its time axis, this process is assessed by temporal characteristics, such as time within target range and time spent in hypo- or hyperglycemia (C).
Traditionally, the metrics of amplitude of GV have relied on episodic BG readings, e.g., SMBG data, whereas the more contemporary metrics of the timing of GV rely on CGM. These distinctions are clarified below.
Measuring the Amplitude of GV
Metrics
The traditional statistical calculation of BG includes standard deviation (SD) (27), coefficient of variation (CV), or other metrics, such as the M-value introduced in 1965 (28), the mean amplitude of glucose excursions (MAGE) introduced in 1970 (29), the glycemic lability index (30), or the mean absolute glucose (MAG) change (31,32). As recently shown, the multitude of GV metrics introduced over the years can be reduced to fewer representative indices (33). Table 1 presents some of the most widely used GV metrics with their formulas.
Table 1.
Metrics of the amplitude of GV
| Metric | Formula | Meaning |
|---|---|---|
| SD |
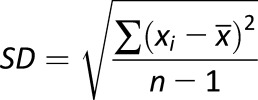 |
Variation of BG fluctuations around the mean |
| CV |
 |
Magnitude of variability relative to the mean |
| MAGE |
 , if λ > SD, where λ is each BG increase or decrease (absolute value) exceeding SD , if λ > SD, where λ is each BG increase or decrease (absolute value) exceeding SD |
The MAGE exceeding the SD of glucose variation |
| MAG change |
 |
Summed absolute differences between sequential readings divided by the time between the first and last BG measurement (MAG includes a timing component and is not a purely amplitude metric) |
| LBGI |
 , where , where 
 for several BG readings x1,…,xn for several BG readings x1,…,xn |
Measure of frequency and extent of hypoglycemia designed to amplify hypoglycemic excursions and ignore hyperglycemia |
| HBGI |
 , where , where 
 for several BG readings x1,…,xn for several BG readings x1,…,xn |
Measure of frequency and extent of hyperglycemia designed to scale hyperglycemic excursions and ignore hypoglycemia |
| ADRR |
 where LRj = max(r1(x1), …r1(xk)) and HRj = max(rh(x1),…rh(xk)) for several BG readings x1,…,xk taken within day #j, j = 1,2…,M where LRj = max(r1(x1), …r1(xk)) and HRj = max(rh(x1),…rh(xk)) for several BG readings x1,…,xk taken within day #j, j = 1,2…,M
|
Average of the maximal daily amplitudes of glucose excursions across several days, designed to be equally sensitive to hypo- and hyperglycemia |
In all formulas, x = BG level.
Risk Analysis
The last three of these metrics—the low BG index (LBGI), high BG index (HBGI), and average daily risk range (ADRR)—are based on a transformation of the BG measurement scale (f(x) in the formulas in Table 1), which aims to correct the substantial asymmetry of the BG measurement scale. Numerically, the hypoglycemic range (BG <70 mg/dL) is much narrower than that in the hyperglycemic range (BG >180 mg/dL) (34). As a result, whereas SD, CV, MAGE, and MAG are inherently biased toward hyperglycemia and have a relatively weak association with hypoglycemia, the LBGI and ADRR account well for the risk of hypoglycemic excursions. The analytical form of the scale transformation f(x) was based on accepted clinical assumptions, not on a particular data set, and was fixed 17 years ago, which made the approach extendable to any data set (34). On the basis of this transformation, we have developed our theory of risk analysis of BG data (35), defining a computational risk space that proved to be very suitable for quantifying the extent and frequency of glucose excursions. The utility of the risk analysis has been repeatedly confirmed (9,25,36–38). We first introduced the LBGI and HBGI, which were specifically designed to be sensitive only to the low and high end of the BG scale, respectively, accounting for hypo- and hyperglycemia without overlap (24). Then in 2006, we introduced the ADRR, a measure of GV that is equally sensitive to hypo- and hyperglycemic excursions and is predictive of extreme BG fluctuations (38). Most recently, corrections were introduced that allowed the LBGI and HBGI to be computed from CGM data with results directly comparable to SMBG (39).
Graphs
Variability Grid Analysis
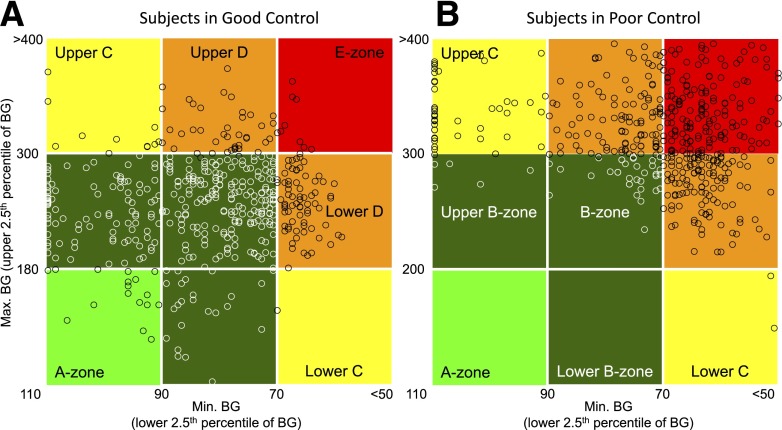
Besides glucose traces and histograms showing the spread of BG data, there are very few graphs specifically aimed to visualize the amplitude of GV. One such plot is the variability grid analysis (VGA), a method visually presenting GV at a population level (40,41). The VGA is a minimum/maximum plot of the BG readings for a subject taken over a certain observation period (e.g., 72 h). The minimum BG (the lower 2.5th percentile) is plotted on the x-axis, which is inverse coded from 110 mg/dL to <50 mg/dL. The maximum BG (the upper 2.5th percentile) is plotted on the y-axis. Thus the difference (y − x) represents the BG range observed for a subject. The plot is split into zones. A point in the A-zone (light green) indicates that the subject was never below 90 mg/dL and never above 180 mg/dL; i.e., the control was optimal. B-zones (dark green) indicate various degrees of suboptimal, but still acceptable, control; the C-zones (yellow) indicate overcorrection of hypo- or hyperglycemia, resulting in either maximum above 300 mg/dL or minimum below 70 mg/dL; the D-zones (orange) indicate even a higher degree of GV, whereas the E-zone (red) indicates BG readings below 70 mg/dL and above 300 mg/dL within the same observation period (Fig. 3).
Figure 3.
VGA. A split of a population of 335 below the median ADRR (A) and above the median ADRR (B) illustrated by the VGA. Each data point has BG coordinates (minimum, maximum) for a subject during the observation period. Subjects in A are in good control with most of the data points (70.4%) in the A- and B-zones; subjects in B are in poor control with most of the data points (89.6%) in the C-, D-, and E-zones.
The data points in Fig. 3 come from a previously discussed data set containing SMBG readings for 335 subjects with type 1 (n = 254) and type 2 (n = 81) diabetes (38). Figure 3A presents subjects in good control with most of the data points (70.4%) in the A- and B-zones. Figure 3B presents subjects at poor control with most of the data points (89.6%) in the C-, D-, and E-zones. The subject split was done along the median ADRR for the population. The subjects presented in panel A had a mean HbA1c of 7.6% and mean ADRR of 22.9; these subjects recorded 0.54 BG episodes ≤39 mg/dL and 3.27 BG episodes >400 mg/dL per person in the subsequent 3 months. The subjects presented in panel B had a mean HbA1c of 8.2% and mean ADRR of 48.0; these subjects recorded 3.32 BG episodes ≤39 mg/dL and 13.6 BG episodes >400 mg/dL per person in the subsequent 3 months. Thus, the difference in GV depicted by the VGA plots in Fig. 3 and quantified by the ADRR resulted in a several-fold difference in subsequent extreme hypo- and hyperglycemic episodes recorded over 3 months of follow-up observation (38).
Measuring the Timing of GV
Metrics
A recent review of GV (42) stated that “to avoid distortion of variability to that of glycemic exposure, its calculation should be devoid of a time component,” and a counterpoint presented in the same issue of Diabetes argued that the timing of BG fluctuations is important (32). Indeed, the same amplitude of glucose fluctuation can yield quite different clinical results depending on the speed of glucose transition. For example, among the many criticisms of MAGE, it was noted that MAGE was originally developed using 1-h data spacing but was then used with 7-point glucose profiles and with CGM data, both of which have not been validated (43). As noted in the previous section, one of the metrics used to measure GV amplitude—MAG—attempts to capture this effect and includes a timing component (ΔT in the denominator), which accounts for the duration of time over which BG fluctuations are observed. As a result, the same fluctuation amplitude over longer time would yield a lower MAG. Although apparently useful, considering time as an additional component of GV adds an additional layer of complexity, which so far has precluded widespread clinical use of time-dependent GV metrics. Attempts to focus on specific temporal characteristics of the data, such as the variability of periodic phenomena, brought about the mean of daily differences (MODD), which is designed to assess interday glycemic variation and therefore circadian periodicity (44). A generalization of this approach to a finer-resolution measurement of GV was presented by the continuous overlapping net glycemic action (CONGA) metric that calculates the difference between a current BG reading and a reading taken (n) hours earlier and then takes the SD of these differences (44). If the BG readings are more frequent than (n) hours, CONGA will take into its calculation overlapping time windows. The order of CONGA depends on clinical considerations: CONGA1 (for n = 1) corresponds to time period of 1 h, CONGA2 to 2 h, and so forth (44). A straightforward version of CONGA is the SD of the BG rate of change (45), which can be considered a CONGA of order 1 as long as the time interval between the BG readings coincides with the step of the CONGA procedure (Table 2).
Table 2.
Metrics of the timing of GV
| Metric | Formula | Meaning |
|---|---|---|
| SD of the BG rate of change |
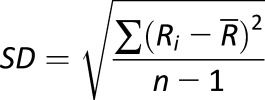 , where , where is the BG rate of change at time (i) and is the BG rate of change at time (i) and  is the average BG rate of change is the average BG rate of change |
Variation of the speed of BG fluctuation; particularly applicable to BG readings that are equally spaced in time, such as CGM data |
| MODD |
 , where k is the number of available data pairs 24-h apart , where k is the number of available data pairs 24-h apart |
Intraday GV computed from all 24-h time intervals where paired readings are available at the beginning and at the end of 24 h |
| CONGA |
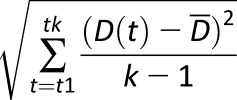 , where D(t) is the difference between BG at time t and BG taken n hours earlier, and , where D(t) is the difference between BG at time t and BG taken n hours earlier, and  is the average of these differences is the average of these differences |
MAGE exceeding the SD of GV |
In all formulas, x = BG level.
Graphs: Poincaré Plot of Glucose Dynamics
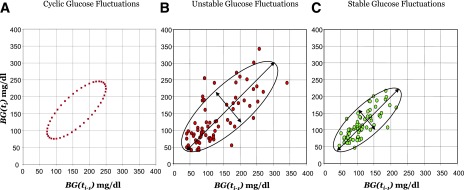
Whereas in Fig. 2C we illustrated the timing of glucose control with a traditional graph depicting a person’s time within target range, here we will focus on a plot used in nonlinear dynamics to visualize the dynamics of the investigated system. Such a representation becomes possible with the availability of CGM time series data, a sequence of frequent, equally spaced in time BG determinations that capture a high-resolution picture of the dynamics of BG fluctuations (41,45). The plot (known also as recurrence plot or lag plot) is named after the French mathematician Jules Henri Poincaré (1854–1912) who made fundamental contributions to the mathematics and physics of dynamical systems. The idea is straightforward: Given a series of BG readings, BG(t1), BG(t2),…, BG(tn), taken at equally spaced points in time, t1, t2, …, tn, each point of the plot has coordinates BG(ti-1) on the x-axis and BG(ti) on the y-axis (Fig. 4). Thus, the difference (y − x) of the coordinates of each data point represents the BG change occurring between times ti and ti-1. Intuitively, larger differences between the coordinates of sequential BG points will signify faster BG fluctuations, i.e., a more unstable glucoregulatory system. Alternatively, a smaller, more concentrated plot would indicate system stability. It is also worth noting that a Poincaré plot can indicate certain characteristics of system behavior. For example, an elliptic plot would indicate an oscillating system, such as the perfect oscillation of BG values between 70 and 250 mg/dL imagined in Fig. 4A. The boundaries of the plot are also indicative of the minimum and maximum BG levels achieved during the observation period, thereby visualizing the risk for hypo- and hyperglycemia to which the patient was exposed during the observation period. Thus, a more concentrated plot, such as the one in Fig. 4C, indicates a stable patient, whereas a more scattered Poincaré plot, such as the one in Fig. 4B, indicates system irregularity or poor glucose control. We should also note that nonstandard applications of Poincaré-type plots have been used as well; for example, the time lag associated with CGM can be visually estimated by plotting the codynamics of reference versus CGM readings at different time lags (46).
Figure 4.
Poincaré plot of BG fluctuations depicting system dynamics. A: Plot of perfectly cyclic glucose fluctuations, an unrealistic but illustrative scenario. B: Plot of unstable BG fluctuations of a person in poor control. C: Plot of stable BG fluctuations of a person in good control.
Case Studies on GV
Example 1: Prediction of the Risk for Extreme BG Fluctuations
In this example, we illustrate the metrics of GV with respect to their ability to predict future extreme glucose fluctuations, e.g., assess the risk for hypo- and hyperglycemia, separately and in combination. In a large study of 335 patients with type 1 and type 2 diabetes, we compared the LBGI, HBGI, and ADRR to established measures of GV, including SD, MAGE, and others (38). All GV metrics were computed from a month of SMBG data and were then fixed and tested as predictors of low (BG <40 mg/dL and BG <70 mg/dL) and high (BG >180 mg/dL and BG >400 mg/dL) events in the subsequent 3 months. Correlations between GV metrics and subsequent extreme glycemic events are given in Table 3. Table 3 illustrates several effects of GV measurement:
Table 3.
Correlations of variability measures with subsequent extreme glycemic events
| Metric of average glycemia and GV computed from SMBG during month 1 of study | Correlation of metric with the number of extreme BG episodes observed during months 2–4 of study* |
|
|---|---|---|
| BG <40 mg/dL | BG >400 mg/dL | |
| HBA1c (baseline laboratory measurement) |
−0.04 |
0.58 |
| Mean BG |
−0.15 |
0.58 |
| SD of BG |
0.15 |
0.58 |
| M-value |
0.16 |
0.68 |
| MAGE |
0.17 |
0.56 |
| LBGI |
0.59 |
−0.06 |
| HBGI |
−0.05 |
0.65 |
| ADRR | 0.44 | 0.45 |
*At this sample size, correlations above 0.4 were considered significant at P = 0.001, which was an appropriate significance level accounting for the multicollinearity of the considered measures (39).
Metrics that are based on nonsymmetrized BG readings are predictive primarily of hyperglycemia and account poorly for future hypoglycemic episodes (SD of BG, M-value, and MAGE).
The predictive power of these metrics for future extreme hypoglycemia is similar to that of average BG and HbA1c, a finding consistent with the Diabetes Control and Complications Trial (DCCT), which concluded that only about 7% of severe hypoglycemic episodes can be accounted for by HbA1c (6).
The ADRR, which is based on symmetrization of the BG scale, balances the prediction of hypo- and hyperglycemia.
Separate independent assessments of the risks for low and high BG extremes are provided by the LBGI and HBGI, which is consistent with the observation that “risks associated with hypoglycemia are different from those associated with hyperglycemia in type, timing, and predictability, and they have no interaction” (42).
Example 2: Effect of Islet Transplantation on GV
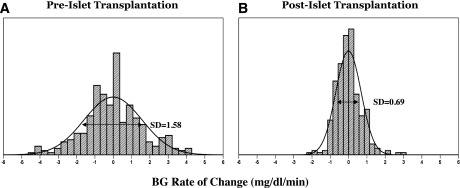
To illustrate the effect of treatment observed via CGM, we used previously published 72-h glucose traces observed before and 4 weeks after islet transplantation (45). Analysis of the BG rate of change (measured in mg/dL/min) derived from CGM data was suggested as a way to evaluate the dynamics of BG fluctuations on the time scale of minutes (41,45). A larger variation of the BG rate of change indicates rapid and more pronounced BG fluctuations and therefore a less stable system. To illustrate this point, Fig. 5A and B presents histograms of the distribution of the BG rate of change over 15 min. It is apparent that the pretransplantation distribution is more widespread than the distribution posttransplantation. Numerically, this effect is reflected by the SD of the BG rate of change, which was reduced from 1.58 to 0.69 mg/dL/min, and by 19.3% of BG rates outside of the [-2, 2] mg/dL/min range in Fig. 5A versus only 0.6% BG rates outside that range in Fig. 5B (45).
Figure 5.
Histograms of the BG rate of change before (A) and after (B) islet transplantation, illustrating increased system stability after the procedure.
The same effect was also captured by the Poincaré plots in Fig. 4B and C. These plots present data for the same patient before and after islet transplantation, confirming that the surgical treatment has stabilized the metabolic system of this person (45).
Example 3: Effects of Medication Treatment
Pramlintide
SMBG records were analyzed from a randomized, double-blind, placebo-controlled study of the effects of pramlintide on intensively treated patients with type 1 diabetes. Two groups—pramlintide (n = 119) or placebo (n = 129)—were matched by age, sex, and baseline HbA1c. Compared with placebo, pramlintide significantly attenuated the preprandial to postprandial BG rate of change (F = 83.8, P < 0.0001). Consequently, in pramlintide-treated patients, both the average postmeal BG (151.2 vs. 174.6 mg/dL) and the postprandial HBGI (4.8 vs. 7.1) were significantly lower than in the patients given placebo (P < 0.0001). The reduction in postprandial hyperglycemia in pramlintide-treated patients occurred without increased risk for preprandial hypoglycemia as quantified by the LBGI (47).
Exenatide
In this study, variability analyses were applied to SMBG data from patients with type 2 diabetes suboptimally controlled with oral therapy plus exenatide or insulin glargine as a next therapeutic step. Exenatide-treated (n = 282) and insulin glargine–treated (n = 267) patients were matched by age, HbA1c, BMI, and duration of diabetes. GV was reduced on exenatide compared with glargine as indicated by the ADRR (mean ± SEM, 16.33 ± 0.45 vs. 18.54 ± 0.49, P = 0.001), LBGI, and HBGI. The study concluded that although average glycemic control was similar for both treatment groups, exenatide minimized GV and the risk for glycemic extremes to a greater degree than glargine (48).
Lixisenatide
A recently presented analysis evaluated the impact on GV of lixisenatide (LIXI) versus placebo as an add-on to basal insulin in type 2 diabetes. Data from 1,198 patients (665 LIXI, 533 placebo) indicated significant GV decrease on LIXI: SD decrease on LIXI was −8.28 mg/dL versus −3.89 mg/dL on placebo, P = 0.003; MAG decreased −6.80 versus −1.48 mg/dL, P < 0.001; MAGE decreased −16.02 versus −7.02 mg/dL, P = 0.003; and the HBGI decreased −3.65 versus −0.88, P < 0.001. The LBGI remained unchanged, indicating no increase in the risk for hypoglycemia as a result from treatment. The study concluded that when added to insulin LIXI significantly reduced GV and postprandial glucose excursions without increased risk of hypoglycemia (49).
Conclusions
Diabetes control is all about optimization and a balance, or “trade-off,” between two key markers: frequency of hypoglycemia and HbA1c, which reflects average BG and is primarily driven by the duration and the extent of hyperglycemia (8). As shown by several studies, GV is a primary barrier to this optimization. However, although GV has richer information content than just average glucose (HbA1c), its quantitative assessment is not straightforward because glucose fluctuations carry two components: amplitude and timing.
The standard assessment of GV is measuring amplitude. However, when measuring amplitude we should be mindful that deviations toward hypoglycemia are not equal to deviations toward hyperglycemia—a 20 mg/dL decline in BG levels from 70 to 50 mg/dL is clinically more important than a 20 mg/dL raise of BG from 160 to 180 mg/dL. We explained how to fix that with a well-established rescaling of the BG axis introduced more than 15 years ago (34). For convenience and because the risks for hypo- and hyperglycemia are clinically independent (42), we would also suggest using two independent indices that have been specifically designed to account for the variation in the low BG range (LBGI [22]) and high BG range (HBGI [24]) (see example 2).
In addition, we should be mindful of the timing of BG fluctuations. There are a number of measures assessing GV amplitude from routine SMBG, but the timing of readings is frequently ignored even if the information is available (42). Yet, contrary to widespread belief, BG fluctuations are a process in time and the speed of transition from one BG state to another is of clinical importance. With the availability of CGM, the assessment of GV timing became not only possible but also required (32). Responding to this necessity, we should keep in mind that the assessment of temporal characteristics of GV benefits from mathematical computations that go beyond basic arithmetic. Thus, some assistance from the theory and practice of time series and dynamical systems analysis would be helpful. Fortunately, these fields are highly developed, theoretically and computationally, and have been used for decades in other areas of science (e.g., engineering, physics, meteorology, and environmental science, to mention a few). The computational methods are standardized and available in a number of software products and should be used for the assessment of GV.
We should emphasize that diabetes research and clinical practice are no strangers to, and have benefited from, advanced mathematical modeling and computing methods (50). For instance, the minimal model of glucose–insulin dynamics has been used for over 30 years to assess insulin sensitivity and β-cell function (51). In this Perspective, we argue that techniques known in mathematics for decades can be very beneficial to the understanding of glucose metabolism in diabetes and in health. There is no doubt that the timing of glucose fluctuations is clinically important, but there is a price to pay for its accurate assessment—a bit higher level of mathematical complexity. This, however, should not be a deterrent. Appropriate techniques and expertise are increasingly available in the diabetes field, and these resources should be used for the common good. Examples 3 and 4 illustrate the importance of timing components for the assessment of diabetes treatments.
Last but not least, we should note that a modern field of increased research and industrial efforts—the artificial pancreas or the closed-loop control of diabetes—would not be possible without real-time assessment of GV and real-time reaction to glucose fluctuations. Thus, we should put to rest the dispute of whether GV deserves attention and should focus on standardizing, via scientific consensus, the methods for the assessment of its most important components—amplitude (Table 2) and timing (Table 3).
Article Information
Funding. This study was supported by National Institutes of Health/National Institute of Diabetes and Digestive and Kidney Diseases project R01 DK051562 “Biobehavioral triggers, mechanisms, and control of glucose variability in T1DM” and by the Seventh Framework Programme of the European Union project 600914 “Models and simulation techniques for discovering diabetes influence factors” (MOSAIC).
Duality of Interest. B.K. has received research support from Amylin Pharmaceuticals, Animas Corp., Becton Dickinson, Dexcom, Insulet, Roche Diagnostics, Sanofi, and Tandem Diabetes Care; holds patents related to metrics of GV in diabetes; and is a shareholder in InSpark Technologies and TypeZero Technologies. C.C. has received research support from Amylin Pharmaceuticals, Dexcom, Insulet, Roche Diagnostics, and Sanofi. No other potential conflicts of interest relevant to this article were reported.
References
- 1.Lachin JM, Genuth S, Nathan DM, Zinman B, Rutledge BN; DCCT/EDIC Research Group . Effect of glycemic exposure on the risk of microvascular complications in the Diabetes Control and Complications Trial--revisited. Diabetes 2008;57:995–1001 [DOI] [PubMed] [Google Scholar]
- 2.Santiago JV. Lessons from the Diabetes Control and Complications Trial. Diabetes 1993;42:1549–1554 [DOI] [PubMed] [Google Scholar]
- 3.The Diabetes Control and Complications Trial Research Group The effect of intensive treatment of diabetes on the development and progression of long-term complications in insulin-dependent diabetes mellitus. N Engl J Med 1993;329:977–986 [DOI] [PubMed] [Google Scholar]
- 4.UK Prospective Diabetes Study (UKPDS) Group Intensive blood-glucose control with sulphonylureas or insulin compared with conventional treatment and risk of complications in patients with type 2 diabetes (UKPDS 33). Lancet 1998;352:837–853 [PubMed] [Google Scholar]
- 5.American Diabetes Association Workgroup on Hypoglycemia Defining and reporting hypoglycemia in diabetes. Diabetes Care 2005;28:1245–1249 [DOI] [PubMed] [Google Scholar]
- 6.The Diabetes Control and Complications Trial Research Group Hypoglycemia in the Diabetes Control and Complications Trial. Diabetes 1997;46:271–286 [PubMed] [Google Scholar]
- 7.Cryer PE. Hypoglycaemia: the limiting factor in the glycaemic management of type I and type II diabetes. Diabetologia 2002;45:937–948 [DOI] [PubMed] [Google Scholar]
- 8.Cryer PE. Glycemic goals in diabetes: trade-off between glycemic control and iatrogenic hypoglycemia. Diabetes 2014;63:2188–2195 [DOI] [PubMed] [Google Scholar]
- 9.McCall AL, Kovatchev BP. The median is not the only message: a clinician’s perspective on mathematical analysis of glycemic variability and modeling in diabetes mellitus. J Diabetes Sci Technol 2009;3:3–11 [DOI] [PMC free article] [PubMed] [Google Scholar]
- 10.Hirsch IB. Glycemic variability and diabetes complications: does it matter? Of course it does! Diabetes Care 2015;38:1610–1614 [DOI] [PubMed] [Google Scholar]
- 11.Bergenstal RM. Glycemic variability and diabetes complications: does it matter? Simply put, there are better glycemic markers! Diabetes Care 2015;38:1615–1621 [DOI] [PubMed] [Google Scholar]
- 12.Fernstrom JD. Branched-chain amino acids and brain function. J Nutr 2005;135(Suppl.):1539S–1546S [DOI] [PubMed] [Google Scholar]
- 13.Gelling RW, Overduin J, Morrison CD, et al. Effect of uncontrolled diabetes on plasma ghrelin concentrations and ghrelin-induced feeding. Endocrinology 2004;145:4575–4582 [DOI] [PubMed] [Google Scholar]
- 14.German JP, Wisse BE, Thaler JP, et al. Leptin deficiency causes insulin resistance induced by uncontrolled diabetes. Diabetes 2010;59:1626–1634 [DOI] [PMC free article] [PubMed] [Google Scholar]
- 15.Gerich JE, Langlois M, Noacco C, Karam JH, Forsham PH. Lack of glucagon response to hypoglycemia in diabetes: evidence for an intrinsic pancreatic alpha cell defect. Science 1973;182:171–173 [DOI] [PubMed] [Google Scholar]
- 16.Amiel SA, Sherwin RS, Simonson DC, Tamborlane WV. Effect of intensive insulin therapy on glycemic thresholds for counterregulatory hormone release. Diabetes 1988;37:901–907 [DOI] [PubMed] [Google Scholar]
- 17.Dagogo-Jack SE, Craft S, Cryer PE. Hypoglycemia-associated autonomic failure in insulin-dependent diabetes mellitus. Recent antecedent hypoglycemia reduces autonomic responses to, symptoms of, and defense against subsequent hypoglycemia. J Clin Invest 1993;91:819–828 [DOI] [PMC free article] [PubMed] [Google Scholar]
- 18.Amiel SA, Tamborlane WV, Simonson DC, Sherwin RS. Defective glucose counterregulation after strict glycemic control of insulin-dependent diabetes mellitus. N Engl J Med 1987;316:1376–1383 [DOI] [PubMed] [Google Scholar]
- 19.Cryer PE, Gerich JE. Glucose counterregulation, hypoglycemia, and intensive insulin therapy in diabetes mellitus. N Engl J Med 1985;313:232–241 [DOI] [PubMed] [Google Scholar]
- 20.White NH, Skor DA, Cryer PE, Levandoski LA, Bier DM, Santiago JV. Identification of type I diabetic patients at increased risk for hypoglycemia during intensive therapy. N Engl J Med 1983;308:485–491 [DOI] [PubMed] [Google Scholar]
- 21.Cryer PE. Hypoglycemia: Pathophysiology, Diagnosis, and Treatment. Oxford University Press, 1997 [Google Scholar]
- 22.Kovatchev BP, Cox DJ, Gonder-Frederick LA, Young-Hyman D, Schlundt D, Clarke W. Assessment of risk for severe hypoglycemia among adults with IDDM: validation of the low blood glucose index. Diabetes Care 1998;21:1870–1875 [DOI] [PubMed] [Google Scholar]
- 23.Kovatchev BP, Cox DJ, Farhy LS, Straume M, Gonder-Frederick L, Clarke WL. Episodes of severe hypoglycemia in type 1 diabetes are preceded and followed within 48 hours by measurable disturbances in blood glucose. J Clin Endocrinol Metab 2000;85:4287–4292 [DOI] [PubMed] [Google Scholar]
- 24.Kovatchev BP, Cox DJ, Kumar A, Gonder-Frederick L, Clarke WL. Algorithmic evaluation of metabolic control and risk of severe hypoglycemia in type 1 and type 2 diabetes using self-monitoring blood glucose data. Diabetes Technol Ther 2003;5:817–828 [DOI] [PubMed] [Google Scholar]
- 25.Cox DJ, Gonder-Frederick L, Ritterband L, Clarke W, Kovatchev BP. Prediction of severe hypoglycemia. Diabetes Care 2007;30:1370–1373 [DOI] [PubMed] [Google Scholar]
- 26.Pitsillides AN, Anderson SM, Kovatchev B. Hypoglycemia risk and glucose variability indices derived from routine self-monitoring of blood glucose are related to laboratory measures of insulin sensitivity and epinephrine counterregulation. Diabetes Technol Ther 2011;13:11–17 [DOI] [PMC free article] [PubMed] [Google Scholar]
- 27.Rodbard D. New and improved methods to characterize glycemic variability using continuous glucose monitoring. Diabetes Technol Ther 2009;11:551–565 [DOI] [PubMed] [Google Scholar]
- 28.Schlichtkrull J, Munck O, Jersild M. The M-value, an index of blood-sugar control in diabetics. Acta Med Scand 1965;177:95–102 [DOI] [PubMed] [Google Scholar]
- 29.Service FJ, Molnar GD, Rosevear JW, Ackerman E, Gatewood LC, Taylor WF. Mean amplitude of glycemic excursions, a measure of diabetic instability. Diabetes 1970;19:644–655 [DOI] [PubMed] [Google Scholar]
- 30.Ryan EA, Shandro T, Green K, et al. Assessment of the severity of hypoglycemia and glycemic lability in type 1 diabetic subjects undergoing islet transplantation. Diabetes 2004;53:955–962 [DOI] [PubMed] [Google Scholar]
- 31.Hermanides J, Vriesendorp TM, Bosman RJ, Zandstra DF, Hoekstra JB, Devries JH. Glucose variability is associated with intensive care unit mortality. Crit Care Med 2010;38:838–842 [DOI] [PubMed] [Google Scholar]
- 32.DeVries JH. Glucose variability: where it is important and how to measure it. Diabetes 2013;62:1405–1408 [DOI] [PMC free article] [PubMed] [Google Scholar]
- 33.Fabris C, Facchinetti A, Sparacino G, et al. Glucose variability indices in type 1 diabetes: parsimonious set of indices revealed by sparse principal component analysis. Diabetes Technol Ther 2014;16:644–652 [DOI] [PubMed] [Google Scholar]
- 34.Kovatchev BP, Cox DJ, Gonder-Frederick LA, Clarke W. Symmetrization of the blood glucose measurement scale and its applications. Diabetes Care 1997;20:1655–1658 [DOI] [PubMed] [Google Scholar]
- 35.Kovatchev BP, Straume M, Cox DJ, Farhy LS. Risk analysis of blood glucose data: a quantitative approach to optimizing the control of insulin dependent diabetes. J Theor Med 2000;3:1–10 [Google Scholar]
- 36.McCall AL, Cox DJ, Crean J, Gloster M, Kovatchev BP. A novel analytical method for assessing glucose variability: using CGMS in type 1 diabetes mellitus. Diabetes Technol Ther 2006;8:644–653 [DOI] [PubMed] [Google Scholar]
- 37.Kovatchev BP, Cox DJ, Straume M, Farhy LS. Association of self-monitoring blood glucose profiles with glycosylated hemoglobin in patients with insulin-dependent diabetes. Methods Enzymol 2000;321:410–417 [DOI] [PubMed] [Google Scholar]
- 38.Fabris C, Patek SD, Breton MD. Are risk indices derived from CGM interchangeable with SMBG-based indices? J Diabetes Sci Technol 2015;10:50–59 [DOI] [PMC free article] [PubMed] [Google Scholar]
- 39.Kovatchev BP, Otto E, Cox D, Gonder-Frederick L, Clarke W. Evaluation of a new measure of blood glucose variability in diabetes. Diabetes Care 2006;29:2433–2438 [DOI] [PubMed] [Google Scholar]
- 40.Magni L, Raimondo DM, Man CD, et al. Evaluating the efficacy of closed-loop glucose regulation via control-variability grid analysis. J Diabetes Sci Technol 2008;2:630–635 [DOI] [PMC free article] [PubMed] [Google Scholar]
- 41.Clarke W, Kovatchev B. Statistical tools to analyze continuous glucose monitor data. Diabetes Technol Ther 2009;11(Suppl. 1):S45–S54 [DOI] [PMC free article] [PubMed] [Google Scholar]
- 42.Service FJ. Glucose variability. Diabetes 2013;62:1398–1404 [DOI] [PMC free article] [PubMed] [Google Scholar]
- 43.Rodbard D. The challenges of measuring glycemic variability. J Diabetes Sci Technol 2012;6:712–715 [DOI] [PMC free article] [PubMed] [Google Scholar]
- 44.McDonnell CM, Donath SM, Vidmar SI, Werther GA, Cameron FJ. A novel approach to continuous glucose analysis utilizing glycemic variation. Diabetes Technol Ther 2005;7:253–263 [DOI] [PubMed] [Google Scholar]
- 45.Kovatchev BP, Clarke WL, Breton M, Brayman K, McCall A. Quantifying temporal glucose variability in diabetes via continuous glucose monitoring: mathematical methods and clinical application. Diabetes Technol Ther 2005;7:849–862 [DOI] [PubMed] [Google Scholar]
- 46.Kovatchev BP, Shields D, Breton M. Graphical and numerical evaluation of continuous glucose sensing time lag. Diabetes Technol Ther 2009;11:139–143 [DOI] [PMC free article] [PubMed] [Google Scholar]
- 47.Kovatchev BP, Crean J, McCall A. Pramlintide reduces the risks associated with glucose variability in type 1 diabetes. Diabetes Technol Ther 2008;10:391–396 [DOI] [PMC free article] [PubMed] [Google Scholar]
- 48.McCall AL, Cox DJ, Brodows R, Crean J, Johns D, Kovatchev B. Reduced daily risk of glycemic variability: comparison of exenatide with insulin glargine. Diabetes Technol Ther 2009;11:339–344 [DOI] [PMC free article] [PubMed] [Google Scholar]
- 49. Umpierrez GE, DiGenio A, Goldenberg R, et al. Lixisenatide added to basal insulin reduces glycemic variability in T2DM patients (Abstract). Diabetes 2014;63(Suppl. 1):A260. [Google Scholar]
- 50.Cobelli C, Man CD, Pedersen MG, Bertoldo A, Toffolo G. Advancing our understanding of the glucose system via modeling: a perspective. IEEE Trans Biomed Eng 2014;61:1577–1592 [DOI] [PubMed] [Google Scholar]
- 51.Cobelli C, Dalla Man C, Toffolo G, Basu R, Vella A, Rizza R. The oral minimal model method. Diabetes 2014;63:1203–1213 [DOI] [PMC free article] [PubMed] [Google Scholar]


