Abstract
Apatitic mineral of dentin forms within the collagenous matrix (intertubular dentin, ITD) secreted from the odontoblastic processes (OP). Highly calcified mineral (peritubular dentin, PTD) is deposited at the interface between the ITD and each process membrane, creating a tubular system penetrating the dentin that extends from the dentino-enamel junction to the predentin-dentin junction. We focus on determining the composition of the PTD both with regard to its organic matrix and the inorganic phase. A laser capture technique has been adapted for isolation of the mineralized PTD free of the ITD, and for the analysis of the PTD by SEM, TEM, and energy dispersive spectrometry (EDS), and comparison with similar analyses of intact dentin slices containing ITD bounded-PTD annuli. Elemental line scans clearly marked the boundaries between ITD, PTD, and OP components, and revealed differences in composition, and topographical surface roughness. The organic matrix of the PTD was shown to be sulfur rich, and further antibody labeling showed the sulfated organic component to be chondroitin sulfate B. In this organic matrix the Ca/P ratio was distinctly higher than in the ITD and intact PTD, indicating that polysaccharide bound S supplies the anionic counterion facilitating the formation of the apatitic PTD mineral.
Keywords: PTD, ITD, bovine, molar, laser capture, chondroitin sulfate
INTRODUCTION
Tooth dentin begins to form at the dentinoenamel junction (DEJ), the junction of the polarized enamel-forming ameloblasts (AE) and the polarized dentin-forming odontoblasts (OD). As the dentin layer thickens, the OD cell bodies are driven inward in the direction of the dental pulp but each OD body remains connected to the DEJ via a major elongating odontoblastic process (OP).Thus the dentin extracellular mineralized collagenous matrix is not a solid body, but is penetrated (or fenestrated) by the OP which have a composition different from the mineralized matrix, and in dentin sections the cavities they once occupied have the appearance of tubules. Initially an OP is in direct contact with the surrounding wall of mineralizing secreted collagen fibrils, but as the cell body retracts in the direction of the pulp, its elongating OP also partially retracts and narrows, so that the membrane bound cell process leaves a space between the secreted mineralized dentin wall and the OP membrane. This space becomes filled with a hypermineralized collar (relative to the mineralized dentin) known as the peritubular dentin (PTD) (Orban’s Oral Histology and Embryology. S.N. Bhaskar, ed., 10th edition, 1986, C.V. Mosby Co., Fig 4-4 p 105, or other standard text)(1). The mineralized fibrillar collagen surrounding the tubules is called the intertubular dentin (ITD). Discussions of “dentin” usually consider the ITD to be the main component of the dentin but this is not entirely true because the packing of the dentinal tubules and spacing between tubules varies with the position of the tubules relative to the distance between the DEJ and pulp and their position relative to the cervical line (crown-root boundary) as well as tooth type and shape (2–4). We have recently shown (5), using careful ImageJ (6) analysis of undemineralized bovine molar slices cut at mid-length between DEJ and pulp, and perpendicular to the tubule long axis direction, that cross-section areas occupied by the ITD and PTD were nearly equal (in some sections, PTD >50 area%). Earlier, using time-of-flight secondary ion mass spectroscopy (TOF-SIMS), we had shown that the radial thicknesses of a PTD annulus was not uniform in all directions (5, 7) and that, while hypermineralized, the PTD organic matrix was essentially free of collagen (8, 9) and showed evidence of a phospholipid-proteolipid complex. Bertassoni et al. (10) confirmed the absence of collagen as a major component of the PTD, and showed that the PTD matrix contained a significant content of proteoglycans. Lu et al (11) have identified chondroitin sulfate within the tubule lumens and at the ITD-collagen interface.
It is clear that “dentin” is a heterogeneous material, and at least three components need to be considered: 1) The mineralized collagenous network of the ITD; 2) the hypermineralized PTD annulus; and 3) the cellular odontoblast process, including both membrane and cell contents. The structure and composition of the ITD is reasonably well known, but the composition, role, and function of the heterogeneous, hypermineralized, non-collagenous PTD remains enigmatic. In the present study we have used a variety of high resolution imaging and analysis procedures to determine the compositions of the dentin components in the context of their positions within the ITD and PTD, while also knowing exactly their position within the dentin. Our recently developed mineralized tissue Laser Capture technique (5) has been a major tool in this study and has allowed us to isolate both individual tubules and small groups of tubules and examine their PTD contents and structure to correlate along with other imaging and spectroscopic modalities.
METHODS
Sample collection and preparation
Lower jaws were collected from 18 month old Black Angus cows immediately following their death (Aurora Packing Co., West Aurora, IL). The jaws were rinsed in cold water and kept on ice until transported to the laboratory. As soon as feasible, the unerupted molar teeth were freed from their bony crypts using bone saws. The large third molars were selected for study. As seen in Fig. 1-a-i third molars have a complex folding of the enamel, and two to three roots.
Figure 1.
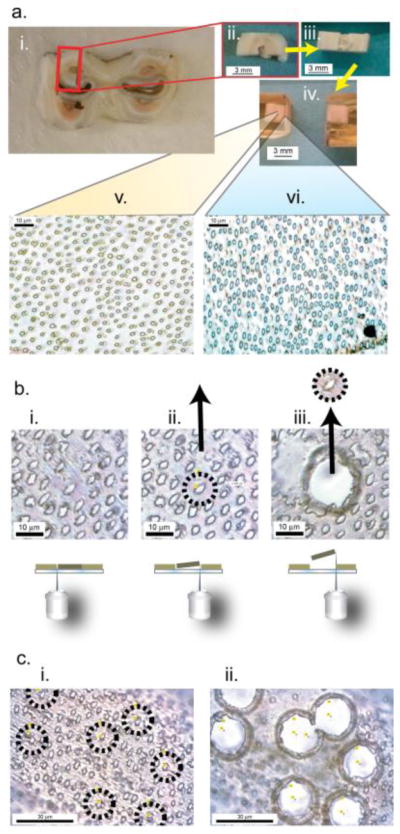
Schematic of the targeting and isolation of dentin components for further analysis. a. Millimeter scale preparation: a-i. A 2.5 mm thick slice from an intact bovine third molar tooth, collected 3 mm above the cervical line. a-ii. A block cut as outlined from a-i. Enamel, dentin and pulp cavity are all easily seen. a-iii. a-ii rotated 90°.The tubules running from the DEJ to the pulp cavity are essentially parallel to the a-iii surface horizontal plane. a-iv. Block a-iii encased in Epon. This block was then sectioned by microtome from the predentin-dentin (PD-D) junction to the DEJ. a-v. This is a 1 μm section from midway between the DEJ and PD-D while section a-vi is from a region near PD-D junction. A distinct mineralized PTD collar was observed around the tubules in a-v, while PTD collars were not observed around the tubules present in a-vi. b., c. Micrometer preparation: b-i. The microtomed 1 μm slices were examined to select areas where a tubule could be seen as essentially circular and free of contact with nearby tubules, and perpendicular to the plane of the section to assure that the tubule penetrated the full thickness of the slice, b-ii. These slices were transferred to a Zeiss PALM PEN-MembraneSlide and the selected tubule was then cut with the appropriate circular laser path. The laser was then pulsed and the cut section catapulted to a second slide for analysis. b-iii & c-i, ii, Using laser microdissection, multiple tubules can be targeted and removed.
Nevertheless clearly defined regions where a full clear tubule path from DEJ to PD-D were detected, Fig. 1a-i,ii.. The dental sacs surrounding the unerupted roots were rinsed away, then, as shown in Fig. 1, the teeth were cut into approximately 2.5 mm slices oriented perpendicular to the crown-root tooth axis. The cervical line of each tooth was easily identified and the sectioning was begun at 3 mm above that position. All cuts were made with a 1000 Precision Isomet Saw (Buehler, An ITW Company) using a 0.5 mm thick diamond blade lubricated with water. The slices were washed with deionized H2O and frozen for storage until use. The position of each tooth slice relative to the cervical line was recorded. The presence of PTD in each slice was verified microscopically, then discrete ~6×3×2.5 mm blocks were excised from the tooth cross section slices, again using the 1000 Precision Isomet Saw with a 0.5 mm thick diamond blade, lubricated with water. Blocks were rinsed with DI H2O, frozen and lyophilized for 6 hours to completely dry the samples. The dry samples were then encased in Epon with no additional dehydration or infiltration. The Epon mixture was made with 13 mL Embed 812, 8 mL DDSA (Dodecenyl succinic anhydride), 7 mL NMA (NADIC methyl anhydride) and 0.45 mL DMAE (dimethylaminoethanol) (all from Electron Microscopy Sciences, Hatfield PA). The tooth sections were laid in the bottom of a shallow silicone mold and covered with the Epon mixture. The Epon encased tooth sections were then set in the oven at 60 °C overnight. Once cured, the Epon blocks were then trimmed, turned over in the mold, re-encased in a fresh Epon mixture set in the oven at 60 °C overnight. The result of this repeated encasement produced tooth sections embedded in the center of the Epon block. After general microscopic examination the orientation of the tubules between predentin-dentin junction and the DEJ was determined, the block was shaped perpendicular to the long axis of the tubules using a diamond knife (DiATOME diamond knives, Hatfield PA) yielding cross sections that contain 1–2 μm diameter tubules, with the intent of having the majority of the axes of tubules perpendicular to the section plane, such that the cross section of each tubule appeared as circular as possible. After the orientation of the tubules was determined the location of each section relative to the predentin-dentin junction was recorded. A Reichert-Jung Ultracut E microtome with a diamond knife was used to cut 1 μm slices perpendicular to the long axis of the tubules, yielding exposed cross sections of the 1–2 μm diameter tubules.
These precisely located and cut tooth cross sections, in which the cut PTD and ITD surfaces had not been exposed to any solvent extraction other than brief washing with deionized H2O were used for further analysis as described below. For laser microdissection, the microtomed sections were transferred to a Zeiss PALM PEN-MembraneSlide 0.17 mm (Carl Zeiss MicroImaging GmbH). For electron microscopy the sections were directly captured on to TEM grids(5). For immunohistochemistry, microtomed sections were transferred to a poly-Lysine slide. Isolated sections of tubules were examined with both light microscopy (Olympus BX53 Microscope), and electron microscopy.
Laser Microdissection
Laser Catapulting Microdissection System (Zeiss PALM, Carl Zeiss MicroImaging GmbH) was utilized to cut groups of tubules from the surrounding ITD. Cutting was performed at 100X on the microscope which requires oil on the lens, however since the lens is below the sample no cover slip was needed. The slices were scanned for flat areas and the tubules in these areas brought into optical focus. Prior to cutting the sample, practice areas were outlined with the Cut tool to determine the correct laser Focus and Energy needed to cut through the section. Individual tubules are then picked to cut out using the RoboLPC tool. This tool allows for a laser cut followed by a pulse that catapults the sample in an arc onto the neighboring TEM grid (5) or another slide. This process is repeated until the desired numbers of samples are collected.
Electron Microscopy
All Electron microscopy was performed using a Scanning Transmission Electron Microscope (Hitatchi HD2300A) (STEM) with dual Energy Dispersive Spectrometer (EDS) detectors at 120 KV.
Immunohistochemistry
Four slides were prepared with eight dentin slices placed on each slide to form two arrays of four (control and experiment). The sections were rehydrated twice by placing a drop of water directly on each section then the slide was placed on a hot plate to drive off the excess water. Slides were placed in a Coplin jar containing 1:1 Ethanol: Sodium Ethoxide (25mL:25mL) for 5 minutes. Slides were rinsed in PBS for 10 minutes. Two slides were kept in PBS (control) for 3 hours while the other two were soaked in 0.5 M EDTA in 20mM Tris buffer pH 8 for 4 hours to partially demineralize these sections. The slides were removed from solution, and circles were drawn around each set of sections with Liquid Blocker Pen (EM Sciences, Hatfield, PA). Both sets of slides were blocked with 200 μL of 3% BSA (Sigma) in PBS solution (5 mL PBS, 1.5 g albumin (BSA)) containing normal serum of the secondary antibody (10 μL 1:500 dilution of normal goat (anti-mouse, anti-rabbit)) into each circle, and incubated for 30 min at room temperature. The blocking solution was removed from both sets of slides. One set of 4 section arrays from each slide was selected as the control array and 200 μL of fresh blocking solution was placed onto control sections. For the test sections (native and partially demineralized) 200 μL of 1:200 dilution of the primary antibody (2.5μL antibody (either anti-DPP (12) or anti-CS [clone CS-56, Sigma]), 500 μL 3% BSA solution) in blocking solution onto each set of sections. All the slides were left overnight at 4°C.
After 18 hours of incubation, the slides were soaked in PBS 4 times for 15 minutes each to wash. To both sets of slides the secondary antibody fluorescently tagged in blocking solution (1 ml of blocking, 6 μL anti-mouse IgG 488 (Sigma), 6 μL anti-rabbit IgG 568 (Sigma) was added and left at room temperature in the dark for 1 hour. The slides were then washed with PBS 4 times for 15 minutes each. The slides were treated with Slowfade Gold® (Life Technologies, Grand Island, NY) and left in the dark, at room temperature, for at least 24 hours. Slides were imaged with an Olympus BX53 Microscope.
RESULTS
Tubules were isolated from a 1 μm thick dentin section (Fig. 1a.) using laser microdissection (Fig. 1b.) with the cutting area adjusted (Fig. 1c.) to make a very close trim, excluding or including the ITD.
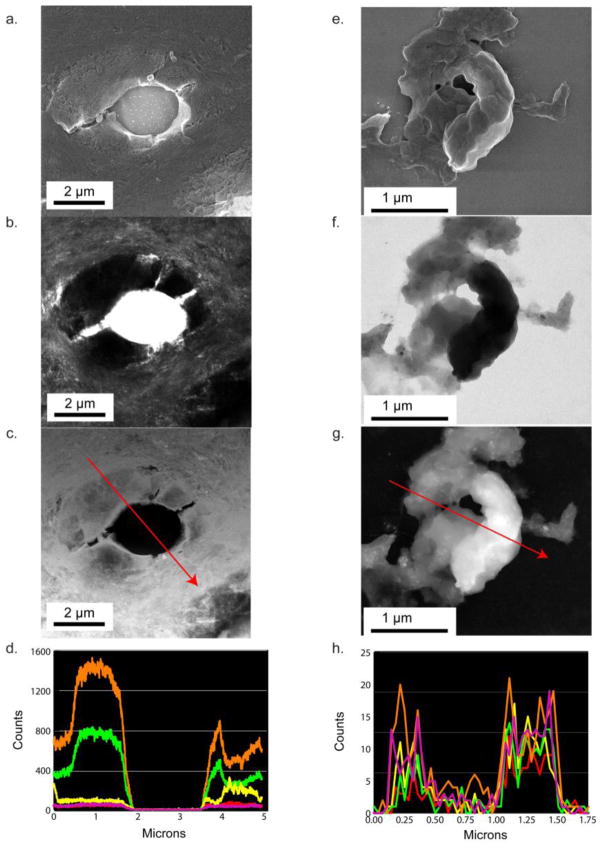
Figure 2a–c. shows a randomly selected dentin section located 1100 μm from the predentin-dentin junction showing the PTD with surrounding ITD, not exposed to the laser capture treatment. The SEM image (Fig. 2a.) indicates that this highly mineralized collar of the PTD annulus has a different topographical texture than the ITD. The TEM image (Fig. 2b.) shows that the area around the tubule is asymmetric and highly mineralized. The notable feature of the intact tubule selected here, is that the PTD collar is shown as fenestrated with traces of lateral branches of the now absent central odontoblastic process (13). These branches serve as landmarks later seen in elemental maps (Fig. 3b–g.). The EDS line scans of the emissions from the elements in the sample, Fig. 2d., along the red arrow in 2c., show regions where both calcium (orange) and phosphorous (green) are co-localized on the sample and regions where they are not. The major peaks of Ca and P were in the correct ratio of dentin carbonated apatite. Note that the scale is different on both axes and has lower spacial resolution than the line scans seen in Fig 2h. The isolated tubule contents from a randomly selected tooth (Figures 2e–h.) sectioned ~1100 μm from the predentin-dentin junction, show the SEM, TEM, ZC, and EDS line scans. Fig. 2e. shows that the captured PTD annulus was fragmented during the micro-dissection process, and reveals the variations in the composition of the annulus. The TEM and ZC images, (Fig. 2f–g.) clearly show that the PTD annulus is not uniformly mineralized, with a greater attenuation of the electron beam in the more mineralized portions than less mineralized portions (Fig. 2f–g.). The individual element line traces (Fig. 2h.) there are areas where calcium and phosphorous are co-localized and also aligned with areas where sulfur is detected. Additionally, in areas where calcium exists and phosphorous does not there are also areas where sulfur is detected (Fig. 2h and Fig. 5e–f.). The most striking data of Fig 2h. is the pronounced presence of S (magenta) in the annulus coinciding with the presence of secondary Ca peaks at the S maxima.
Figure 2.
Analysis of individual tubule contents in intact and laser capture ablated sections of dentin. a,b,c,d. An intact region of tubule PTD with surrounding ITD examined with Scanning EM a., Transmission EM b., ZC c. and a dual EDS linescan d. showing the relative signal counts of calcium (orange), phosphorous (green), sodium (red), chlorine (yellow), and sulfur (fuscia). e, f, g, h. An isolated tubule-PTD complex partially ablated by laser micro-dissection. No ITD is included. e., Sample examined with SEM f., TEM; g. Z contrast, ZC, and h. the dual EDS linescans showing the relative signal counts of calcium (orange), phosphorous (green), sodium (red), chlorine (yellow), and sulfur (fuscia).
Figure 3.
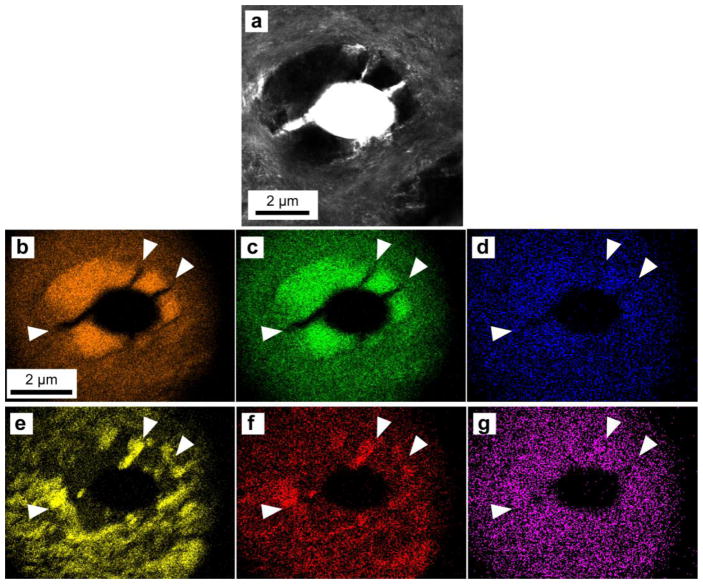
EDS mapping of an intact region of tubule, PTD and ITD (a.) collecting signals from calcium (b.), phosphorous (c.), magnesium (d.), chlorine (e.), sodium (f.), and sulfur (g.).
Figure 5.
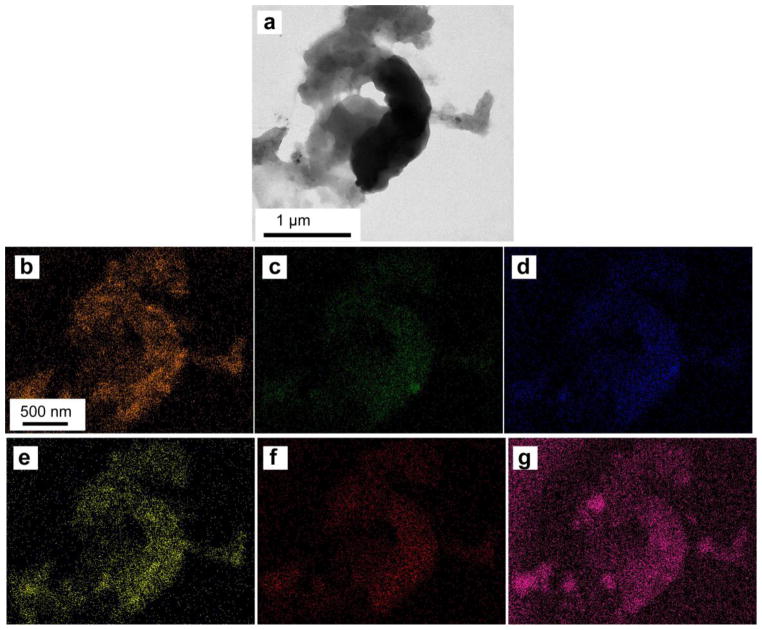
EDS mapping of an isolated tubule-PTD complex partially ablated by laser microdissection (a.) collecting signals from calcium (b.), phosphorous (c.), magnesium (d.), chlorine (e.), sodium (f.), and sulfur (g.)
EDS maps of this dentin section show large concentrations of chlorine and sodium in the ITD matrix but relatively less in the peritubular region (Fig. 3e–f.). In contrast the peritubular region is higher in concentration of both calcium and phosphorous than the ITD (Fig. 3b–c.). According to the EDS Map it is difficult to tell if the concentration of sulfur changes between the ITD and the PTD (Fig. 3g.), but examination of the elemental composition of the sample using a line scan without autoscaling (relative to the calcium concentration Fig. 4b) shows an increase in sulfur concentration in the PTD relative to the ITD (Fig. 4c.).
Figure 4.
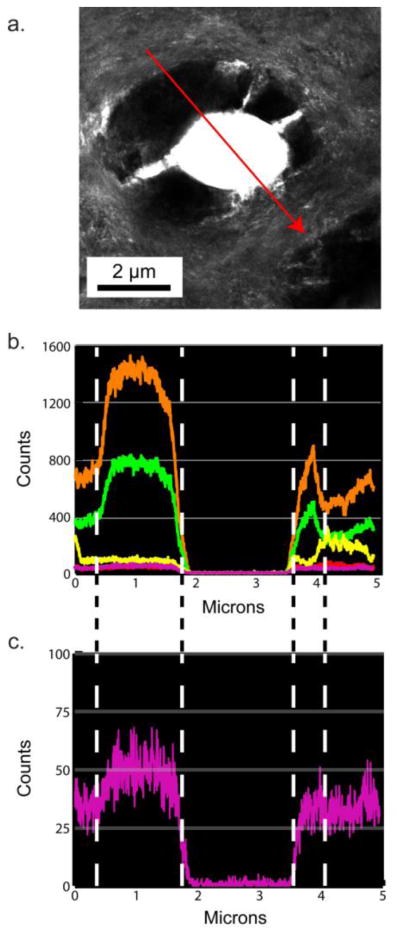
An intact region of tubule, PTD and ITD (a.), with an EDS linescan calcium (orange), phosphorous (green), sodium (red), chlorine (yellow), and sulfur (fuscia) (b.) and a magnified plot of just the signal from sulfur (c.).
Looking at the individual contents of the PTD annulus absent of the collagenous ITD matrix, the sulfur containing material is substantially present (Fig. 5g.). Surprisingly the strength and distribution of the signal from phosphorous (Fig. 5c.) does not correspond strongly to the calcium signal (Fig. 5b.). Instead the distribution of both calcium and sulfur, in this isolated PTD section, strongly correspond with each other (Fig 5a. & g. ). This corresponding distribution of calcium and sulfur and lack of correlation to phosphorous is not reflected in the electron density distribution seen in the TEM image (Fig. 5a).
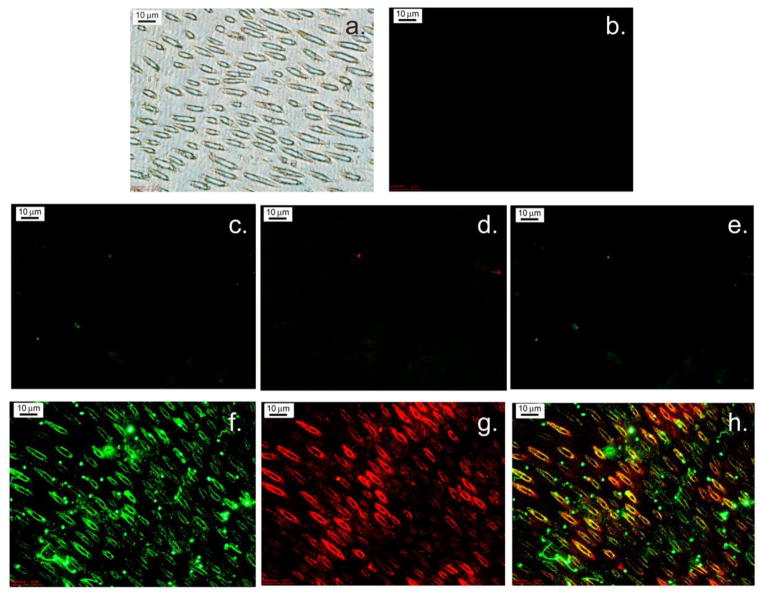
Immunohistochemical staining, to confirm the presence of sulfur in the form of chondroitin sulfate, was performed on dentin sections from a targeted tooth, specifically a third unerupted molar from the right side of a bovine jaw. Natively mineralized sections (untouched controls) showed no labeling by antibodies to either chondroitin sulfate or DPP (Fig. 6c–e). The partially demineralized (etched) sections show labeling of both the chondroitin sulfate antibody (red) (Fig. 6g.) and the DPP antibody (green) (Fig. 6f.). Areas where both DPP and chondroitin sulfate overlap are shown in yellow (Fig. 6h.).
Figure 6.
(a) Light Microscope image of untreated bovine PTD. (b) Control, mineralized PTD untreated by antibodies. (c–e) Native tissue kept in PBS (not de-mineralized). (c) DPP monoclonal antibody. (d) Monoclonal anti-Chondroitin sulfate antibody. (e) Overlay of c and d. (f–h) Tissue soaked in 0.5 M EDTA in 20mM Tris buffer pH 8 (demineralized). (f) DPP monoclonal antibody (green). (g) Monoclonal anti-Chondroitin sulfate antibody (red). (h) Overlay of f and g, colocalization is indicated by yellow color.
DISCUSSION
The use of laser microdissection on thin sections of mineralized tissue allows for the targeting and isolation of discrete regions of the tissue. Here we were fortuitously able to not only isolate and capture an individual tubule-PTD complex but were able to partially ablate the hypermineralized layer (Fig. 2e–g.). With this isolated tubule-PTD complex we were able to see both the fully mineralize tissue component and the underlying organic matrix in the same sample. The EDS mapping showed that in the dense portion of the tubule-PTD complex, that some regions of high calcium concentration coincide with phosphorous. While in the portion of the complex with low electron attenuation the regions of high calcium did not coincide with the presence of phosphorus. In both regions, the areas high in calcium also coincided with high concentrations of sulfur. This correlation suggests that the sulfur may be speciated as an oxyanion of some kind, and that this ion may be complexing with the calcium, sequestering calcium to these regions of the tissue. This would result in a region of tissue that is calcified but not necessarily mineralized. That is to say a region rich in calcium is calcified, but if that region is lacking the counter ion of the mineral phase (in this case phosphorus in the form of phosphate) then that same region cannot be called mineralized nor could it be called apatitic. At the same time the presence of sulfur does not exclude the presence of phosphorous, meaning that an organic matrix rich in sulfur that sequesters calcium can also contain phosphate and become mineralized to form apatite.
In the SEM examination of large sections of dentin (Fig. 2a.), from the same region of the tooth, shows the morphological texture of both the PTD and the ITD are distinctly different. ITD appears smoother with circum-annular striations around tubule and the PTD appears rougher and without striations. The TEM image (Fig. 2b) of the same region, shows the fibrous collagen component of the ITD which leads to the visible striations we see in the SEM; while there is a lack of collagen in the dense PTD region. Mineral in the PTD forms without the confining architecture of a collagen matrix and thus may lead to this more roughened texture seen in the SEM.
EDS mapping of these large sections of dentin (Fig. 3) show an increase in the concentration of calcium and phosphorous in the PTD region (relative to the ITD) which is commonly associated with an example of hypermineralization. As seen in Fig. 3b–c. the PTD annulus can be clearly distinguished using just the maps of calcium and phosphorous. However the negative space of the PTD annulus can also be interpreted by the lack of chlorine and sodium in that annulus and the heavy presence of those ions in the surrounding matrix (Fig. 3e–f.). In contrast, the presence of sulfur (Fig. 3g.) at this scale is not distinctly more prevalent in one region or the other, existing in both the ITD and the PTD and like sodium and chlorine, can also be found in the fenestrations. The relatively diminished sulfur signal (~3% when compared to Calcium) at this scale makes it difficult to draw any sort of correlation to any calcium-phosphorous-sulfur relation; but closer examination of the EDS linescan of sulfur (Fig. 4c.) from this region of the tissue indicates a that amount of sulfur is higher in the PTD relative to the ITD. In contrast the dip in chlorine and/or sodium concentration along the linescan (Fig 2h.) indicates the presence of PTD while an increase in signal is indicative of the ITD region.
Counts from EDS scans are the number of x-ray photons collected as a result of exciting the K orbitals of the atoms being investigated. Each atom emits an x-ray of a unique energy, therefore the amount of recorded x-rays photons of a certain energy represents a certain number of unique atoms emitting those x-rays. Above an acceleration voltage of 100 KV, electrons can penetrate the sample at just over 1 micron (the entire thickness of our sections). This means EDS mapping of a 1 micron thick section will record the presence of elements deep within the section and not just on the surface. At the sub micron level dentin is not a monolith. It is a woven nest of collagen fibers that is infiltrated and covered in mineral crystals no larger than 50–100 nm each. PTD is a composite of mineral and non-collagenous organic material lining the inner wall of the ITD. Laser microdissection does not result in a “coring” of dentin. Instead, since dentin is non-monolithic, laser microdissection at a sub 10 micron scale, results in the mineralized tissue flaking apart and breaking where ever defects (such as lateral fenestrations or at the boundary between ITD and PTD) may exist. As a consequence the isolated tubule PTD-complex is not 1 micron thick, but instead is at most several hundred nanometers thick. As a result the amount of physical material is considerably reduced compared to a full section. Therefore the number of photon counts from the EDS analysis of an isolated tubule is also considerably reduced in comparison to a full section. Additionally since laser dissection can result in ablation of the mineral immediately around the area where the laser has cut the tissue, material is physically removed in these regions. The noise level of the line scan can be easily seen in the beginning and end of the line scan of the isolated tubule PTD-complex where the scans have started and ended on the TEM grid (Fig. 2.g–h)
Recent evidence has demonstrated that the organic component of PTD is a proteoglycan (10, 11). Based on this evidence combined with data taken from the elemental analysis of an isolated tubule-PTD complex (Fig. 5), our hypothesis was that this proteoglycan could be chondroitin sulfate. To detect chondroitin sulfate within the sample and in relation to the tubules, immunohistochemistry was used with monoclonal anti-chondroitin sulfate antibody. One important thing to note is that during the labeling process we found that when the sections were run through the labeling process and washing protocol the sections curled up and fell away from the slides. So the sections were rehydrated with drops of water when sitting on a hotplate prior to using the labeling protocol and this prevented curling of the sections and ultimate the loss of the section when placed in the various solutions required for the immunohistochemistry protocol. Using anti-DPP as our control label, due to the fact that DPP is present everywhere in dentin (14), we found that the organic components of the dentin tissue were protected from labeling by the mineral components of the tissue. Since the mineral in PTD is preferentially etched due to the lack of collagen, brief treatment with EDTA removed the mineral component of PTD, but not the ITD, and exposed the underlying organic matrix for labeling. Labeling with monoclonal antibodies for both chondroitin sulfate and DPP revealed the presence of both chondroitin sulfate and DPP in the region immediately around the tubule. This demonstrates that not only may chondroitin sulfate sequester calcium ions in the PTD region but that DPP, a protein which has a role in collagen mineralization in dentin, may also play a role in the mineralization of PTD.
CONCLUSION
It is evident by this work that the PTD collars+ around the OD processes are higher in mineral than the surrounding ITD, as shown by many others. However, the PTD is irregular and not uniformly placed within the tubule. The texture of the PTD mineral is different than that of the ITD mineral, and the PTD is also porous. The PTD is calcified, but all of the calcified material is not apatite mineral. As shown by the Ca/P ratio’s and the EDS maps of isolated tubules hypercalcification does not necessarily mean hypermineralization. Earlier work has shown that the PTD contained phospholipids and proteoglycans. In this work the presence of a sulfated component (chondroitin sulfate) within the PTD was detected. The presence of sulfur co-localized with calcium (from the EDS mapping) suggests that the chondroitin sulfate may sequester calcium ions allowing for the entire complex to later become mineralized. At this point it is difficult to suggest any function for the PTD except possibly, through its porosity, providing for the transport of ions and other components between the OD processes and the dentin matrix.
Supplementary Material
HIGHLIGHTS.
Chondroitin sulfate B is the major matrix component of bovine peritubular dentin.
Laser capture of PTD and ITD sections allowed mapping of elemental content; Ca;S;P
PTD and ITD differed quantitatively in elemental composition: SPTD>SITD; CaPTD>CaITD
The PTD-ITD boundary is marked by enhanced PTD topographical surface roughness
We demonstrate the EDS mapping of mineralized tissue with sub-nanometer resolution
Acknowledgments
Microdissection was performed on Zeiss PALM laser catapulting microdissection system purchased with the support of NCRR 1S10RR025624-01
This work made use of the EPIC facility (NUANCE Center-Northwestern University), which has received support from the MRSEC program (NSF DMR-1121262) at the Materials Research Center; the International Institute for Nanotechnology (IIN); and the State of Illinois, through the IIN
We are pleased to acknowledge support by the National Institute for Dental and Craniofacial Research, Grant DE-01374 (to AV).
Footnotes
Competing Interests
We have no competing interests in the publication of this material
Publisher's Disclaimer: This is a PDF file of an unedited manuscript that has been accepted for publication. As a service to our customers we are providing this early version of the manuscript. The manuscript will undergo copyediting, typesetting, and review of the resulting proof before it is published in its final citable form. Please note that during the production process errors may be discovered which could affect the content, and all legal disclaimers that apply to the journal pertain.
References
- 1.Orban BBJ, Bhaskar SSN. Orban’s Oral Histology and Embryology. C. V. Mosby; 1986. [Google Scholar]
- 2.Dutra-Correa M, Anauate-Netto C, Arana-Chavez VE. Density and diameter of dentinal tubules in etched and non-etched bovine dentine examined by scanning electron microscopy. Archives of Oral Biology. 2007;52(9):850–855. doi: 10.1016/j.archoralbio.2007.03.003. [DOI] [PubMed] [Google Scholar]
- 3.Garberoglio R, Brannstrom M. Scanning electron microscopic investigation of human dentinal tubules. Archives of Oral Biology. 1976;21(6):355–362. doi: 10.1016/s0003-9969(76)80003-9. 2015/04/29. [DOI] [PubMed] [Google Scholar]
- 4.Schilke R, Lisson A, Jr, Bauss O, Geurtsen W. Comparison of the number and diameter of dentinal tubules in human and bovine dentine by scanning electron microscopic investigation. Archives of Oral Biology. 1999;45(5):355–361. doi: 10.1016/s0003-9969(00)00006-6. 2015/04/29. [DOI] [PubMed] [Google Scholar]
- 5.Dorvee JR, Deymier-Black A, Gerkowicz L, Veis A. Peritubular dentin, a highly mineralized, non-collagenous, component of dentin: isolation and capture by laser microdissection. Connective Tissue Research. 2014;55(S1):9–14. doi: 10.3109/03008207.2014.923876. [DOI] [PubMed] [Google Scholar]
- 6.Schneider CA, Rasband WS, Eliceiri KW. NIH Image to ImageJ: 25 years of image analysis. Nat Meth. 2012;9(7):671–675. doi: 10.1038/nmeth.2089. [DOI] [PMC free article] [PubMed] [Google Scholar]
- 7.Gotliv B-A, Robach JS, Veis A. The composition and structure of bovine peritubular dentin: Mapping by time of flight secondary ion mass spectroscopy. Journal of Structural Biology. 2006;156(2):320–333. doi: 10.1016/j.jsb.2006.02.005. [DOI] [PubMed] [Google Scholar]
- 8.Gotliv BA, Veis A. The Composition of Bovine Peritubular Dentin: Matching TOF-SIMS, Scanning Electron Microscopy and Biochemical Component Distributions. Cells Tissues Organs. 2009;189(1–4):12–19. doi: 10.1159/000151726. [DOI] [PMC free article] [PubMed] [Google Scholar]
- 9.Gotliv B-A, Veis A. Peritubular Dentin, a Vertebrate Apatitic Mineralized Tissue without Collagen: Role of a Phospholipid-Proteolipid Complex. Calcified Tissue International. 2007;81(3):191–205. doi: 10.1007/s00223-007-9053-x. [DOI] [PubMed] [Google Scholar]
- 10.Bertassoni LE, Stankoska K, Swain MV. Insights into the structure and composition of the peritubular dentin organic matrix and the lamina limitans. Micron. 2012;43(2–3):229–236. doi: 10.1016/j.micron.2011.08.003. [DOI] [PubMed] [Google Scholar]
- 11.Lu S, Zhao S-j, Gao Y, Sun Y, Li X, Chen J-h. Proteoglycans affect monomer infiltration in the etch-and-rinse bonding technique. Dental Materials. 2014;30(11):e289–e299. doi: 10.1016/j.dental.2014.05.015. [DOI] [PubMed] [Google Scholar]
- 12.Alvares K, Kanwar YS, Veis A. Expression and potential role of dentin phosphophoryn (DPP) in mouse embryonic tissues involved in epithelial–mesenchymal interactions and branching morphogenesis. Developmental Dynamics. 2006;235(11):2980–2990. doi: 10.1002/dvdy.20935. [DOI] [PubMed] [Google Scholar]
- 13.Mjor IA, Nordahl I. The density and branching of dentinal tubules in human teeth. Archives of Oral Biology. 1996;41(5):401–412. doi: 10.1016/0003-9969(96)00008-8. [DOI] [PubMed] [Google Scholar]
- 14.Veis A, Perry A. The Phosphoprotein of the Dentin Matrix*. Biochemistry. 1967;6(8):2409–2416. doi: 10.1021/bi00860a017. [DOI] [PubMed] [Google Scholar]
Associated Data
This section collects any data citations, data availability statements, or supplementary materials included in this article.


