

Abstract
Ceramides are bioactive sphingolipids, which are composed of sphingoid bases carrying acyl chains of various lengths. Ceramides are synthesized by a family of six ceramide synthases (CerS) in mammals, which produce ceramides with different N-linked acyl chains. Increased ceramide levels are known to contribute to the development of obesity and insulin resistance. Recently, it has been demonstrated that the ceramide acylation pattern is of particular importance for an organism to maintain energy homeostasis. However, which of the CerS family members are involved in this process is not yet completely known. Using newly developed CerS5 knock-out mice, we show here that CerS5 is essential to maintain cellular C16:0 sphingolipid pools in lung, spleen, muscle, liver, and white adipose tissue. Glycerophospholipid levels in CerS5-deficient mice were not altered. We found a strong impact of CerS5-dependent ceramide synthesis in white adipose tissue after high fat diet feeding. In skeletal muscle, liver, and spleen, C16:0-ceramide levels were altered independent of feeding conditions. The loss of CerS5 is associated with reduced weight gain and improved systemic health, including maintenance of glucose homeostasis and reduced white adipose tissue inflammation after high fat diet challenge. Our findings indicate that reduction of endogenous C16:0-ceramide by genetic inhibition of CerS5 is sufficient to ameliorate obesity and its comorbidities.
Keywords: adipose tissue metabolism, ceramide, ceramide synthase, diabetes, gene knockout, insulin resistance, lipid metabolism, metabolism, obesity, sphingolipid
Introduction
Ceramide synthases are sphingosine N-acyltransferases and represent an important metabolic hub in the ceramide synthesis pathway (Fig. 1A). They acylate sphingoid bases with fatty acid acyl chains of different length and saturation (Fig. 1B) (1–6), thereby creating ceramides with diverse biological properties (7–9). The ceramide synthase enzyme family contains six members (CerS1–6)6 in mammals (1, 9, 10). The individual enzymes differ in their substrate specificity and show different expression patterns (Fig. 1A) (1, 11). CerS1 is specifically expressed in muscle and neurons and has strong substrate specificity toward C18:0-CoA (1, 4, 11), whereas CerS2 and CerS4 are broadly expressed with specificity toward very long chain C20:0–26:0 CoAs and C18:0-C22:0 CoAs, respectively (1, 11). CerS3 is highly expressed in the epidermis and testis showing a substrate specificity for ultra-long chain CoAs (2, 10). CerS6 is expressed in most tissues at low levels and shows substrate specificity toward long chain C14:0–16:0-CoAs (Fig. 1B) (1, 11, 12). CerS5 expression has also been studied at the mRNA level and is expressed in most tissues at low levels (11) and has a specificity toward the long chain CoAs C14:0–18:0 (1).
FIGURE 1.

CerS are central enzymes in the sphingolipid metabolism pathway. A, schematic representation of sphingolipid synthesis with CerS enzymes at a central point, mediating N-acyl chain specificity. Sptlc, serine palmitoyltransferase; Kdsr, 3-ketodihydrosphingosine reductase; Degs, sphingolipid δ(4)-desaturase. B, N-acyl chain specificity of mammalian CerS enzymes adapted from Refs. 1–6.
Most murine CerS family members have also been characterized using knock-out (KO) mouse models. CerS1-deficient mice show behavioral abnormalities and Purkinje cell loss (4, 13), whereas CerS2 knock-out mice develop hepatocarcinomas and show myelination defects (3, 5, 14). CerS3 KO mice are lethal shortly after birth due to skin barrier disruption (2), and it was shown that CerS3 is also required for meiotic cytokinesis during spermatogenesis (15). CerS4-deficient mice show age-related hair loss (6), due to altered stem cell maintenance (16), and CerS6-deficient mice show behavioral abnormalities, including hind limb clasping (12). The diverse phenotypes of CerS mice suggest that ceramides exhibit chain length-specific functions.
Sphingolipids have been suggested to be metabolites promoting obesity, insulin resistance, and inflammation (17–21). Ceramides play a role in the development of lipid-induced insulin resistance. They have a negative impact on insulin-dependent AKT signaling via the ceramide-activated protein phosphatase PP2 and PRKCz, which inhibits plasma membrane recruitment of AKT (22–24). However, the data on ceramide-dependent inhibition of AKT are largely derived from cell culture studies where water-soluble synthetic C2-ceramide was added exogenously to the culture medium to examine the effects of ceramides. Data from in vivo studies involving the serine palmitoyltransferase inhibitor myriocin showed that de novo sphingolipid synthesis promotes insulin resistance in response to lard infusion and dexamethasone treatment in rats (19). Similar effects were observed for the heterozygous loss of the dihydroceramide desaturase Degs1 in mice (19). Myriocin treatment also reverses high fat diet-induced and genetically induced insulin resistance in mice (25). In particular, CerS6-derived C16:0-ceramide has recently been shown to have a negative impact on β-oxidation in the liver and brown adipose tissue thereby facilitating the development of obesity (18). Obesity-induced insulin resistance is exacerbated by the negative effect of the pro-inflammatory cytokines TNFα and IL-1β on systemic insulin sensitivity (26, 27), which originates from hypertrophic white adipose tissue (WAT) in a TLR4-dependent manner in the obese state (27). TLR4 is a pattern recognition receptor of the innate immune system that can be activated by the saturated fatty acid palmitate, leading to an increased transcription of TNFα and IL6 (26). De novo ceramide synthesis is up-regulated in dependence of TLR4 signaling and is functionally required to induce lipid-induced insulin resistance in myotubes but not TNFα release from macrophages (21). Also, the NLRP3 inflammasome has been implicated to promote saturated fatty acid-induced IL-1β release from macrophages (27). Addition of exogenous C2-ceramide to macrophages leads to an induction of IL-1β cleavage and release in an NLRP3 inflammasome-dependent manner (20). Data are scarce, and it is unclear which ceramide synthases are responsible for mediating the deleterious effects of ceramides in vivo.
CerS5 has been identified as the major ceramide synthase in lung epithelial cells. It has been suggested that CerS5 regulates phosphatidylcholine synthesis, the major lipid class of surfactant lipids (28). Extensive biochemical in vitro studies have further shown that CerS5 acts as a bona fide ceramide synthase (29) and that its homeodomain seems to be not essential for its enzymatic activity (30). However, two positively charged amino acids upstream of the CerS5 TLC domain shortly after the homeodomain are required for the enzymatic activity of CerS5 (30). The substrate specificity against C16:0-CoA is determined in a region of the TLC domain within 150 amino acids (31). CerS5 dimerizes with CerS2 and enhances CerS2 activity (32). It has been shown to regulate postmitochondrial events during apoptosis in MCF-7 cells in response to UV radiation in cooperation with CerS6 (33). CerS5 increases apoptosis in response to ionizing radiation in HeLa cells (34). Both CerS5 and CerS6 are responsible for radiation-induced C16:0-ceramide production in mitochondrion-associated endoplasmic reticulum membranes eventually leading to mitochondrial ceramide accumulation (34). Despite extensive biochemical characterization of CerS5 and experiments involving knockdown studies, an in vivo characterization of CerS5 is still lacking.
In this study, we present the generation of CerS5 KO mice. We characterized the consequences of CerS5 deficiency on lipid composition in tissues and analyzed the glycerophospholipid composition in the lung to address a potential role for CerS5 in glycerophospholipid homeostasis. We further studied the effect of CerS5 deficiency on the development of obesity and insulin resistance after a high fat diet challenge.
Experimental Procedures
Generation of CerS5 KO Mice
CerS5 KO mice were generated by replacement of the complete coding sequence with an NLS-lacZ gene and a frt-flanked neomycin resistance gene. A targeting vector containing homology arms flanking the coding sequence, a lacZ gene, and a frt neo cassette was created using the pDTA vector as plasmid backbone. The targeting vector was linearized using the unique NotI restriction site and electroporated into HM1 embryonic stem cells (35). Stably integrated clones were selected by supplementation of the culture medium with G418. G418-resistant clones were separated and screened for correct homologous recombination of the targeting vector by PCR over the 3′ homology arm. Homologous recombination of the targeting vector was further confirmed by Southern blotting and PCR strategies confirming correct integration. To generate chimeric mice, positive ES cell clones were injected to blastocysts. The resulting chimera were crossed with deleter-flp mice (36) to delete the neomycin resistance gene. Heterozygous CerS5 KO mice with successful deletion of the neomycin resistance cassette were backcrossed with C57BL/6JCrl mice for seven generations to perform obesity experiments and for four generations to analyze ceramide synthase activities and ceramide levels in lung tissue. Wild type (WT) control mice and KO mice were generated by breeding of heterozygous animals. Mice were genotyped using a PCR on genomic DNA obtained from tail biopsies to detect the presence or absence of the frt site in KO or WT mice using the following primer pair (forward, TTTCTAATTCAAGAGGTTCTTGGACA; reverse, CACAAAACTAGCCAGCACACCA). Mice were kept in a specific pathogen-free environment under standard conditions with a 12-h 300-lux white light/12-h red light cycle at a temperature of 21 ± 2 °C with 55 ± 15% relative humidity and were fed the standard diet LasVendi Rod16 ad libitum. For diet-induced obesity experiments male mice were separated and fed LasVendi Rod16 ad libitum until the age of 6 weeks. The diet was changed to Altromin C 1090-10 containing 10% of the energy from fat for 2 weeks, and the mice were split to the high and low fat diet groups and kept in individual cages. The high fat diet Altromin C 1090-60 containing 60% of the energy from fat was used. Mice were kept on the experimental diets until 24 weeks of age.
ELISA and Western Blotting
Leptin and insulin ELISAs (Millipore) were performed using the manufacturer's instructions. For Western blotting, tissue was harvested, snap-frozen in liquid nitrogen, and stored at −80 °C. Tissues were lysed in RIPA buffer using a Precellys homogenizer. Proteins were separated by SDS-PAGE and blotted to PVDF membranes. Membranes were blocked with 5% milk powder in TBST and incubated with primary antibodies at 4 °C overnight. After washing three times with TBST, secondary antibodies were incubated for 45 min, and after three further washes blots were developed. CerS5 antibodies were generated by immunization of sheep with purified GST-CerS5-CT (Q9D6K9-1), which had been expressed in Escherichia coli BL21 DE3 Gold and purified using glutathione beads. Antibodies were purified by affinity chromatography using a CerS5-CT column. For purification of CerS5 antibodies, the antiserum was diluted 1:10 with 10 mm Tris-HCl, pH 7.5, and applied to the CerS5-CT column. After incubation at 4 °C, the column was washed twice with TBS + 0.3% Tween and 500 mm NaCl and five times with TBS + 500 mm NaCl. Antibodies were eluted with 0.1 m glycine, pH 2.7, and neutralized with Tris, pH 8.8. CerS5 antibodies were used at a dilution of 1:2,000–1:5,000. Actin (Novus Biochemicals), tubulin (Sigma), and Gapdh (Millipore) antibodies were diluted 1:5,000, 1:200, and 1:1,000, respectively. pAKT Ser-473, pACC Ser-79, pAMPKα Thr-172, pAMPKβ Ser-108, AKT, ACC, AMPKα, AMPKβ 1 and 2, and LC3A, antibodies were purchased from Cell Signaling and used as described in the data sheet.
Ceramide Synthase Assays
Tissues were lysed in 20 mm HEPES-KOH, pH 7.4, using a Precellys homogenizer. For the isolation of microsomes, homogenates were centrifuged at 1,000 × g followed by a centrifugation at 100,000 × g at 4 °C. Crude extracts were only centrifuged at 1,000 × g for 10 -gauge needle. Protein concentrations were measured using the Pierce BCA kit. Microsomes were incubated in 20 mm HEPES-KOH, pH 7.4, with 10 μm alkyne-sphinganine complexed and 10 μm fatty acid-free BSA and 50 μm palmitoyl-CoA in a total volume of 100 μl for 20 min at 37 °C (37). Lipids were extracted by addition of 500 μl of chloroform/methanol (1:1, v/v) and 125 μl of 1% acetic acid. The lower chloroform phase was extracted twice and evaporated under a stream of nitrogen. The extracted lipids were dissolved in 7 μl of chloroform, and 30 μl of click mix (10 μl of 2 mg/ml 3-azido-7-hydroxycoumarin, 250 μl of 10 mm Cu(I)TFB in acetonitrile, 850 μl of ethanol) was added and incubated for 4.5 h at 43 °C. Lipids were analyzed by TLC in chloroform/methanol/water (8:1:0.1, v/v/v). The NBD-ceramide synthase assays were carried out in crude extracts and performed as described previously (38).
Real Time PCR
RNA was extracted using the Macherey & Nagel RNA II kit following the manufacturer's instructions. RNA from epididymal WAT (eWAT) was extracted using the Qiagen RNeasy lipid tissue mini kit following the manufacturer's instruction. cDNA was generated using the Qiagen QuantiTect reverse transcription kit. Real time PCR primer sequences are shown in Table 1. Primers to assess lipid uptake were taken from Xia et al. (39).
TABLE 1.
Sequences of primers used in real time PCR studies
| Gene | Forward primer | Reverse primer |
|---|---|---|
| TNFα | TCTGTCTACTGAACTTCGGG | ATCTGAGTGTGAGGGTCTG |
| IL-1β | AATGAAAGACGGCACACCC | CCACTTTGCTCTTGACTTCTATC |
| Leptin | AAGACCATTGTCACCAGGA | TGAAGCCCAGGAATGAAGT |
| Adiponectin, Adipoq | GGAGAGAAAGGAGATGCAGGT | CTTTCCTGCCAGGGGTTC |
| ATGL, Pnpla2 | TGACCATCTGCCTTCCAGA | TGTAGGTGGCGCAAGACA |
| HSL, Lipe | CACAAAGGCTGCTTCTACGG | TGTAGTGCTCCCCGAAGG |
| ACACA | GGCCAGTGCTATGCTGAGAT | CCAGGTCGTTTGACATAATGG |
| Acadm | TCTTGCTGGAAATGATCAACA | GGGCTCTGTCACACAGTAAGC |
| Acox1 | GCCCAACTGTGACTTCCATC | GCCAGGACTATCGCATGATT |
| Cpt1a | GCTGGGCTACTCAGAGGATG | CACTGTAGCCTGGTGGGTTT |
| C/EBPα | TGGACAAGAACAGCAACGAG | TCACTGGTCAACTCCAGCAC |
| Dgat2 | AGGCCCTATTTGGCTACGTT | GATGCCTCCAGACATCAGGT |
| Pck1 | GGAGTACCCATTGAGGGTATCAT | GCTGAGGGCTTCATAGACAAG |
| Pparα | CACGCATGTGAAGGCTGTAA | CAGCTCCGATCACACTTGTC |
| Pparγ | AAGACAACGGACAAATCACCA | GGGGGTGATATGTTTGAACTTG |
| Lipc | ACAAGGCGTGGGAACAGA | TGGCTTCTTTAATGGCTTGC |
| Pgc1α | CGCAATTCTCCCTTGTATGTG | ATCCCTCTTGAGCCTTTCGT |
Lipid Extraction
Sphingolipids were extracted as described previously with some modifications (4, 40). Sphingolipids from lung tissue were further purified by SPE extraction using Strata-1 silica columns (55 μm, 70 Å, 100 mg; Phenomenex). Ceramides were eluted with acetone/isopropyl alcohol (1:1, v/v); sphingomyelin was eluted with methanol. Sphingolipids from adipose tissue were subjected to mass spectrometry without further purification on silica columns. Neutral lipids from liver and lung glycerophospholipids were extracted according to Bligh and Dyer (41). Acylcarnitines were extracted from 20 μl of serum with 200 μl of acetonitrile containing 0.5% formic acid and NSK-B (Cambridge Isotope Laboratories) stable isotope-labeled internal standard mix. Extracts were centrifuged and supernatants were evaporated under a stream of nitrogen. The evaporated extracts were resolved in 3 n HCl in butanol, incubated at 65 °C for 15 min to form butyl esters. Extracts were dried again under a stream of nitrogen and resolved in mobile phase for analysis by mass spectrometry (42).
Thin Layer Chromatography
Lipid extracts from liver were normalized according to wet weight and spotted to Silica Gel 60 glass plates (Merck). The lipids were separated with n-hexane/diethyl ether/glacial acetic acid (70:30:1, v/v/v). Plates were sprayed with 10% CuSO4 in 8% phosphoric acid and incubated at 180 °C to visualize the lipids.
Quadrupole Time-of-Flight Mass Spectrometry
Sphingolipids in lung tissue were quantified as described previously (4). Sphingolipids in white adipose tissue were quantified by liquid chromatography coupled to mass spectrometry (LC-MS/MS) employing LC conditions as described previously by Markham and Jaworski (43) with some modifications. S1P in plasma was measured using LC conditions previously described by Haynes et al. (44) with some modifications. Acylcarnitine quantification was performed as described previously by An et al. (45). Sphingolipids and acylcarnitines were measured using an Agilent 6530 Accurate-Mass Q-TOF LC/MS instrument with an Agilent Jet Stream electrospray ionization (ESI) source operated in positive ionization mode with instrumental settings as described, except the capillary voltage was set to 3,500 V (46). Sphingomyelin, hexosylceramides, ceramide, and S1P were identified by characteristic fragments generated by collision-induced dissociation (m/z 184.0739, sphingomyelin; m/z 264.2691, hexosylceramides, ceramides, and S1P) and quantified by comparison with internal standards: d18:1–12:0 sphingomyelin, d18:1–17:0 sphingomyelin, d18:1–12:0 hexosylceramide, d18:1–12:0 ceramide, and d17:1-P (Avanti Polar Lipids). Glycerophospholipids were quantified by direct infusion Q-TOF mass spectrometry using internal standards according to Welti et al. (47) and Gasulla et al. (48).
Insulin Glucose Tolerance Tests
Glucose tolerance tests were performed in 7-h fasted mice. Two grams of glucose per kg of body weight was injected intraperitoneally into mice, and the serum glucose concentration was measured using a glucometer (Accu Chek Aviva, Roche Applied Science). Insulin tolerance tests were conducted on ad libitum fed mice. 0.5 units of human insulin (Insuman Infusat, Sanofi Aventis) per kg of body weight were injected, and the serum glucose concentration was determined.
Statistics
Data are typically presented as mean values. In each figure legend, the method to assess differences between genotypes and treatments is described. We applied the Student's t test or ANOVA in combination with Tukey post hoc tests to compare experimental groups. Data in Fig. 6, C–F, were square root transformed to meet test assumptions. To analyze the growth curve, a mixed model with random slope and intercept to predict weight using genotype, diet, and age as fixed effects and the mouse identification as random effect was generated using the lme4 package (18). Differences between groups were assessed using the multicomp package (17). Data were analyzed and plotted using Excel and the R-Project. No specific randomization method was used to distribute mice or samples to treatment groups.
FIGURE 6.

CerS5 deficiency suppresses diet-induced obesity. A, growth curve of CerS5 KO and WT mice after consumption of LFD or HFD (n = 15–27/group ±S.E.). B, longitudinal growth of Cer5 KO and WT mice on LFD and HFD. C, analysis of eWAT mass after HFD and LFD feeding (n = 12–26/group). D, eWAT cell area (n = 5–8/group). E, serum Leptin concentrations (n = 8–10/group). F, relative concentration of hepatic lipids determined by TLC analysis and densitometric quantification (n = 4/group ± S.E.). G and H, representative H&E staining of WAT (scale bar, 100 μm) and liver (scale bar, 50 μm), respectively (p values were calculated by ANOVA, and experimental groups were compared using Tukey post hoc tests).
Results
Generation of CerS5 KO Mice
CerS5 KO mice were generated by targeting the complete coding sequence of CerS5 by homologous recombination (Fig. 2A). This strategy ensures that no truncated protein can be formed, which could potentially interfere with a putative dimerization of CerS5 with other ceramide synthases (32). The rearrangement of the CerS5 gene locus after homologous recombination resulting in mice carrying the lacZneo allele and the subsequent deletion of the neomycin resistance cassette resulting in the lacZ allele were confirmed by Southern blotting (Fig. 2B). We could not detect any CerS5 transcript in CerS5 KO mice by real time PCR (Fig. 2C). There was no CerS5 protein expression detectable in CersS5 KO mouse embryonic fibroblasts using custom-made antibodies directed against the C terminus of CerS5 (Fig. 2D). For further experiments, mice homozygous for the CerS5 lacZ allele were used and termed CerS5 KO mice.
FIGURE 2.

Generation and verification of the CerS5 KO mouse model. A, gene targeting strategy. Schematic illustration of the genomic organization of the WT CerS5 locus, the recombined locus, including a frt site flanked pgk-Neo cassette for positive ES cell selection and the recombined locus after FLP-mediated deletion of the frt site flanked pgk-Neo cassette. B, Southern blot demonstrating recombination of the CerS5 gene locus and deletion of the frt site flanked pgk-Neo cassette with a probe against lacZ after genomic digestion with the enzyme SacI, resulting in no signal for the WT locus, a 9.5-kb band for the CerS5lacZ-neo allele, and a 7.6-kb band for the CerS5lacZ allele. C, CerS5 mRNA levels in WT (CerS5+/+), heterozygous (CerS5+/lacZ), and KO (CerS5lacZ/lacZ) lung tissue. D, detection of CerS5 protein using custom-made antibodies against the C terminus of CerS5 in MEFs generated from WT (CerS5+/+), heterozygous (CerS5+/lacZ), and KO (CerS5lacZ/lacZ) mice.
Expression of CerS5
We determined the CerS5 expression pattern in various tissues at the protein level. CerS5 protein could be detected in all investigated tissues and is most abundantly expressed in testis, lung, and epididymal WAT (eWAT). We detected moderate expression levels in thymus and spleen and subcutaneous WAT, although we found only very low levels in liver, muscle, heart, and interscapular brown adipose tissue (Fig. 3A).
FIGURE 3.

CerS5 is predominantly expressed in testis, eWAT, lung, spleen, and thymus. CerS5 protein expression was analyzed by Western blotting. CerS5 is predominantly expressed in eWAT, lung, and testis. CerS5 is modestly expressed in thymus, spleen, and subcutaneous WAT (scWAT). CerS5 is only expressed at very low levels in liver, muscle, and interscapular brown adipose tissue (iBAT).
CerS5 KO Mice Cannot Maintain C16:0-Ceramide-based Sphingolipid Levels although Glycerophospholipid Levels in the Lung Are Not Affected by CerS5 Deficiency
CerS5 KO mice are viable and fertile and do not show any obvious morphological phenotypic alterations. The lung has previously been identified as an organ where CerS5 is the dominant CerS isoform expressed (28). We also found CerS5 to be expressed abundantly in lung tissue. We used lung tissue to further validate and characterize the lipid alterations of the CerS5 KO mouse model. We found a reduction of C16:0-ceramide, but ceramides with other N-acyl chain lengths were not altered (Fig. 4A). Similarly, C16:0-dihydroceramide levels were lower in CerS5 KO mice, although the other dihydroceramides were unaltered (Fig. 4, B and I). The reduced C16:0-ceramide levels were also translated into C16:0 sphingomyelin and C16:0-hexyosylceramide species (Fig. 4, C, D, and I).
FIGURE 4.

Sphingolipids with C16:0N-acyl chains are reduced in lung tissue of CerS5 KO mice. A, ceramide levels (with d18:1 as long chain base) were quantified in lung tissue of adult CerS5 KO mice by mass spectrometry. B–D, analysis of sphingolipids containing C16:0-acyl chains in lung tissue (n = 5 ± S.D. per group) (p values calculated using an unpaired Student's t test). E, click ceramide synthase assay using alkyne-sphinganine as substrate and C16:0-CoA to demonstrate loss of CerS5 activity in lung tissue (n = 3 ± S.D. per group) (p values calculated with an unpaired Student's t test). F, NBD-ceramide synthase activity assay using NBD-sphinganine as substrate in combination with various acyl-CoAs (chain length indicated on the x axis of the graph, n = 4 ± S.D.). G, total phosphatidylcholine (PC), phosphatidylethanolamine (PE), phosphatidylinositol (PI), and phosphatidylserine (PS) levels. H, individual PC levels in lung tissues (n = 4–5 ± S.D. per group) (p values calculated using an unpaired Student's t test). I, mass spectrometric analysis of most abundant sphingolipids and glycerophospholipids demonstrating specific decrease of sphingolipids carrying C16:0-acyl chains.
To collect further evidence that the reduction of C16:0-ceramide levels in lung tissue is a consequence of decreased ceramide synthesis, we quantified ceramide synthase activity in lung microsomes using alkyne-sphinganine and palmitoyl-CoA as substrates. The enzymatic ceramide synthase activity was strongly decreased in microsomes obtained from KO mice (Fig. 4E). Similarly, we found reduced ceramide synthase activity toward C16:0-CoA and C14:0-CoA in crude lung extracts using NBD-labeled sphinganine as substrate (Fig. 4F). The activity against C18:0-CoA was also mildly reduced, whereas activity against the CerS2 substrate C24:1-CoA was unaltered (Fig. 4F).
To test the hypothesis whether CerS5 is involved in the regulation of phosphatidylcholine synthesis in lung epithelia (49), we measured glycerophospholipids in lung tissues. Deficiency of CerS5 did not lead to altered glycerophospholipid levels in whole lung tissue (Fig. 4, G–I). However, it is possible that the phosphatidylcholine level in epithelia was affected in CerS5 KO mice, but this effect might have been attenuated when looking at the glycerolipid content of whole lung tissues.
CerS5 KO mice exhibit reduced enzymatic activity toward C14:0-, C16:0-, and C18:0-CoAs. The strongest reduction of enzymatic activity was recognized with C16:0-CoA as substrate resulting in a decrease of sphingolipids with C16:0-N-acyl chains. A change of phosphatidylcholine or other glycerophospholipids (Fig. 4I) was not observed, indicating that the loss of CerS5 seems to play no major role for the homeostasis of lung glycerophospholipids. Taken together, our results show that CerS5 deficiency leads to a specific reduction of sphingolipids derived from C16:0-ceramide.
CerS5 KO Mice Are Unable to Maintain C16:0 Sphingolipid Pools in Muscle, Spleen, and Liver, and They Do Not Accumulate Long Chain Ceramides in Muscle and eWAT after High Fat Diet Challenge
Ceramides have been described as lipids promoting obesity and insulin resistance (50). We found high CerS5 protein levels in eWAT. It has been observed previously that C16:0-ceramide accumulates in eWAT and subcutaneous WAT after high fat diet (HFD) feeding (51). Therefore, we challenged CerS5 KO mice by feeding a HFD for 16 weeks and determined the sphingolipid concentrations in eWAT and also included other tissues participating in energy consumption or homeostasis. C16:0-ceramide levels are reduced in skeletal muscle tissue from mice exposed to the control and high fat diet in CerS5 KO mice (Fig. 5A). On the HFD CerS5 KO mice fail to further increase muscle C18:0-ceramide levels. The ceramide acylation pattern is also translated to the sphingomyelin molecular species in the skeletal muscle (Fig. 5B). Also in the liver, a reduction of C16:0-ceramide and C16:0 sphingomyelin was recognized (Fig. 5, C and D). We did not observe an accumulation of C16:0-ceramide but of very long chain C22:0-ceramide in livers of the HFD-fed mice compared with mice on the control diet. In the liver and muscle, the C16:0-ceramide is present at low concentrations compared with other tissues with high C16:0-ceramide levels like lung and eWAT. In eWAT, C16:0-ceramide tends to be lower in normal diet-fed CerS5 KO mice (Fig. 5E). However, in mice on HFD we observed a strong accumulation of long chain ceramide levels which was ameliorated in CerS5 KO mice. In particular, the levels of C16:0-ceramide and C18:0-ceramide were reduced in the CerS5 KO mice exposed to the HFD (Fig. 5E). Unlike in muscle and liver, the ceramide acylation pattern is not completely translated to sphingomyelins (Fig. 5F). Although we observed strong increases in ceramides in samples from HFD-fed mice, sphingomyelin levels stayed constant or are only mildly up-regulated. Ceramides and especially sphingomyelins C16:0-C22:0 in serum were strongly up-regulated by HFD feeding. In the CerS5 KO mice, the increase in serum C16:0 sphingomyelin was less pronounced compared with WT mice. (Fig. 5, G and H). We found lower levels of S1P in CerS5 KO mice on control diet, but on the HFD diet S1P levels in serum of CerS5 KO mice were normalized (Fig. 5G). Interestingly, C16:0-ceramide and sphingomyelin are of high abundance in the pancreas, but we did not observe a reduction of those lipids in CerS5 KO mice pointing to a dominant role for CerS6 in the pancreas (data not shown). Splenic C16:0-ceramide and sphingomyelin pools were significantly lower in CerS5-deficient mice on both dietary conditions (data not shown). We could not observe changes in the sphingolipid composition in the spleen between samples from normal and high fat diet-fed mice.
FIGURE 5.

High fat diet-dependent and -independent alterations of C16:0-ceramide and sphingomyelin in tissues. Analysis of ceramide (A, C, E, and G) and sphingomyelin (B, D, F, and H) in muscle, liver, eWAT, and serum (n = 3–5 mice per condition, values indicate mean ± S.E.). The inset in G shows S1P concentrations in serum. p values were calculated by ANOVA, and experimental groups were compared using Tukey post hoc tests. #, LFD versus HFD in WT mice; ¶, WT versus KO on LFD; *, WT versus KO on HFD.
CerS5 Deficiency Ameliorates Diet-induced Obesity
CerS5 KO and WT mice showed no differences in body weight when they were kept on a LFD (Fig. 6A). When CerS5 KO and WT mice were fed a HFD, the KO mice gained less weight compared with WT mice (Fig. 6A). We observed a trend toward shorter longitudinal growth in CerS5 KO mice (Fig. 6B). CerS5 deficiency had no effect on eWAT mass at the LFD, but the increase of eWAT mass on the HFD was attenuated in the CerS5 KO mice (Fig. 6C). Similarly, the size of cells in the eWAT was identical on the LFD, although CerS5 KO mice were protected against the increase of adipocyte size on the HFD (Fig. 6D). Furthermore, circulating leptin levels were highly increased in WT mice fed a HFD but remained low in CerS5 KO mice (Fig. 6E). We also analyzed hepatic concentrations of triglycerides (TAG) and non-esterified fatty acid. Both lipids are associated with hepatic steatosis (52). Lipid analysis by thin layer chromatography revealed elevated TAG and non-esterified fatty acid concentrations after consumption of the high fat diet in livers of WT mice (Fig. 6F). In the CerS5 KO mice, the accumulation of TAG and non-esterified fatty acids after HFD feeding was ameliorated. Hematoxylin-eosin stainings of eWAT show increased adipocyte size and the presence of crown-like structures in WT, but not KO mice on a HFD (Fig. 6G). Histological analysis of the liver revealed signs of steatosis in WT but not KO mice after a HFD challenge (Fig. 6H).
CerS5 KO Mice Are Protected from Obesity-induced Glucose Intolerance and Insulin Resistance
We analyzed the impact of CerS5-dependent ceramide synthesis on glucose homeostasis in mice fed a LFD and a HFD. CerS5 KO and WT mice performed similarly in glucose tolerance tests on a low fat diet (Fig. 7, A and C). After consumption of the HFD, WT mice became severely glucose-intolerant, whereas CerS5 KO mice were protected against glucose intolerance (Fig. 7, A and C). To address insulin sensitivity in CerS5 KO mice, we conducted insulin tolerance tests under LFD conditions and observed no difference between WT and KO mice (Fig. 7, B and D). After consumption of the HFD, CerS5 KO mice retained insulin sensitivity, whereas WT animals became insulin-resistant (Fig. 7, B and D). Insulin concentrations in the serum of CerS5 KO mice were lower in both HFD- and LFD-fed mice compared with WT mice (Fig. 7E). However, changes in insulin concentrations did not reach statistical significance. Starvation glucose levels were elevated in WT mice after the HFD, and the elevation of glucose levels was blunted in CerS5 KO mice after HFD feeding (Fig. 7F). Taken together, CerS5 KO mice do not suffer from type II diabetes after consumption of a HFD and glucose homeostasis is not changed in mice which consumed a LFD.
FIGURE 7.

Improved glucose tolerance and insulin sensitivity after HFD exposure in CerS5 KO compared with WT mice. A, glucose tolerance test (GTT) from WT and CerS5 KO mice. (n = 9; 6; 14 and 11 mice for WT LFD, KO LFD, WT HFD, and KO HFD, respectively. Data represent mean ± S.E.). B, insulin tolerance test (ITT) from WT and CerS5 KO mice (n = 10; 6; 12 and 11 mice for WT LFD, KO LFD, WT HFD, and KO HFD, respectively ± S.E.). C and D, area under the curve (AUC) of insulin and glucose tolerance tests. E, serum insulin concentration (n = 7; 8; 8 and 9 mice for WT LFD, KO LFD, WT HFD, and KO HFD, respectively). F, starvation glucose levels (n = 9; 6; 14 and 11 mice for WT LFD, KO LFD, WT HFD, and KO HFD, respectively) (p values were calculated by ANOVA and experimental groups were compared using Tukey post hoc tests).
CerS5 Deficiency Is Associated with Improved Adipose Tissue Health and Function after Consumption of a HFD
We studied energy-sensing pathways and autophagy in CerS5 KO mice after consumption of the HFD. Levels of phosphorylated AKT at Ser-473 trend higher in ad libitum-fed CerS5 KO mice (Fig. 8A). The expression of acetyl-CoA carboxylase (ACC), catalyzing the rate-limiting step in fatty acid synthesis, is increased in CerS5 KO mice (Fig. 8, A and E). We did not observe alterations of the inactivating phosphorylation of ACC at Ser-79 (Fig. 8A). Energy deprivation and cellular stress lead to an induction of autophagy, but we found lower activation of autophagy in CerS5 KO mice after HFD measured by LC3A lipidation (Fig. 8A).
FIGURE 8.
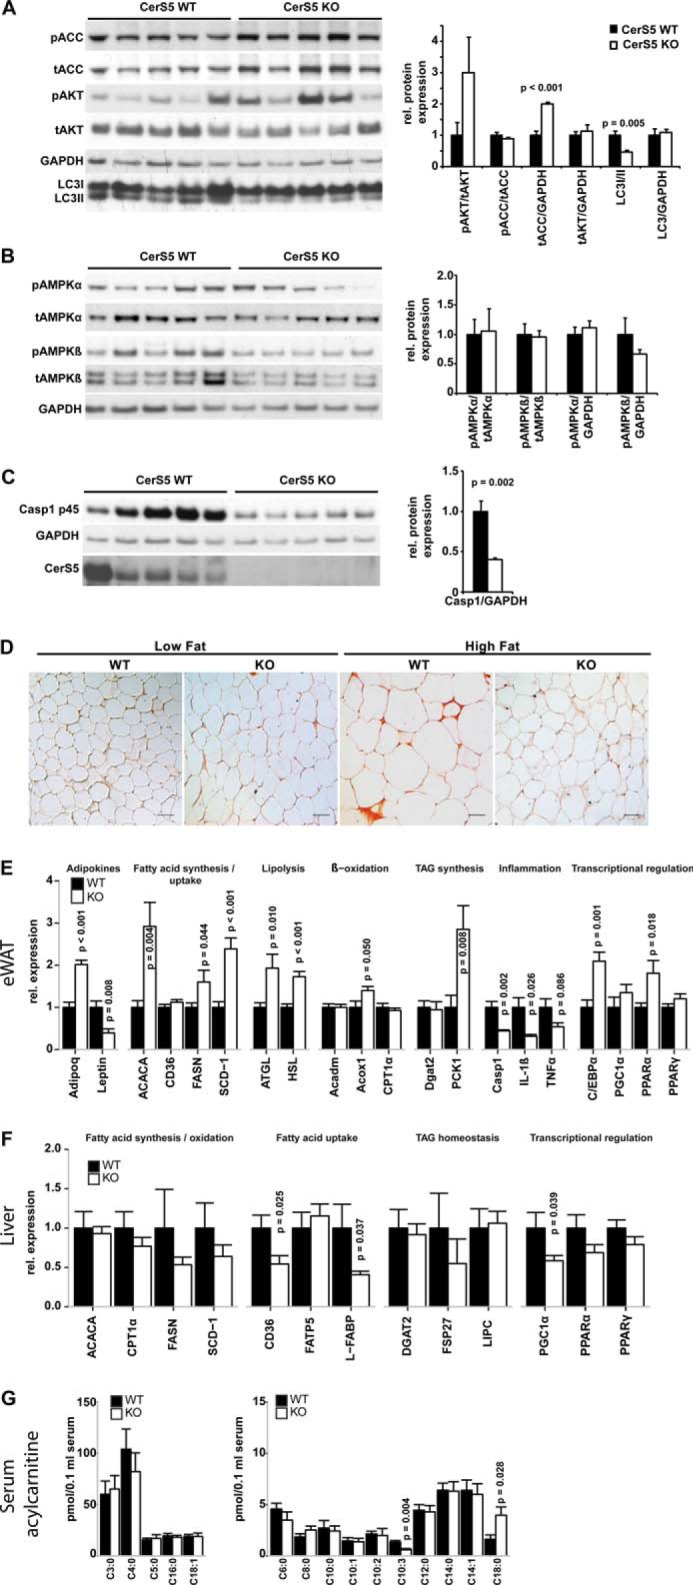
CerS5 deficiency is associated with improved adipose tissue health after HFD feeding. A, analysis of phosphorylation of acetyl-CoA carboxylase at serine 79 (ACC) and AKT at serine 473 (AKT) and LC3 lipidation as marker for autophagy induction (unlipidated (LC3I) and lipidated (LC3II) LC3) in eWAT by Western blotting (WT n = 5, KO n = 5) Quantification of phosphorylation status, expression levels, and LC3 lipidation is depicted in the graph next to the blot. B, analysis of expression and phosphorylation of AMP-activated protein kinase α (AMPKα) at threonine 172and AMP-activated protein kinase β (AMPKβ) at serine 108. C, protein expression of the procaspase-1 p45 (Casp1) in eWAT after HFD challenge. D, F4/80 staining of eWAT under LFD and HFD (scale bar, 50 μm). E, expression levels of central players in eWAT function after HFD (WT n = 8, KO n = 6). F, hepatic expression levels of genes involved in lipid homeostasis after HFD (WT n = 10, KO n = 12). G, acylcarnitine profile of serum from mice fed a HFD (WT and KO n = 6) (data represent mean ± S.E. p values calculated using an unpaired Student's t test).
We also did not observe activation of the AMPK system indicating availability of sufficient cellular energy (Fig. 8B). It has been shown that a driving force of chronic obesity-induced insulin resistance is eWAT inflammation (53, 54), which is sensed by TLR4 (55) and NLRP3 (27). Therefore, we analyzed macrophage infiltration into eWAT and proinflammatory gene expression in CerS5 KO mice in response to a HFD. The expression of procaspase-1, which is responsible for IL-1β cleavage and induced by NF-κB, is decreased in CerS5 KO mice (Fig. 8, C and E). eWAT expression of the proinflammatory cytokines TNFα and IL-1β is lower in CerS5 KO mice compared with WT mice after a HFD challenge (Fig. 8E). Under steady state conditions, F4/80-positive crown-like structures are not detectable in WT and KO mice (Fig. 8D). After the HFD challenge, F4/80-positive crown-like structures are present in the eWAT of WT mice but not in CerS5 KO mice (Fig. 8D). We further characterized eWAT of CerS5 KO mice and found low leptin and high adiponectin (Adipoq) expression after a HFD. Genes involved in de novo fatty acid synthesis (ACACA, FASN, and SCD-1) were up-regulated in CerS5 KO mice (Fig. 8E). Simultaneously to the increased lipid anabolism, we observed an up-regulation of the lipases ATGL and HSL indicating increased catabolism of storage lipids. We also found an up-regulation of PCK1 (Fig. 8E), which catalyzes a key step in glyceroneogenesis and eventually provides glycerol 3-phosphate for TAG synthesis and fatty acid re-esterification in adipose tissue (56). However, we did not observe an increase in the gene expression of CPT1, the rate-limiting step in β-oxidation and other genes involved in β-oxidation. We found no alterations in circulating long, medium, and short chain acylcarnitine, except an elevation of C18:0- and a decrease of C10:3-acylcarnitine in CerS5 KO mice providing a snapshot of systemic β-oxidation. This indicates a proper import of fatty acids into mitochondria, a lack of excessive mitochondrial overload, and probably increased selection of C18:0 fatty acids for oxidation (Fig. 8G). The transcription factor C/EBPα, responsible for terminal adipocyte differentiation in cooperation with PPARγ by the regulation of adipogenic genes, was increased (Fig. 8E) (57). We also found an increased expression of PPARα, which has the ability to suppress the expression of genes regulated by NF-κB (58).
We also quantified genes involved in lipid homeostasis in the liver. We could not find alterations in the expression of genes involved in lipogenesis or oxidation (Fig. 8F), but we found lower expression of CD36 and L-FABP (Fig. 8F), indicating reduced uptake of lipids from the circulation into hepatocytes reducing hepatic lipid accumulation.
Our data indicate that CerS5 KO mice show simultaneous activation of anabolic and catabolic lipid metabolism pathways in eWAT and thereby possibly inducing futile pathways. This leads to improved adipose tissue health when nutrients are abundant like HFD feeding. Hepatic lipid accumulation is suppressed by the reduced expression of genes from the fatty acid import machinery.
Discussion
Ceramides have been identified as critical regulators of cell growth and differentiation, and their dysregulation triggers stress responses, programmed cell death, and also obesity-associated insulin resistance and cancer (7, 19, 59). Ceramide-lowering interventions led to improved insulin sensitivity in various studies (19, 25, 60–62). The de novo synthesis of ceramides and the recycling of free sphingosine produced from the degradation of pre-formed sphingolipids via the salvage pathway are catalyzed by a family of six ceramide synthases in mammals. Each of these enzymes has characteristic substrate specificity and produces ceramides with characteristic acyl chain distributions (Fig. 1B), thereby regulating specific cell and organismal responses (7). The reduction of specific ceramides generated by the individual ceramide synthases leads to a variety of phenotypes. Mice carrying a targeted or spontaneous mutation in CerS1 suffer from severe neurological alterations (4, 13), and CerS2 null mice display defects in myelination and develop hepatocarcinoma (3, 14). Cers3 KO mice are lethal after birth due to trans-epithelial water loss (2), and CerS4 KO mice suffer from alopecia and display altered sebum composition (50, 59). CerS6 KO mice display a hind limb clasp phenotype (12), and they show reduced C16:0-ceramide levels and are protected from HFD-induced obesity due to increased β-oxidation in liver and brown adipose tissue (18). We have studied the expression and function of CerS5 in the mouse. For this purpose, we generated a CerS5 KO model for functional in vivo analysis and generated novel antibodies directed against CerS5. We found that the CerS5 protein is most abundantly expressed in testis, lung, thymus, spleen, and eWAT, whereas low expression was observed in tissues such as muscle, liver, and interscapular brown adipose tissue. Homozygous CerS5 KO mice were viable and showed no apparent morphological alterations. However, the analysis of the sphingolipid composition of the mutant animals in lung tissue revealed that C16:0-dihydroceramide and ceramide levels were reduced, whereas ceramides with other N-acyl chain lengths were not altered. Consistently, we also found that the enzymatic CerS activity toward long chain acyl-CoAs was strongly decreased in microsomes obtained from KO mice and in crude lung extracts. Differentially regulated C16:0-ceramide-based sphingolipids did not lead to altered levels of glycerophospholipids in lung tissue. Thus, our studies revealed that the loss of basal CerS5 levels does not play a role in glycerophospholipid homeostasis in vivo.
CerS5 Mutant Mice Are Partially Protected against HFD-induced Obesity
To further explore the function of CerS5, we exposed WT and KO mice to a HFD. In wild type animals, the HFD challenge leads to a strong increase of ceramides in eWAT. This increase was most prominent for C16:0- and C18:0-ceramide, similar to the observations made by Shah et al. (51). However, the accumulation in C16:0-ceramide was almost completely inhibited in CerS5 KO mice. Interestingly, we also found reduced C18:0-ceramide levels in eWAT after HFD challenge. We cannot exclude that these effects are also mediated by CerS5, because in in vitro activity assays, CerS5 has not only a substrate specificity against C16:0-CoA but also against C14:0 and C18:0 CoA. Of note, we did not observe a translation of ceramide accumulation to sphingomyelin species. This might be a consequence of increased acid sphingomyelinase activity in eWAT, which prevents the accumulation of sphingomyelin after HFD feeding (51). Our results further indicate that CerS5 is needed for the accumulation of adipose tissue ceramide and cannot be compensated by CerS6 in eWAT after exposure to a HFD. CerS5 KO mice also had lower C16:0-ceramide and sphingomyelin levels in liver and especially in skeletal muscle on control and HFD. In HFD-fed animals, we also found protection against C18:0-ceramide accumulation in muscle tissue, but we did not observe C16:0-ceramide accumulation in these tissues after HFD feeding. Although the absolute C16:0-ceramide concentrations in liver and muscle are low compared with the dominant sphingolipids in these tissues, it is likely that they contribute to the CerS5 phenotype, because a reduction of hepatic C16:0-ceramide produced by CerS6 also reduces weight gain in HFD-fed mice (18). It has been shown previously that a reduction of ceramide by myriocin administration in obese C57BL/6 mice results in increased energy expenditure and a shift toward fat as the main energy source (51). Our studies identify C16:0-ceramide produced by CerS5 as weight gain-promoting lipid and thus further refine the concept of ceramides, specifically C16:0-ceramide, as obesity-sensitizing lipids. Because S1P influences hepatic steatosis (63, 64), we quantified S1P in serum and found lower levels of S1P in CerS5 KO mice on a control diet but no effect on S1P concentrations in CerS5 KO mice on a HFD. Therefore, a contribution of S1P to the CerS5 phenotype cannot be excluded but seems unlikely.
The function of ceramide synthases in lipid storage induction is a conserved feature across other phyla. Mutants of the single Drosophila CerS family member schlank display strongly reduced triacylglycerol storage in their fat storage tissue (65).
We also showed that CerS5 KO mice have improved glucose tolerance and lower adipose tissue inflammation after HFD feeding. This indicates improved overall adipose tissue health after HFD feeding in the CerS5 KO mice. Lipid-induced ceramide production is dependent on TLR4 in macrophages and myotubes resulting in insulin resistance (21). Whether the protection against insulin resistance in CerS5 KO mice is a consequence of lower obesity or whether C16:0-ceramide plays an additional role in inflammatory pathways or more directly induces insulin resistance has to be further elucidated. However, ceramide-induced NLRP3 inflammasome activation and IL-1β production leads to insulin resistance (20). Also ceramide-activated protein kinases or phosphatases could directly influence insulin signaling (52). Lowering ceramide levels, especially C16:0- and C18:0-ceramide, in liver and WAT by increasing ceramide degradation leads to improved insulin signaling and reduced steatosis after HFD feeding (39). We also found decreased autophagy after HFD feeding in eWAT of CerS5 KO mice. CerS5 has been implicated in lipid-induced autophagy as a consequence of C14:0-ceramide production in cardiomyocytes (66). The reduction of autophagy in eWAT of CerS5 KO mice could contribute to the CerS5 phenotype of lower obesity, because autophagy in eWAT is required for mitophagy. The depletion of mitochondria by mitophagy leads to a lower β-oxidation capacity, which allows storage lipids to accumulate in eWAT (67). More directly, mitochondrial C18:0- and C16:0-ceramides interact with LC3B to recruit autophagosomes to mitochondria to induce mitophagy (68). Ceramide-induced mitophagy might not be only a molecular switch between lethal and pro-survival-related autophagy, but could also have an impact on the regulation of energy metabolism. We found a simultaneous up-regulation of fatty acid synthesis and TAG degradation in eWAT with both leading to the production of fatty acids. PCK1 was induced in eWAT of CerS5 KO mice providing glycerol 3-phosphate for TAG synthesis and fatty acid re-esterification inducing futile cycles of TAG breakdown and re-synthesis, which is also induced by thiazolidinediones (56).We found higher C18:0 acylcarnitine concentrations in serum and did not observe incomplete oxidation of fatty acids (69).
We also observed lower expression of genes involved in hepatic lipid uptake. Recently, it has been shown that lowering adipose tissue ceramide by adipose tissue-specific overexpression of acid ceramidase regulates hepatic lipid uptake. Given the CerS5 expression pattern with low expression in the liver but high expression in white adipose tissue, it may be possible that the effects observed on hepatic lipid accumulation are mediated indirectly probably by sphingolipids carried in the circulation (39).
The variety of phenotypes occurring in the individual CerS KO mice demonstrates the need for inhibitors targeting specific ceramide synthases. Tailored inhibition of long chain ceramide synthesis could be a novel strategy for therapeutics against obesity. Although this might be challenging due to the high similarity between the ceramide synthases, recently four new inhibitors derived from FTY720 with preferences for specific CerS isoforms have been identified (70). Our findings further refine long chain ceramide synthesis as a potential drug target to treat obesity and type II diabetes.
Author Contributions
All experiments were designed and performed by D. G. D. G., K. v. D., and P. D. analyzed sphingolipids. P. S. J. helped in performing the HFD studies, and M. F. contributed to the ceramide synthase assays. D. G., A. C. C., M. K., and J. D. contributed to the generation of the CerS5 targeting vector. M. H. conceived and supervised the study. DG and MH wrote the manuscript.
Acknowledgments
We thank Melanie Thielisch and Marina Trampp for excellent technical assistance; Helga Peisker for glycerophospholipid analysis; and Christoph Thiele for providing the alkyne-sphinganine and the click reagents. We thank Elvira Mass and Anna C. Aschenbrenner for critically reading the manuscript and the members of the AG Hoch for fruitful discussions.
This work was supported in part by Deutsche Forschungsgemeinschaft DFG Grants SFB 645, TP B1 and SFB TR83, TP A7 (to M. H.). The authors declare that they have no conflicts of interest with the contents of this article.
- CerS
- ceramide synthase
- NBD
- 7-nitro-2-1,3-benzoxadiazol-4-yl; oxa-1,3-diazol-4-yl))
- TAG
- triglyceride
- S1P
- sphingosine 1-phosphate
- WAT
- white adipose tissue
- eWAT
- epididymal WAT
- ANOVA
- analysis of variance
- HFD
- high fat diet
- LFD
- low fat diet
- ACC
- acetyl-CoA carboxylase
- AMPK
- AMP-activated protein kinase
- AKT
- protein kinase B/Akt.
References
- 1. Mizutani Y., Kihara A., and Igarashi Y. (2005) Mammalian Lass6 and its related family members regulate synthesis of specific ceramides. Biochem. J. 390, 263–271 [DOI] [PMC free article] [PubMed] [Google Scholar]
- 2. Jennemann R., Rabionet M., Gorgas K., Epstein S., Dalpke A., Rothermel U., Bayerle A., van der Hoeven F., Imgrund S., Kirsch J., Nickel W., Willecke K., Riezman H., Gröne H.-J., and Sandhoff R. (2012) Loss of ceramide synthase 3 causes lethal skin barrier disruption. Hum. Mol. Genet. 21, 586–608 [DOI] [PubMed] [Google Scholar]
- 3. Imgrund S., Hartmann D., Farwanah H., Eckhardt M., Sandhoff R., Degen J., Gieselmann V., Sandhoff K., and Willecke K. (2009) Adult ceramide synthase 2 (CERS2)-deficient mice exhibit myelin sheath defects, cerebellar degeneration, and hepatocarcinomas. J. Biol. Chem. 284, 33549–33560 [DOI] [PMC free article] [PubMed] [Google Scholar]
- 4. Ginkel C., Hartmann D., vom Dorp K., Zlomuzica A., Farwanah H., Eckhardt M., Sandhoff R., Degen J., Rabionet M., Dere E., Dörmann P., Sandhoff K., and Willecke K. (2012) Ablation of neuronal ceramide synthase 1 in mice decreases ganglioside levels and expression of myelin-associated glycoprotein in oligodendrocytes. J. Biol. Chem. 287, 41888–41902 [DOI] [PMC free article] [PubMed] [Google Scholar]
- 5. Pewzner-Jung Y., Park H., Laviad E. L., Silva L. C., Lahiri S., Stiban J., Erez-Roman R., Brügger B., Sachsenheimer T., Wieland F., Prieto M., Merrill A. H. Jr., and Futerman A. H. (2010) A critical role for ceramide synthase 2 in liver homeostasis: I. alterations in lipid metabolic pathways. J. Biol. Chem. 285, 10902–10910 [DOI] [PMC free article] [PubMed] [Google Scholar]
- 6. Ebel P., Imgrund S., Vom Dorp K., Hofmann K., Maier H., Drake H., Degen J., Dörmann P., Eckhardt M., Franz T., and Willecke K. (2014) Ceramide synthase 4 deficiency in mice causes lipid alterations in sebum and results in alopecia. Biochem. J. 461, 147–158 [DOI] [PubMed] [Google Scholar]
- 7. Grösch S., Schiffmann S., and Geisslinger G. (2012) Chain length-specific properties of ceramides. Prog. Lipid Res. 51, 50–62 [DOI] [PubMed] [Google Scholar]
- 8. Park W.-J., and Park J.-W. (2015) The effect of altered sphingolipid acyl chain length on various disease models. Biol. Chem. 396, 693–705 [DOI] [PubMed] [Google Scholar]
- 9. Levy M., and Futerman A. H. (2010) Mammalian ceramide synthases. IUBMB Life 62, 347–356 [DOI] [PMC free article] [PubMed] [Google Scholar]
- 10. Mizutani Y., Kihara A., and Igarashi Y. (2006) LASS3 (longevity assurance homologue 3) is a mainly testis-specific (dihydro)ceramide synthase with relatively broad substrate specificity. Biochem. J. 398, 531–538 [DOI] [PMC free article] [PubMed] [Google Scholar]
- 11. Laviad E. L., Albee L., Pankova-Kholmyansky I., Epstein S., Park H., Merrill A. H. Jr., and Futerman A. H. (2008) Characterization of ceramide synthase 2: tissue distribution, substrate specificity, and inhibition by sphingosine 1-phosphate. J. Biol. Chem. 283, 5677–5684 [DOI] [PubMed] [Google Scholar]
- 12. Ebel P., Vom Dorp K., Petrasch-Parwez E., Zlomuzica A., Kinugawa K., Mariani J., Minich D., Ginkel C., Welcker J., Degen J., Eckhardt M., Dere E., Dörmann P., and Willecke K. (2013) Inactivation of ceramide synthase 6 in mice results in an altered sphingolipid metabolism and behavioral abnormalities. J. Biol. Chem. 288, 21433–21447 [DOI] [PMC free article] [PubMed] [Google Scholar]
- 13. Zhao L., Spassieva S. D., Jucius T. J., Shultz L. D., Shick H. E., Macklin W. B., Hannun Y. A., Obeid L. M., and Ackerman S. L. (2011) A deficiency of ceramide biosynthesis causes cerebellar Purkinje cell neurodegeneration and lipofuscin accumulation. PLoS Genet. 7, e1002063. [DOI] [PMC free article] [PubMed] [Google Scholar]
- 14. Pewzner-Jung Y., Brenner O., Braun S., Laviad E. L., Ben-Dor S., Feldmesser E., Horn-Saban S., Amann-Zalcenstein D., Raanan C., Berkutzki T., Erez-Roman R., Ben-David O., Levy M., Holzman D., Park H., et al. (2010) A critical role for ceramide synthase 2 in liver homeostasis: II. insights into molecular changes leading to hepatopathy. J. Biol. Chem. 285, 10911–10923 [DOI] [PMC free article] [PubMed] [Google Scholar]
- 15. Rabionet M., Bayerle A., Jennemann R., Heid H., Fuchser J., Marsching C., Porubsky S., Bolenz C., Guillou F., Gröne H.-J., Gorgas K., and Sandhoff R. (2015) Male meiotic cytokinesis requires ceramide synthase 3-dependent sphingolipids with unique membrane anchors. Hum. Mol. Genet. 24, 4792–4808 [DOI] [PubMed] [Google Scholar]
- 16. Peters F., Vorhagen S., Brodesser S., Jakobshagen K., Brüning J. C., Niessen C. M., and Krönke M. (2015) Ceramide synthase 4 regulates stem cell homeostasis and hair follicle cycling. J. Invest. Dermatol. 135, 1501–1509 [DOI] [PubMed] [Google Scholar]
- 17. Hothorn T., Bretz F., and Westfall P. (2008) Simultaneous inference in general parametric models. Biom. J. 50, 346–363 [DOI] [PubMed] [Google Scholar]
- 18. Bates D., Maechler M., Bolker B. M., and Walker S. (2015) Fitting Linear Mixed-Effects Models Using lme4. J. Statistical Software 67, 1–48 [Google Scholar]
- 19. Holland W. L., Brozinick J. T., Wang L.-P., Hawkins E. D., Sargent K. M., Liu Y., Narra K., Hoehn K. L., Knotts T. A., Siesky A., Nelson D. H., Karathanasis S. K., Fontenot G. K., Birnbaum M. J., and Summers S. A. (2007) Inhibition of ceramide synthesis ameliorates glucocorticoid-, saturated-fat-, and obesity-induced insulin resistance. Cell Metab. 5, 167–179 [DOI] [PubMed] [Google Scholar]
- 20. Vandanmagsar B., Youm Y.-H., Ravussin A., Galgani J. E., Stadler K., Mynatt R. L., Ravussin E., Stephens J. M., and Dixit V. D. (2011) The NLRP3 inflammasome instigates obesity-induced inflammation and insulin resistance. Nat. Med. 17, 179–188 [DOI] [PMC free article] [PubMed] [Google Scholar]
- 21. Holland W. L., Bikman B. T., Wang L.-P., Yuguang G., Sargent K. M., Bulchand S., Knotts T. A., Shui G., Clegg D. J., Wenk M. R., Pagliassotti M. J., Scherer P. E., and Summers S. A. (2011) Lipid-induced insulin resistance mediated by the proinflammatory receptor TLR4 requires saturated fatty acid-induced ceramide biosynthesis in mice. J. Clin. Invest. 121, 1858–1870 [DOI] [PMC free article] [PubMed] [Google Scholar]
- 22. Chavez J. A., Knotts T. A., Wang L.-P., Li G., Dobrowsky R. T., Florant G. L., and Summers S. A. (2003) A role for ceramide, but not diacylglycerol, in the antagonism of insulin signal transduction by saturated fatty acids. J. Biol. Chem. 278, 10297–10303 [DOI] [PubMed] [Google Scholar]
- 23. Stratford S., Hoehn K. L., Liu F., and Summers S. A. (2004) Regulation of insulin action by ceramide: dual mechanisms linking ceramide accumulation to the inhibition of Akt/protein kinase B. J. Biol. Chem. 279, 36608–36615 [DOI] [PubMed] [Google Scholar]
- 24. Stratford S., DeWald D. B., and Summers S. A. (2001) Ceramide dissociates 3′-phosphoinositide production from pleckstrin homology domain translocation. Biochem. J. 354, 359–368 [DOI] [PMC free article] [PubMed] [Google Scholar]
- 25. Ussher J. R., Koves T. R., Cadete V. J., Zhang L., Jaswal J. S., Swyrd S. J., Lopaschuk D. G., Proctor S. D., Keung W., Muoio D. M., and Lopaschuk G. D. (2010) Inhibition of de novo ceramide synthesis reverses diet-induced insulin resistance and enhances whole-body oxygen consumption. Diabetes 59, 2453–2464 [DOI] [PMC free article] [PubMed] [Google Scholar]
- 26. Shi H., Kokoeva M. V., Inouye K., Tzameli I., Yin H., and Flier J. S. (2006) TLR4 links innate immunity and fatty acid-induced insulin resistance. J. Clin. Invest. 116, 3015–3025 [DOI] [PMC free article] [PubMed] [Google Scholar]
- 27. Wen H., Gris D., Lei Y., Jha S., Zhang L., Huang M. T., Brickey W. J., and Ting J. P. (2011) Fatty acid-induced NLRP3-ASC inflammasome activation interferes with insulin signaling. Nat. Immunol. 12, 408–415 [DOI] [PMC free article] [PubMed] [Google Scholar]
- 28. Vazquez A. I., Bates D. M., Rosa G. J., Gianola D., and Weigel K. A. (2010) Technical note: an R package for fitting generalized linear mixed models in animal breeding. J. Anim. Sci. 88, 497–504 [DOI] [PubMed] [Google Scholar]
- 29. Lahiri S., and Futerman A. H. (2005) LASS5 is a bona fide dihydroceramide synthase that selectively utilizes palmitoyl-CoA as acyl donor. J. Biol. Chem. 280, 33735–33738 [DOI] [PubMed] [Google Scholar]
- 30. Mesika A., Ben-Dor S., Laviad E. L., and Futerman A. H. (2007) A new functional motif in Hox domain-containing ceramide synthases: identification of a novel region flanking the Hox and TLC domains essential for activity. J. Biol. Chem. 282, 27366–27373 [DOI] [PubMed] [Google Scholar]
- 31. Tidhar R., Ben-Dor S., Wang E., Kelly S., Merrill A. H. Jr., and Futerman A. H. (2012) Acyl chain specificity of ceramide synthases is determined within a region of 150 residues in the Tram-Lag-CLN8 (TLC) domain. J. Biol. Chem. 287, 3197–3206 [DOI] [PMC free article] [PubMed] [Google Scholar]
- 32. Laviad E. L., Kelly S., Merrill A. H. Jr., and Futerman A. H. (2012) Modulation of ceramide synthase activity via dimerization. J. Biol. Chem. 287, 21025–21033 [DOI] [PMC free article] [PubMed] [Google Scholar]
- 33. Mullen T. D., Jenkins R. W., Clarke C. J., Bielawski J., Hannun Y. A., and Obeid L. M. (2011) Ceramide synthase-dependent ceramide generation and programmed cell death: involvement of salvage pathway in regulating postmitochondrial events. J. Biol. Chem. 286, 15929–15942 [DOI] [PMC free article] [PubMed] [Google Scholar]
- 34. Mesicek J., Lee H., Feldman T., Jiang X., Skobeleva A., Berdyshev E. V., Haimovitz-Friedman A., Fuks Z., and Kolesnick R. (2010) Ceramide synthases 2, 5, and 6 confer distinct roles in radiation-induced apoptosis in HeLa cells. Cell. Signal. 22, 1300–1307 [DOI] [PMC free article] [PubMed] [Google Scholar]
- 35. Magin T. M., McWhir J., and Melton D. W. (1992) A new mouse embryonic stem cell line with good germ line contribution and gene targeting frequency. Nucleic Acids Res. 20, 3795–3796 [DOI] [PMC free article] [PubMed] [Google Scholar]
- 36. Rodríguez C. I., Buchholz F., Galloway J., Sequerra R., Kasper J., Ayala R., Stewart A. F., and Dymecki S. M. (2000) High-efficiency deleter mice show that FLPe is an alternative to Cre-loxP. Nat. Genet. 25, 139–140 [DOI] [PubMed] [Google Scholar]
- 37. Gaebler A., Milan R., Straub L., Hoelper D., Kuerschner L., and Thiele C. (2013) Alkyne lipids as substrates for click chemistry-based in vitro enzymatic assays. J. Lipid Res. 54, 2282–2290 [DOI] [PMC free article] [PubMed] [Google Scholar]
- 38. Kim H. J., Qiao Q., Toop H. D., Morris J. C., and Don A. S. (2012) A fluorescent assay for ceramide synthase activity. J. Lipid Res. 53, 1701–1707 [DOI] [PMC free article] [PubMed] [Google Scholar]
- 39. Xia J. Y., Holland W. L., Kusminski C. M., Sun K., Sharma A. X., Pearson M. J., Sifuentes A. J., McDonald J. G., Gordillo R., and Scherer P. E. (2015) Targeted induction of ceramide degradation leads to improved systemic metabolism and reduced hepatic steatosis. Cell Metab. 22, 266–278 [DOI] [PMC free article] [PubMed] [Google Scholar]
- 40. Williams M. A., and McCluer R. H. (1980) The use of Sep-Pak C18 cartridges during the isolation of gangliosides. J. Neurochem. 35, 266–269 [DOI] [PubMed] [Google Scholar]
- 41. Bligh E. G., and Dyer W. J. (1959) A rapid method of total lipid extraction and purification. Can. J. Biochem. Physiol. 37, 911–917 [DOI] [PubMed] [Google Scholar]
- 42. Rinaldo P., Cowan T. M., and Matern D. (2008) Acylcarnitine profile analysis. Genet. Med. 10, 151–156 [DOI] [PubMed] [Google Scholar]
- 43. Markham J. E., and Jaworski J. G. (2007) Rapid measurement of sphingolipids from Arabidopsis thaliana by reversed-phase high-performance liquid chromatography coupled to electrospray ionization tandem mass spectrometry. Rapid Commun. Mass Spectrom. 21, 1304–1314 [DOI] [PubMed] [Google Scholar]
- 44. Haynes C. A., Allegood J. C., Sims K., Wang E. W., Sullards M. C., and Merrill A. H. (2008) Quantitation of fatty acyl-coenzyme As in mammalian cells by liquid chromatography-electrospray ionization tandem mass spectrometry. J. Lipid Res. 49, 1113–1125 [DOI] [PMC free article] [PubMed] [Google Scholar]
- 45. An J., Muoio D. M., Shiota M., Fujimoto Y., Cline G. W., Shulman G. I., Koves T. R., Stevens R., Millington D., and Newgard C. B. (2004) Hepatic expression of malonyl-CoA decarboxylase reverses muscle, liver and whole-animal insulin resistance. Nat. Med. 10, 268–274 [DOI] [PubMed] [Google Scholar]
- 46. Wewer V., Dombrink I., vom Dorp K., and Dörmann P. (2011) Quantification of sterol lipids in plants by quadrupole time-of-flight mass spectrometry. J. Lipid Res. 52, 1039–1054 [DOI] [PMC free article] [PubMed] [Google Scholar]
- 47. Welti R., Li W., Li M., Sang Y., Biesiada H., Zhou H.-E., Rajashekar C. B., Williams T. D., and Wang X. (2002) Profiling membrane lipids in plant stress responses. Role of phospholipase Dα in freezing-induced lipid changes in Arabidopsis. J. Biol. Chem. 277, 31994–32002 [DOI] [PubMed] [Google Scholar]
- 48. Gasulla F., Vom Dorp K., Dombrink I., Zähringer U., Gisch N., Dörmann P., and Bartels D. (2013) The role of lipid metabolism in the acquisition of desiccation tolerance in Craterostigma plantagineum: a comparative approach. Plant J. 75, 726–741 [DOI] [PubMed] [Google Scholar]
- 49. Xu Z., Zhou J., McCoy D. M., and Mallampalli R. K. (2005) LASS5 is the predominant ceramide synthase isoform involved in de novo sphingolipid synthesis in lung epithelia. J. Lipid Res. 46, 1229–1238 [DOI] [PubMed] [Google Scholar]
- 50. Chavez J. A., and Summers S. A. (2012) A ceramide-centric view of insulin resistance. Cell Metab. 15, 585–594 [DOI] [PubMed] [Google Scholar]
- 51. Shah C., Yang G., Lee I., Bielawski J., Hannun Y. A., and Samad F. (2008) Protection from high fat diet-induced increase in ceramide in mice lacking plasminogen activator inhibitor 1. J. Biol. Chem. 283, 13538–13548 [DOI] [PMC free article] [PubMed] [Google Scholar]
- 52. Postic C., and Girard J. (2008) Contribution of de novo fatty acid synthesis to hepatic steatosis and insulin resistance: lessons from genetically engineered mice. J. Clin. Invest. 118, 829–838 [DOI] [PMC free article] [PubMed] [Google Scholar]
- 53. Xu H., Barnes G. T., Yang Q., Tan G., Yang D., Chou C. J., Sole J., Nichols A., Ross J. S., Tartaglia L. A., and Chen H. (2003) Chronic inflammation in fat plays a crucial role in the development of obesity-related insulin resistance. J. Clin. Invest. 112, 1821–1830 [DOI] [PMC free article] [PubMed] [Google Scholar]
- 54. Odegaard J. I., Ricardo-Gonzalez R. R., Goforth M. H., Morel C. R., Subramanian V., Mukundan L., Red Eagle A., Vats D., Brombacher F., Ferrante A. W., and Chawla A. (2007) Macrophage-specific PPARγ controls alternative activation and improves insulin resistance. Nature 447, 1116–1120 [DOI] [PMC free article] [PubMed] [Google Scholar]
- 55. Pal D., Dasgupta S., Kundu R., Maitra S., Das G., Mukhopadhyay S., Ray S., Majumdar S. S., and Bhattacharya S. (2012) Fetuin-A acts as an endogenous ligand of TLR4 to promote lipid-induced insulin resistance. Nat. Med. 18, 1279–1285 [DOI] [PubMed] [Google Scholar]
- 56. Tordjman J., Chauvet G., Quette J., Beale E. G., Forest C., and Antoine B. (2003) Thiazolidinediones block fatty acid release by inducing glyceroneogenesis in fat cells. J. Biol. Chem. 278, 18785–18790 [DOI] [PubMed] [Google Scholar]
- 57. Lefterova M. I., Zhang Y., Steger D. J., Schupp M., Schug J., Cristancho A., Feng D., Zhuo D., Stoeckert C. J. Jr., Liu X. S., and Lazar M. A. (2008) PPARγ and C/EBP factors orchestrate adipocyte biology via adjacent binding on a genome-wide scale. Genes Dev. 22, 2941–2952 [DOI] [PMC free article] [PubMed] [Google Scholar]
- 58. Bensinger S. J., and Tontonoz P. (2008) Integration of metabolism and inflammation by lipid-activated nuclear receptors. Nature 454, 470–477 [DOI] [PubMed] [Google Scholar]
- 59. Senkal C. E., Ponnusamy S., Manevich Y., Meyers-Needham M., Saddoughi S. A., Mukhopadyay A., Dent P., Bielawski J., and Ogretmen B. (2011) Alteration of ceramide synthase 6/C16-ceramide induces activating transcription factor 6-mediated endoplasmic reticulum (ER) stress and apoptosis via perturbation of cellular Ca2+ and ER/Golgi membrane network. J. Biol. Chem. 286, 42446–42458 [DOI] [PMC free article] [PubMed] [Google Scholar]
- 60. Bruce C. R., Risis S., Babb J. R., Yang C., Kowalski G. M., Selathurai A., Lee-Young R. S., Weir J. M., Yoshioka K., Takuwa Y., Meikle P. J., Pitson S. M., and Febbraio M. A. (2012) Overexpression of sphingosine kinase 1 prevents ceramide accumulation and ameliorates muscle insulin resistance in high-fat diet-fed mice. Diabetes 61, 3148–3155 [DOI] [PMC free article] [PubMed] [Google Scholar]
- 61. Holland W. L., Miller R. A., Wang Z. V., Sun K., Barth B. M., Bui H. H., Davis K. E., Bikman B. T., Halberg N., Rutkowski J. M., Wade M. R., Tenorio V. M., Kuo M.-S., Brozinick J. T., Zhang B. B., Birnbaum M. J., Summers S. A., and Scherer P. E. (2011) Receptor-mediated activation of ceramidase activity initiates the pleiotropic actions of adiponectin. Nat. Med. 17, 55–63 [DOI] [PMC free article] [PubMed] [Google Scholar]
- 62. Holland W. L., Adams A. C., Brozinick J. T., Bui H. H., Miyauchi Y., Kusminski C. M., Bauer S. M., Wade M., Singhal E., Cheng C. C., Volk K., Kuo M.-S., Gordillo R., Kharitonenkov A., and Scherer P. E. (2013) An FGF21-adiponectin-ceramide axis controls energy expenditure and insulin action in mice. Cell Metab. 17, 790–797 [DOI] [PMC free article] [PubMed] [Google Scholar]
- 63. Chen J., Wang W., Qi Y., Kaczorowski D., McCaughan G. W., Gamble J. R., Don A. S., Gao X., Vadas M. A., and Xia P. (2016) Deletion of sphingosine kinase 1 ameliorates hepatic steatosis in diet-induced obese mice: Role of PPARγ. Biochim. Biophys. Acta 1861, 138–147 [DOI] [PubMed] [Google Scholar]
- 64. Bektas M., Allende M. L., Lee B. G., Chen W., Amar M. J., Remaley A. T., Saba J. D., and Proia R. L. (2010) Sphingosine 1-phosphate lyase deficiency disrupts lipid homeostasis in liver. J. Biol. Chem. 285, 10880–10889 [DOI] [PMC free article] [PubMed] [Google Scholar]
- 65. Bauer R., Voelzmann A., Breiden B., Schepers U., Farwanah H., Hahn I., Eckardt F., Sandhoff K., and Hoch M. (2009) Schlank, a member of the ceramide synthase family controls growth and body fat in Drosophila. EMBO J. 28, 3706–3716 [DOI] [PMC free article] [PubMed] [Google Scholar]
- 66. Russo S. B., Baicu C. F., Van Laer A., Geng T., Kasiganesan H., Zile M. R., and Cowart L. A. (2012) Ceramide synthase 5 mediates lipid-induced autophagy and hypertrophy in cardiomyocytes. J. Clin. Invest. 122, 3919–3930 [DOI] [PMC free article] [PubMed] [Google Scholar]
- 67. Zhang Y., Goldman S., Baerga R., Zhao Y., Komatsu M., and Jin S. (2009) Adipose-specific deletion of autophagy-related gene 7 (atg7) in mice reveals a role in adipogenesis. Proc. Natl. Acad. Sci. U.S.A. 106, 19860–19865 [DOI] [PMC free article] [PubMed] [Google Scholar]
- 68. Sentelle R. D., Senkal C. E., Jiang W., Ponnusamy S., Gencer S., Selvam S. P., Ramshesh V. K., Peterson Y. K., Lemasters J. J., Szulc Z. M., Bielawski J., and Ogretmen B. (2012) Ceramide targets autophagosomes to mitochondria and induces lethal mitophagy. Nat. Chem. Biol. 8, 831–838 [DOI] [PMC free article] [PubMed] [Google Scholar]
- 69. Koves T. R., Ussher J. R., Noland R. C., Slentz D., Mosedale M., Ilkayeva O., Bain J., Stevens R., Dyck J. R., Newgard C. B., Lopaschuk G. D., and Muoio D. M. (2008) Mitochondrial overload and incomplete fatty acid oxidation contribute to skeletal muscle insulin resistance. Cell Metab. 7, 45–56 [DOI] [PubMed] [Google Scholar]
- 70. Schiffmann S., Hartmann D., Fuchs S., Birod K., Ferreiròs N., Schreiber Y., Zivkovic A., Geisslinger G., Grösch S., and Stark H. (2012) Inhibitors of specific ceramide synthases. Biochimie 94, 558–565 [DOI] [PubMed] [Google Scholar]