Abstract
In this review, five graphical user interfaces (GUIs) used in radiation therapy practices and researches are introduced. They are: (1) the treatment time calculator, superficial X-ray treatment time calculator (SUPCALC) used in the superficial X-ray radiation therapy; (2) the monitor unit calculator, electron monitor unit calculator (EMUC) used in the electron radiation therapy; (3) the multileaf collimator machine file creator, sliding window intensity modulated radiotherapy (SWIMRT) used in generating fluence map for research and quality assurance in intensity modulated radiation therapy; (4) the treatment planning system, DOSCTP used in the calculation of 3D dose distribution using Monte Carlo simulation; and (5) the monitor unit calculator, photon beam monitor unit calculator (PMUC) used in photon beam radiation therapy. One common issue of these GUIs is that all user-friendly interfaces are linked to complex formulas and algorithms based on various theories, which do not have to be understood and noted by the user. In that case, user only needs to input the required information with help from graphical elements in order to produce desired results. SUPCALC is a superficial radiation treatment time calculator using the GUI technique to provide a convenient way for radiation therapist to calculate the treatment time, and keep a record for the skin cancer patient. EMUC is an electron monitor unit calculator for electron radiation therapy. Instead of doing hand calculation according to pre-determined dosimetric tables, clinical user needs only to input the required drawing of electron field in computer graphical file format, prescription dose, and beam parameters to EMUC to calculate the required monitor unit for the electron beam treatment. EMUC is based on a semi-experimental theory of sector-integration algorithm. SWIMRT is a multileaf collimator machine file creator to generate a fluence map produced by a medical linear accelerator. This machine file controls the multileaf collimator to deliver intensity modulated beams for a specific fluence map used in quality assurance or research. DOSCTP is a treatment planning system using the computed tomography images. Radiation beams (photon or electron) with different energies and field sizes produced by a linear accelerator can be placed in different positions to irradiate the tumour in the patient. DOSCTP is linked to a Monte Carlo simulation engine using the EGSnrc-based code, so that 3D dose distribution can be determined accurately for radiation therapy. Moreover, DOSCTP can be used for treatment planning of patient or small animal. PMUC is a GUI for calculation of the monitor unit based on the prescription dose of patient in photon beam radiation therapy. The calculation is based on dose corrections in changes of photon beam energy, treatment depth, field size, jaw position, beam axis, treatment distance and beam modifiers. All GUIs mentioned in this review were written either by the Microsoft Visual Basic.net or a MATLAB GUI development tool called GUIDE. In addition, all GUIs were verified and tested using measurements to ensure their accuracies were up to clinical acceptable levels for implementations.
Keywords: Graphical user interface, Cancer treatment, Treatment planning, Radiotherapy, Monitor unit calculation
Core tip: Computer graphical user interface (GUI) allows people to interact and control a device or job process without detailed knowledge of computer programming and related theory. Using the graphical windows, icons, buttons and visual indictor provided by the GUI, instead of giving computer commands in text that required specific training and understanding of the computer language, users can interact with the device or process through direct manipulation of graphical elements. This avoids a lot of unnecessary human errors and man-hours to fulfill a computer task, and makes calculations complete more systematic and well organized.
INTRODUCTION
In radiation therapy, some treatment and pre-treatment procedures such as calculation of treatment time or monitor unit (MU) for the kV or MV radiation machine, quality assurance test for radiation therapy, treatment planning with accurate dose calculation, and dosimetric correction due to patients’ internal organ motion and deformation, require complex theories and algorithms. Although nowadays the advance of computer technology allows the above tasks to be completed in a reasonable time, the clinical user needs to know computer programming and medical physics theory to interact with the computer. A computer graphical user interface (GUI) therefore helps radiation oncology staff such as radiation therapists, planners, oncologists and physicists to calculate and determine the required parameter values in radiation therapy without involving complex theory and algorithm.
Computer GUI contains graphical elements such as windows, scrolling bars, indicators and icons to assist the user to interact and control a device or process. Through direct manipulation of graphical elements, users do not need specific computer language on complex medical physics theory to complete a task in radiation therapy. This minimizes human error and man-hours in the treatment procedure and preparation. In this review, five GUIs developed mainly by the author’s group and used in radiation therapy are introduced: (1) The treatment time calculator, superficial X-ray treatment time calculator (SUPCALC) used to determine the treatment time based on the prescription dose for the superficial X-ray machine[1]; (2) The electron MU calculator, electron monitor unit calculator (EMUC), used to calculate the required MU for an electron radiation therapy using a medical linear accelerator (linac)[2]; (3) The sliding window intensity modulated radiotherapy (SWIMRT), a GUI to generate the mulitleaf collimator (MLC) machine file for a specific fluence map in intensity modulated radiation therapy (IMRT)[3]; (4) The treatment planning GUI, DOSCTP, equipped with a Monte Carlo simulation engine running the EGSnrc-based code[4]; and (5) The photon beam MU calculator, PMUC, used to calculate the MU from the prescription dose for photon beam radiation therapy. All GUIs were written either by the Microsoft Visual Basic.net or a MATLAB GUI development tool called GUIDE. All GUIs were tested by measurements, can be clinically implemented in a cancer center or hospital, and have been distributed to the public.
SUPCALC is a GUI of treatment time calculator providing a convenient platform for the radiation staff in superficial radiation therapy. This GUI has the following features: (1) A flexible, password-protected database; (2) An irregular cutout calculator to calculate the peak scattering factor (PSF) of an irregular field; (3) Simplified import of the irregular field image to the calculator; and (4) Patient treatment record printing as an electronic file or hardcopy. SUPCALC was adapted to the Gulmay D3150 superficial X-ray unit in this review. Dosimetric information such as PSF table was needed for each treatment energy. They were measured and input in to the database. The predicted and measured dose in the commissioning should be smaller than ± 2%. The GUI and “HELP” menu made it easy for the user to calculate the treatment time compared to using forms and tables. It also reduced training time and human error. Physicist can setup, input and delete treatment beam in the database, which is password protected. For the irregular lead cutout, an irregular field calculator routine is associated with the software to determine the PSF using sector-integration algorithm. The user only needs to prepare a JPEG file of the irregular field printout using a scanner and import such graphic file to the GUI to determine the PSF. The aim of the SUPCALC is to provide a convenient way for the user to calculate the treatment time and keep a record.
In electron radiotherapy, a GUI for MU calculation is preferred as a treatment plan quality assurance tool or clinical mark-up MU calculator, though MU can be calculated by most treatment planning systems (TPSs) based on various methods such as pencil-beam model[5], lateral build-up ratio[6], two-source model[7], and sector-integration[8].
EMUC is a GUI of electron MU calculator based on a new sector-integration algorithm to determine the relative output factor (ROF) of a treatment field. EMUC has four features: (1) Experimental data of ROF was mathematically fitted using the polynomial or exponential method so that ROF can be predicted more accurately; (2) A new sector-integration algorithm was introduced for measuring the irregular treatment field; (3) Optical scanner was used instead of the traditional film digitizer in the cutout image acquisition; and (4) Electronic file of the patient information, calculation parameters and results was produced as a record.
In photon radiotherapy, IMRT technique was employed to treat different cancer sites such as the head-and-neck[9], breast[10,11] and prostate[12,13]. IMRT involved a group of beam segments generated by a leaf sequencing method in the inverse treatment planning. The sliding window method[14-16] allows the MLC leaves to move when the beam is on. On the other hand, the step-and-shoot method[17-19] delivers the dose using individual beam segments with no leaf movement when the beam is on. In radiation dose delivery using the sliding window method, a group of beam segments with calculated dose-fraction order was transferred from the TPS to the linac console as a machine file, including information of the MLC positions in each beam fraction. SWIMRT is a computer GUI designed to study the MLC mechanical and dosimetric properties based on the sliding window technique. SWIMRT interacts with the machine file of the MLC and has the following features: (1) A convenient interface for the import of the fluence map; (2) An accurate MLC mechanical and dosimetric calibration; (3) Computer code (MATLAB) is easy to edit and update; (4) Simple image processing functions such as field trimming, region of interest cropping and selecting; and (5) Linked to a comprehensive database. In SWIMRT, the machine file can be generated only by importing a fluence map with a graphical file format. Film dosimetry was used to verify SWIMRT for both clinical and non-clinical fluence maps, and the GUI can be used to study the leaf sequencing algorithm and MLC dosimetry.
One goal in external beam treatment planning is to provide highly conformal dose coverage at the cancer target while sparing the surrounding critical tissues. In dose calculation of a treatment plan, Monte Carlo method is well known as a benchmark to predict accurate dose distribution in inhomogeneous media such as bone and lung[20-24]. The Monte Carlo dose calculation requires a patient’s CT image set (DICOM, RTOG or Pinnacle3 format) which can be converted to a 3D inhomogeneous phantom using the CTCREATE routine[25] in the EGSnrc-based Monte Carlo code.
DOSCTP is a simple treatment planning GUI using the EGSnrc Monte Carlo code as a dose calculation engine, and has the following features: (1) A comprehensive interface to convert the CT image set to a 3D DOSXYZnrc phantom; (2) Contouring the regional of interest in the transverse, sagittal and coronal display; (3) Database for the custom beam phase space files based on the BEAMnrc[26,27]; (4) Linked to the DOSXYZnrc code for simulation; and (5) Display of the contour and calculated dose for plan evaluation.
In the clinical radiation treatment process, the prescribed dose at the tumour target volume is delivered in terms of a certain number of MU by the linac. Such MU is measured by an internal ionization chamber inside the head of the gantry of the accelerator. Absolute dose calibration sets up a well-defined dose rate (cGy/MU) at a well-defined location inside a water phantom. The number of MU delivered to the target volume is therefore calculated by a simple equation, MU = Prescribed dose/dose rate. However, this equation is only true when the dose is prescribed in a water tank in exactly the same beam setup geometry used for the absolute dose calibration. This is obviously not right in a typical clinical treatment situation because: (1) The target volume may be at different treatment depth in the patient; (2) The field size may not be the one used in absolute calibration and may be irregular; (3) Block or MLC may be used during the treatment; (4) The dose may be prescribed off from the central beam axis; (5) Physical and/or dynamic wedge may be used during the treatment; (6) Compensator and different types of tray may be inserted between the gantry head and the patient; and (7) The source to the target distance may be changed from 100 cm, which is the typical source-to-axis distance (SAD) in radiation therapy. In view of the above variations during the treatment set up, the above equation should be modified to calculate the correct MU for the prescription dose. This modification/correction can be done by applying different correction factors and dose ratios in the equation. The MU can therefore be calculated by using a more detailed formula. PMUC is a GUI of MU calculator for clinical radiation treatment using MV photon beams.
ALGORITHMS
In this review, all GUIs were written either by the Microsoft Visual Basic.net or a MATLAB GUI development tool called GUIDE. In addition, all GUIs were verified and tested by dosimetric measurements to ensure their accuracies were up to the clinical acceptable levels for implementations.
SUPCALC
The superficial X-ray treatment time calculator is based on the following equation:
DRcmuscle = [M/(t-a)] × Nx × Pion × FTP × PSF × fmuscle × ISL × OF (1)
Where DRcmuscle = Absolute calibrated dose rate of muscle at source-to-surface distance (SSD) = 15 cm, M = electrometer reading, t = treatment time, a = shutter error, Nx = NRC calibration constant, Pion = coefficient corrects for ionization recombination losses, FTP = (760/P) × [(273 + T)/295], PSF = Peak scattering factor, fmuscle = f factor for muscle, ISL = inverse square law, and OF = output factor measured in air. From Eq. 1, we can write:
Dose in muscle = M × Nx × Pion × FTP × fmuscle × ISL × OF (2)
To calculate the treatment time, it is noted that when the cone size is changed, both the PSF and OF are changed. When the SSD is changed, ISL should be applied to modify the DRcmuscle. Since the OF depends on cone size and PSF depends on lead cutouts, the treatment dose rate, DRtmuscle can be written as:
DRtmuscle = DRcmuscle × [PSF(CS)/PSF(5)] × OF × [SSD2/(SSD + airgap)2] (3)
For example, using Eq. 3, if the cone size (diameter) = 5 cm, then OF = 1 and PSF(5)/PSF(5) =1 (because 5 cm cone is used for the absolute calibration). If the distance between the cone and patient = 0 cm, with our calibration SSD = 15 cm and air gap = 0 cm, Eq. 3 becomes: DRtmuscle = DRcmuscle. In superficial X-ray treatment, irregular cutout field is commonly used to conform to the surface lesion. When the cutout field is irregular, the PSF would be difficult to determine as the field has a variation of radii starting from the center of the field (point P) as shown in Figure 1. Clarkson Integral is therefore employed to solve this problem. According to the Integral, the PSF is calculated using the following equation:
Figure 1.
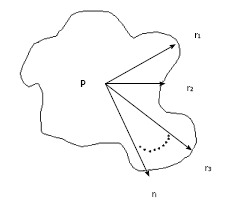
Sector-integration of irregular field.
Math 18
Math 18.

Math(A1).
(4)
Where n is the angle between two radii, ri and ri-1, ri is the radius from the point P in the cutout field as shown in Figure 1. Basically, n is selected to be 36 and therefore the angle between two radii is 10o in the calculator. Eq. 4 calculated PSF(r) for a particular energy and such value would be input to Eq. 3 for the treatment time calculation.
EMUC
EMUC predicts the electron MU using the effective SSD technique[28-30]:
MU = (Dose/fraction)/{D0 × C × (IDL/100) × ROF × [(SSDeff + d0)/(SSDeff + d0 + g)]2} (5)
In Eq. 5, Do is the dose calibrated as 1 cGy/MU at the SSD = 100 cm and depth of reference (dref) using the AAPM TG-51 protocol[31]. C is the correction factor between the dref (used in planning) and depth of maximum dose (dm). IDL is the isodose line in the treatment plan. d0 is the depth of treatment and SSDeff is the effective SSD. g is the air gap between the regular and treatment SSD. It should be noted that ROF varies with the applicator size, shape of cutout and beam energy. In Eq. 5, IDL = 1 when the treatment SSD = 100 cm. It is because g = 0 in such geometry.
A sector-integration formula was used to calculate the ROF as a function of treatment field:
Math 19
Math 19.

Math(A1).
(6)
In Eq. 6, the angular segment number (n) divides the treatment field into 360o/n segments. The ROF of circular field, with radius equal to the distance between the edge of each angular segment and the central beam axis, is equal to ROFi. A predetermined ROF database as a function of field sizes, beam energies and applicator sizes was set up according to Eq. 6. In this review, the database contains electron beam energies of 4, 6, 9, 12 and 16 MeV, and applicator sizes of 5 cm × 5 cm, 10 cm × 10 cm, 15 cm × 15 cm, 20 cm × 20 cm and 25 cm × 25 cm. When the treatment field is a square or rectangle, sector-integration is not needed. The ROF is therefore calculated using the following expression[32]:
Math 20
Math 20.

Math(A1).
(7)
Where ROF(X,X) and ROF(Y,Y) are ROFs of square cutouts, and ROF(X,Y) is the ROF of a rectangular cutout (side lengths = X and Y).
SWIMRT
SWIMRT uses a leaf sequencing algorithm[25,33,34] to convert a matrix of dose values into exposure times based on dose rate. The conversion function is written as:
Exposure time = Dose/Doserate (8)
Eq. 8 can be modified to Eq. 9 by considering corrections to the dose map such as MLC leaf leakages.
Exposure time = [Dose-f(Dose)]/Doserate (9)
In Eq. 9, the dose correction is expressed as f(Dose). For a leaf pair profile, the first leaf movement results in an exposure until the second leaf reaches the same position. Therefore, both the sampled arrays of the first and second leaf exposure should be determined by the algorithm. One simple way to start the calculation is to assign the first leaf array the desired exposure times and the second leaf array zero times. However, this leads to the second leaf requiring infinite velocity to catch up with the first leaf. To solve this problem, the portion of arrays is allowed to be interchanged between the two leaves as shown in Figure 2[3]. Figure 2A gives an example of a leaf pair profile with Figure 2B showing the reversed roles of leaf A and leaf B. It is seen in Figure 2 that there is still the same problem with leaf A, and vice versa. Therefore, the roles of leaves can be reversed again from the mid-position as shown in Figure 3[3].
Figure 2.
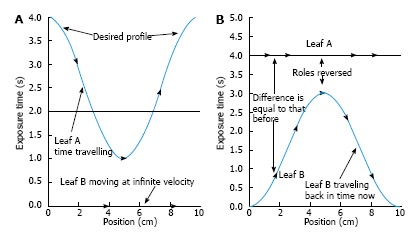
The portion of arrays is allowed to be interchanged between the two leaves as shown. A: An example of a leaf pair exposure-time profile; B: The first half of the profile is made realizable by reversing the roles of leaf A and leaf B.
Figure 3.
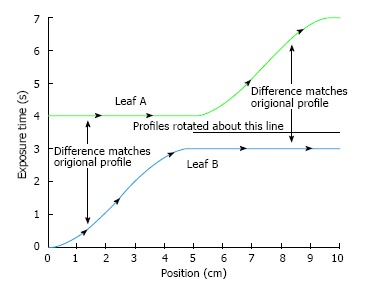
The roles of leaf A and leaf B are reversed again after the mid position.
The issue of infinite velocity can be solved by skewing the profiles as per the maximum velocity of leaves. A linear function is added:
f(d) = (1/Maximum Velocity) d (10)
Where d is the leaf position. Figure 4 shows the profile using the maximum leaf velocity of 2.5 cm/s with both MLC leaves skewed to remove large velocities. Eq. 10 was used through each leaf pair profile[3].
Figure 4.
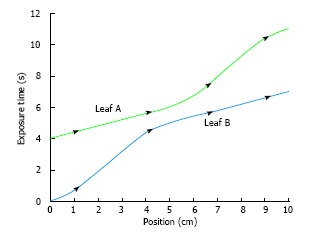
Profiles for both leaves are skewed to eliminate large velocities.
The machine file is generated by changing the arrays from spatial to time samples. Since it is unlikely that the time samples will occur at extract times inside the matrix, averaging time is used here. For example, the leaf in the array moves from positions 3 mm to 4 mm with times 1.95 s and 2.15 s, respectively. The leaf position of 2 s (i.e., 2.15 s - 1.95 s) can be calculated as:
d = startDist + (endDist - startDist) × [(value - startTime)/(endTime - startTime)] = 3 + (4 - 3) × [(2 - 1.95)/(2.15 - 1.95)] (11)
In Eq. 11, startTime (before) and endTime (after) are times found from the array elements. Similarly, startDist (before) and endDist (after) are the corresponding distances. The function searches the zero dose in the profile at the beginning and/or in the end. When the leaf pair satisfy this criteria, the leaves are set to stop. Once all details of leaf pair profiles are determined, the MLC machine file was generated by SWIMRT.
DOSCTP
The flow chart of DOSCTP is shown in Figure 5[4]. The GUI includes four components including the “Treatment Planning”, “Monte Carlo Simulation with DOSXYZnrc”, “Dose Visualization” and “Export”. First, the user imports a CT image set with DICOM format using the “Treatment Planning” block. A plan is then created with definition of isocenter position, contouring and beam placement. The user can edit the converted 3D inhomogeneous phantom and go to the “Monte Carlo Simulation with DOSXYZnrc” block. A set of DOSXYZnrc simulation parameters is needed to input for Monte Carlo simulation. When the Monte Carlo set up is done, DOSCTP automatically generates input file(s) for each beam in simulations. Result of Monte Carlo simulation can then be viewed using the “Dose Visualization” block which displays the isodose lines with the CT image set. The user can also carry out dose normalization at different positions. In the “Export” block, all plan information can be exported to an electronic file in DICOM format for commercial TPSs.
Figure 5.
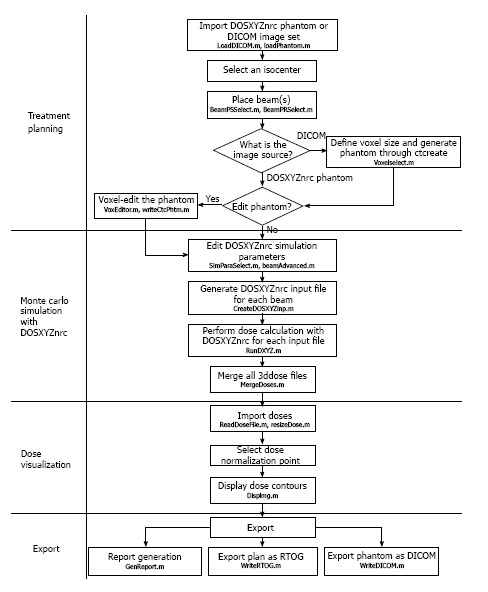
Block diagram showing the flowchart with main components of DOSCTP.
PMUC
In PMUC, if the prescription depth is different from that in the absolute calibration condition, a depth correction is carried out from the absolute dose calibration point. Typically, the absolute calibrated dose rate (Dcal) = 1 cGy/MU and it is set at the beam geometry mentioned above. To obtain the dose rate at another water depth from 5 cm with the same field size (FS), Tissue Maximum Ratio (TMR) is employed in the conversion. The new dose rate (Dpt1) in a depth of d cm from the water surface can be calculated as:
Dpt1 = Dcal × [TMR (10 × 10, d cm)/TMR (10 × 10, 5 cm)] (12)
This is the dose rate by changing the depth only, while keeping the FS the same as in the absolute dose calibration (10 cm × 10 cm). If the FS of the beam is also changed either by applying block or MLC, PSF is used to fulfill such correction. Eq. 12 is therefore modified as:
Dpt1 = Dcal × [TMR (10 × 10, d cm)/TMR (10 × 10, 5 cm)] × [PSF (FS)/PSF (10 × 10)] (13)
In Eq. 13, the new FS is rescaled using the PSF ratio, where 10 cm × 10 cm is the FS used in the absolute dose calibration. A term Phantom Scattering (PS) Factor based on Eq. 13 is defined as:
PS = [TMR (10 × 10, d cm)/TMR (10 × 10, 5 cm)] × [PSF (FS)/PSF (10 × 10)] (14)
So that,
Dpt1 = Dcal × PS (15)
On the other hand, changing the jaw position varies the dose at the central axis with the same water depth. This change is mainly contributed by the beam scattered from the jaws. Therefore, such change (whether the jaw position is symmetric or asymmetric) has to be noted and measured in advances, so that correction can be made when the jaw setting is no longer FS = 10 cm × 10 cm. The Collimator Scattering (CS) Factor is hence defined as:
CS = [Dair (X,Y; dm)]/[Dair (10 × 10; dm)] (16)
X and Y are the X and Y jaw position, and dm is the depth of the maximum dose of particular photon beam energy (e.g., 6/15 MV). Dair is the dose measured in air. Eq. 16 can be combined to Eq. 15 so that:
Dpt2 = Dcal × PS × CS (17)
Dpt2 is the dose rate after corrections of the treatment depth, field size and jaw position.
In some radiation treatments, due to the application of the asymmetric jaw and half beam block, the dose is prescribed away from the central beam axis. This is because the absolute dose calibration is done at the central axis with symmetry of the beam profile; a correction is needed for the off-axis dose point by considering various flatness and symmetry along the horizontal beam profile. An Off-Axis Ratio (OAR) is therefore defined as:
OAR (x, d) = (Dose at the Central Axis in depth d)/(Dose away from the Central Axis at a distance x in the same depth d) (18)
This ratio should be multiplied in the right hand side of Eq. 17 in order to obtain the corrected MU.
In some radiation treatments, it is usual to put beam modifiers such as compensator, wedge (physical or dynamic) and tray between the beam source and the patient surface to achieve an appreciate dose distribution in the target volume. However, the treatment beam is unavoidably attenuated by the presence of modifier, resulting in more MU should be given in the irradiation. The attenuation factors of wedge (wedge factor, WF), compensator (compensator factor, CF) and tray (tray factor, TF) have to be multiplied to the right hand side of Eq. 17. When the source to treatment point distance (SPD) is different from 1 m, the beam reaching the target volume is stronger or weaker due to the distance decreasing or increasing from the absolute dose calibration setting, respectively. The change of dose can be corrected by applying the inverse square law (ISL = 1/SPD2), and this factor should be put in the right hand side of Eq. 17.
To sum up, the final equation in MU calculation is:
MU = (Prescribed Dose)/(Dcal × CS × PS × OAR × WF × TF × CF ×ISL) (19)
This equation is used in PMUC.
In addition, PMUC uses an improved interpolation algorism for obtaining the PS value among the points in the database. In PMUC, bi-linear interpolation algorism was selected to deal with interpolation values within the database, while Spine interpolation algorism was selected to deal with values outside or on the edge of the database. It is found that by using these combinations, the interpolated PS value was more accurate than that being done by other algorithms like inverse-square interpolation.
APPLICATIONS
SUPCALC
SUPCALC provides a front-end window interface, and a detailed “help” menu to provide the basic operational instruction as shown in Figure 6. Users can input the patient information in the upper part of the window, and treatment beam parameters in the bottom. The beam parameters include kV X-ray energy, treatment cone diameter, distance between the cone to the patient surface, prescribed dose and cutout (treatment field) diameter. A flexible, password-protected database of the calculator to add or delete beam energy for the machine is shown in Figure 7. Figure 7A shows the database is password protected so that only the authorized person such as a medical physicist can change the content. Figure 7B shows the PSFs for different cutout diameter. These factors were determined by dosimetric measurements. An irregular cutout calculator to predict the PSF of an irregular field is shown in Figure 8. It should be noted that the import of the irregular cutout field image is simplified by using only a commercial optical scanner. Finally, patient treatment record printing and transferred to a database are possible as shown in Figure 9.
Figure 6.
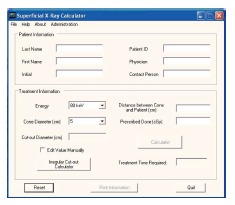
Front end window of superficial X-ray treatment time calculator.
Figure 7.
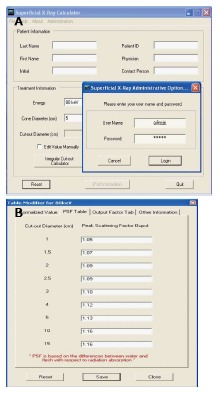
Password protected database (A) and comprehensive database (B).
Figure 8.
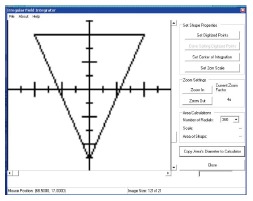
Irregular field calculator.
Figure 9.
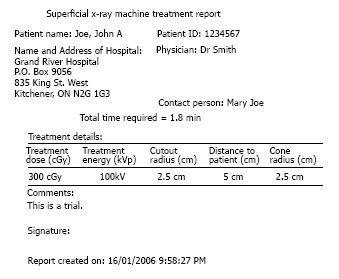
Record printout (hardcopy or electronic).
EMUC
The front-end window of EMUC (Figure 10) provides an user-friendly interface to input the related treatment parameters such as electron beam energy, IDL, SSD, applicator size and prescribed dose for MU calculation[2].
Figure 10.
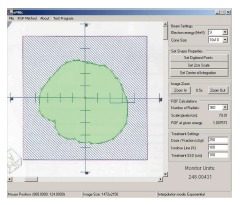
The front-end window of electron monitor unit calculator showing the imported irregular electron field image in the left hand side and the patient treatment parameters in the right hand side.
A novel sector-integration algorithm was used in EMUC. This algorithm rotates the irregular field with the positive x-axis as a static vector instead of rotating a vector from the central field axis to the field edge[35]. The radius of each angular segment (ri) is therefore measured with the whole field rotated 360o. Moreover, taking advantage of the fast computing speed, the number of angular segments can be increased to 360 compared to 36 or less used in previous works[35-37]. This can help to increase the accuracy when calculating electron MU for a highly irregular field. A Microsoft Access database was used to store the integration parameters. The database included parameters in Eq. 4 such as C, dm, dref and SSDeff. The database also stored the ROFs vs radii of circular fields and the ROFs for different square and rectangular sizes in Figure 11[2].
Figure 11.
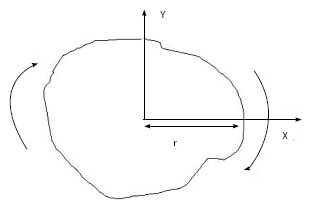
Schematic diagram showing the algorithm to acquire the radius in each divided angular segment in the irregular field. Instead of rotating the vectors from the central axis towards the field edge, the whole field is rotated cutting through the positive X-axis.
SWIMRT
The fluence map or picture can be imported or created using SWIMRT as shown in Figure 12[3]. To create a fluence map, a gird of specified “X size” and “Y size” can be generated using the “Create New Grid” button. Figure 13 shows the “SWIMRTgridder” editor to modify and change every beam intensity element in the grid[3]. The fluence map can also be rotated using the “Rotate Image” button at the lower left hand corner in Figure 12.
Figure 12.
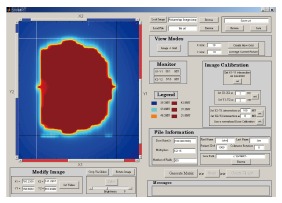
Front-end window of sliding window intensity modulated radiotherapy.
Figure 13.
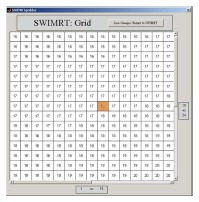
The editable image grid under the subroutine “SWIMRTgridder”.
DOSCTP
The CT images are displayed in the viewing windows of DOSCTP as shown in Figure 14[4]. The beam configuration is managed by a panel on the top left of the GUI. The user can call the phase space beams (P.S. Beam) pre-generated using the BEAMnrc code from the library or monoenergetic parallel beams (P.R. beam) which does not require pre-calculations. The contour panel is located in the middle left of the GUI to add and edit contour for the region of interest. The isocenter is defined by the isocenter panel at the bottom left of the GUI, and a tool panel is used to navigate the CT images. The “1. Export to Ctcreate”, “2. Edit Phantom”, “3. Export to DOSXYZ” and “4. Import Dose” are four buttons near the bottom of the GUI. These buttons control the dose calculation using the DOSXYZnrc when activated in numbered sequence.
Figure 14.
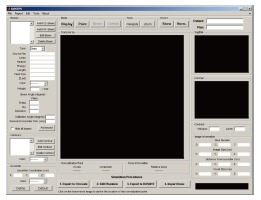
The front-end window of DOSCTP.
PMUC
The front-end window of PMUC is shown in Figure 15. The user (therapist, dosimetrist and physicist) just needs to input all beam treatment setup and correction factor options such as beam energy, field size, treatment depth, OAR, selection of wedge (physical or dynamic) and so on. When the “Calculate” button is pressed, the MU calculation starts, and the result with those input parameters are shown.
Figure 15.
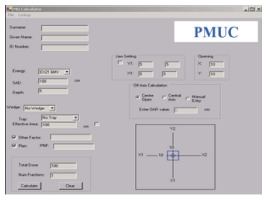
The front-end window of photon beam monitor unit calculator.
This MU calculator can build up a full treatment patient MU calculation record and store it to a database. Each patient to be treated has his/her own file of information according to his/her name and patient ID number. The MU calculated from each beam setting was kept within that patient file created by the user. Furthermore, the calculated MU with the input parameters can be printed out both electronically and from a printer. The electronic printout is a graphic file being kept in the Varis Document of the patient database for reference and quality assurance. The hardcopy of the MU record was used as a back-up only.
VALIDATIONS AND IMPLEMENTATIONS
SUPCALC
A superficial X-ray unit (D3150, Gulmay Medical Ltd.), which can produce X-rays from 100 to 150 kVp over a range of mA (0-30 mA), was taken as an example here to demonstrate the implementation (Figures 6-9). However, due to the convenience of the comprehensive database, other superficial units can be adapted to the SUPCALC. Radiation oncologist and physicist can decide which energies should be commissioned and used. The dosimetric information of particular beam energy is easy to store, modify and delete in the database. Physicist only needs to input the specified dosimetric tables such as PSF and OF to the database, and verification can then be done in the commissioning. The predicted and measured dose should be smaller than ± 2%. Since GUI was used and the software had a “help” menu, radiation therapist and dosimetrist would find it easy to use. The training time is therefore greatly reduced.
EMUC
EMUC is verified by comparison between predicted and measured doses for different beam energies, applicators, interpolation methods and SSDs (Table 1)[2]. In the GUI verification, 100 MU were used for an irregular field with dose at dm. Farmer-type ionization chamber was used in experimental dosimetry while very small fields were measured using radiographic film. From Table 1, percentage deviations between the predicted and measured doses are within ± 2%, which are acceptable.
Table 1.
A comparison of predicted doses based on the calculated electron monitor unit by electron monitor unit calculator and measured doses for irregular fields at different electron beam energies, applicators, interpolation methods and source-to-surface distances
| Energy (MeV) | Applicator (cm × cm) | SSD (cm) | Measured dose (cGy) | Predicted dose (Poly) (cGy) | Percentage difference (%) | Predicted dose (Exp) (cGy) | Percentage difference (%) |
| 4 | 10 × 10 | 100 | 100.5 | 101.5 | 1.04 | 102.3 | 1.83 |
| 4 | 15 × 15 | 100 | 102.0 | 103.8 | 1.79 | 103.8 | 1.79 |
| 6 | 10 × 10 | 100 | 100.3 | 101.5 | 1.16 | 101.5 | 1.16 |
| 6 | 15 × 15 | 100 | 100.7 | 101.8 | 1.08 | 101.5 | 0.78 |
| 6 | 15 × 15 | 105 | 90.5 | 91.5 | 1.12 | 91.2 | 0.78 |
| 6 | 15 × 15 | 110 | 81.4 | 82.7 | 1.58 | 82.4 | 1.22 |
| 9 | 10 × 10 | 100 | 100.2 | 101 | 0.79 | 100.8 | 0.59 |
| 9 | 10 × 10 | 105 | 89.5 | 90.8 | 1.44 | 90.6 | 1.22 |
| 9 | 15 × 15 | 100 | 100.2 | 101 | 0.92 | 100.5 | 0.32 |
| 9 | 15 × 15 | 105 | 89.8 | 90.9 | 1.18 | 90.3 | 0.51 |
| 9 | 15 × 15 | 110 | 80.8 | 81.7 | 1.01 | 81.7 | 1.01 |
| 12 | 10 × 10 | 100 | 98.7 | 98.6 | -0.11 | 98.8 | 0.06 |
| 12 | 10 × 10 | 105 | 88.0 | 88.7 | 0.85 | 88.9 | 1.03 |
| 12 | 10 × 10 | 110 | 79.2 | 80.3 | 1.29 | 80.4 | 1.46 |
| 12 | 15 × 15 | 100 | 100.1 | 100.7 | 0.56 | 99.8 | -0.29 |
| 12 | 15 × 15 | 105 | 89.8 | 90.6 | 0.86 | 89.8 | -0.03 |
| 16 | 10 × 10 | 100 | 97.6 | 98.4 | 0.78 | 98.6 | 0.99 |
| 16 | 10 × 10 | 105 | 87.3 | 88.6 | 1.50 | 88.8 | 1.7 |
| 16 | 10 × 10 | 110 | 79.1 | 80.2 | 1.35 | 80.3 | 1.55 |
| 16 | 15 × 15 | 100 | 99.7 | 100.7 | 0.96 | 99.9 | 0.11 |
| 16 | 15 × 15 | 105 | 89.5 | 90.7 | 1.32 | 89.9 | 0.42 |
| 16 | 15 × 15 | 110 | 80.8 | 81.4 | 0.69 | 81.35 | 0.69 |
SSD: Source-to-surface distance.
SWIMRT
SWIMRT was verified using a clinical fluence map from a prostate patient. The treatment plan was generated using a five-beam IMRT technique. The 6 MV photon beams were used in the treatment. Fluence map of an anterior-posterior beam segment is shown in Figure 16A[3]. The fluence map was exposed on a radiographic film with related machine file generated by SWIMRT. Beam profiles of broken lines in Figure 16 were measured as shown in Figure 16B-E. It can be seen in Figure 16B-E that profiles generated by the step-and-shoot and sliding window algorithm agree well with each other. The small deviation of less than 5% may be due to the uncertainty of the MLC mechanical instability or film dosimetry.
Figure 16.
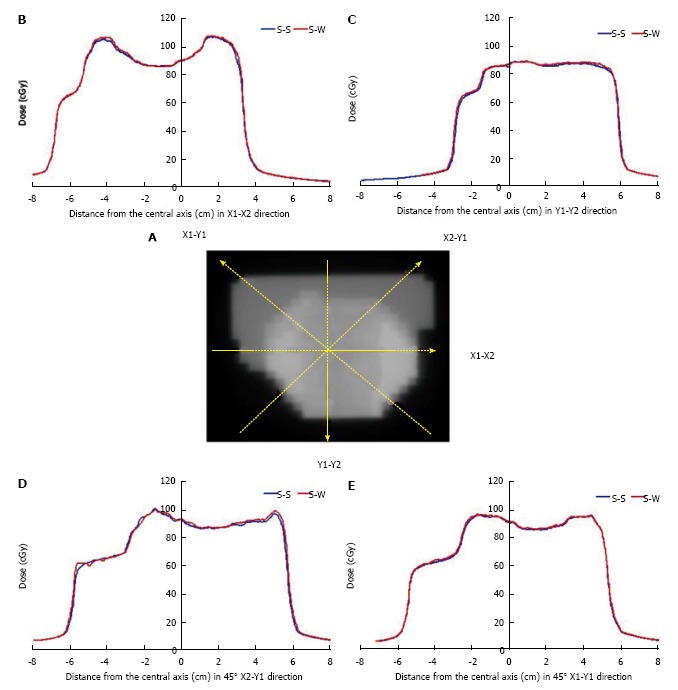
Fluence map of an anterior-posterior beam segment. A: Fluence map for an anterior-posterior segmental beam for the prostate IMRT; B-F: The broken lines represent the beam profiles measured at the X1-X2 (B), Y1-Y2 (C), 45° X2-Y1 (D) and 45° X1-Y1 (E) direction. The blue curve is the profile using the step-and-shoot algorithm (S-S), while the red curve is the profile using the sliding window (S-W) algorithm from Pinnacle3 and SWIMRT respectively.
DOSCTP
A comparison of dose distributions from different plans performed by DOSCTP and Pinnacle3 was carried out. The goal is to demonstrate the ability of DOSCTP to produce the same plan as Pinnacle3, and also act as a platform for comparing dose calculation algorithms from external TPSs against Monte Carlo simulation. Figure 17A and B display plans produced by DOSCTP and Pinnacle3, respectively[4]. All dose calculations have been performed with the Collapsed Cone Convolution algorithm in Pinnacle3[38]. For Monte Carlo simulations, 2 billion histories were used for each plan.
Figure 17.
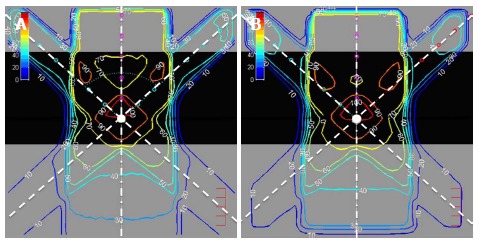
Two dimensional dose distributions of an inhomogeneous solid phantom with lung slab of 0.5 g/cm3 irradiated by three 6 MV photon beams calculated using DOSCTP (A) and Pinnacle3 (B).
The phantom used in the plan is an inhomogeneous solid phantom with a 0.5 g/cm3 lung slab of 10 cm thickness located between 5 and 15 cm blocks of water. The isocenter is located at a depth of 12.25 cm in the center of the phantom. Three 6 MV photon beams were used in the plan. They were modeled according to the Varian 21 EX linac in the BEAMnrc. In Pinnacle3, this was a commissioned built-in source. Beam 1, at zero gantry angle as shown in Figure 17, had a field size of 10 cm × 10 cm, and was assigned a weight of 50%. Beams 2 and 3, with gantry angles of 330o and 30o as shown in Figure 17, respectively, had a field size of 4 cm × 4 cm, each assigned a weight of 25%. This plan demonstrates the ability of DOSCTP to perform multi-beam planning using the DOSXYZnrc code. It can be seen from the figures that DOSCTP is able to produce a plan with similar beam setup and geometry compared to Pinnacle3. Although the dose distributions are not identical due to the different dose calculation algorithms, the dosimetric comparison shows that DOSCTP can perform well for simple treatment planning.
PMUC
The PMUC was tested with the TTC2000 used in the London Regional Cancer Program (LRCP), London, Canada. The reason is that though the two in-house calculators use different interpolation methods to calculate the MU, they use the same concept in the MU calculation. However, only 6 MV photon beam could be verified because LRCP does not have the 15 MV photon beam information. In this energy, Pinnacle3 MU calculator with a disabled inhomogeneous correction function was used in the verification.
In the first phase of the test, the same dose ratio and correction factor database of TTC2000 was used by PMUC. In this situation, both of them should give very close calculated MU values because the only difference between the two calculators is the interpolation method. After passing this test, measured PS and CS tables for the 6 MV photon beams were compared to those of TTC2000. The reason is that the structure of the Varian 21C/D linac used in LRCP for TTC2000 is very similar to the Varian 21 EX linac for PMUC. Under the same 6 MV photon beam energy, the PS and CS tables of TTC2000 were very close to PMUC within ± 1%.
CONCLUSION
SUPCALC provides a convenient way for the user to calculate the treatment time and keep record. The database is password protected and it is easy to add or delete treatment beams with the commissioning data. Commissioning of SUPCALC is needed to ensure that the difference between the predicted and prescribed dose is less than ± 2%. It is concluded that SUPCALC can reduce the man-hours and increase the efficiency in the superficial X-ray treatment.
EMUC is developed using a novel sector-integration algorithm for determining the radius of each angular segment in an irregular treatment field. The GUI also used exponential curve fitting method for more accurate data interpolation. Verification results showed that the deviation between the predicted and measured MU is within ± 2%. It is therefore concluded that electron MU calculation can be carried out accurately and effectively using EMUC in electron radiotherapy.
SWIMRT is developed based on the sliding window algorithm. A machine file controlling the MLC console in the linac can be generated by SWIMRT with an import of a fluence map. Sources of the fluence map can be from the TPS or the user. SWIMRT provides a fluence map editor so that the user can edit the imported beam intensity matrix pixel by pixel. The GUI was verified by comparing the fluence maps generated by the TPS using the film dosimetry.
DOSCTP is developed for radiation treatment planning. It is an implementation of Monte Carlo TPS that utilizes the EGSnrc and DOSXYZnrc code to simulate photon and electron transport in a Cartesian volume. Both CT DICOM image datasets and user-created phantoms are supported. DOSCTP provides a GUI to manage the CT image set for the DOSXYZnrc and CTCREATE with a number of features. The GUI can perform Monte Carlo dose calculation for multiple-beam plan. Moreover, the converted 3D Monte Carlo phantom can be edited before simulation. The edited CT image set is compatible to commercial TPSs or CERR[39].
PMUC uses some novel techniques such as a more advanced data interpolation algorism, patient registration system and physical wedge orientation interlock. The dose ratio and correction factor required for the calculation were measured. The accuracy of the calculator was verified, and it gave the calculated MU within ± 1% error range compared to the measurement. It should be noted that as the database of the calculator is based on water tank measurement, PMUC should not be used to calculate MU in inhomogeneous system. However, it is designed for emergency radiation treatment and rough routine MU quality assurance test for the treatment planning.
ACKNOWLEDGMENTS
The author would like to thank Sam Leung, Dr. Grigor Grigorov, Christopher MacGregor, Nuri Yazdani, Michael Leung, Walter Bawa and Jeannie Fung for assisting in these studies. Special thanks to Dr. Rob Barnett and Dr. Ernest Osei of Grand River Hospital, and Dr. David Jaffray of Princess Margaret Cancer Center to support these GUI projects.
Footnotes
Conflict-of-interest statement: Author declares no conflict of interests for this article.
Open-Access: This article is an open-access article which was selected by an in-house editor and fully peer-reviewed by external reviewers. It is distributed in accordance with the Creative Commons Attribution Non Commercial (CC BY-NC 4.0) license, which permits others to distribute, remix, adapt, build upon this work non-commercially, and license their derivative works on different terms, provided the original work is properly cited and the use is non-commercial. See: http://creativecommons.org/licenses/by-nc/4.0/
Peer-review started: September 8, 2015
First decision: November 3, 2015
Article in press: January 7, 2016
P- Reviewer: Cerwenka HR, Chen F, Furka A S- Editor: Qiu S L- Editor: A E- Editor: Lu YJ
References
- 1.Chow JCL, Leung S. A graphical user interface for a superficial x-ray treatment time calculator. Med Phys. 2006;33:2054. [Google Scholar]
- 2.Chow JC, Grigorov GN, MacGregor C. A graphical user interface for an electron monitor unit calculator using a sector-integration algorithm and exponential curve-fitting method. J Appl Clin Med Phys. 2006;7:52–64. doi: 10.1120/jacmp.v7i1.2183. [DOI] [PMC free article] [PubMed] [Google Scholar]
- 3.Chow JC, Grigorov GN, Yazdani N. SWIMRT: a graphical user interface using sliding window algorithm to construct a fluence map machine file. J Appl Clin Med Phys. 2006;7:69–85. doi: 10.1120/jacmp.v7i2.2231. [DOI] [PMC free article] [PubMed] [Google Scholar]
- 4.Chow JC, Leung MK. Treatment planning for a small animal using Monte Carlo simulation. Med Phys. 2007;34:4810–4817. doi: 10.1118/1.2805254. [DOI] [PubMed] [Google Scholar]
- 5.Ebert MA, Hoban PW. A model for electron-beam applicator scatter. Med Phys. 1995;22:1419–1429. doi: 10.1118/1.597415. [DOI] [PubMed] [Google Scholar]
- 6.Khan FM, Higgins PD, Gerbi BJ, Deibel FC, Sethi A, Mihailidis DN. Calculation of depth dose and dose per monitor unit for irregularly shaped electron fields. Phys Med Biol. 1998;43:2741–2754. doi: 10.1088/0031-9155/43/10/005. [DOI] [PubMed] [Google Scholar]
- 7.Chen JZ, VanDyk J, Lewis C, Battista JJ. A two-source model for electron beams: calculation of relative output factors. Med Phys. 2001;28:1735–1745. doi: 10.1118/1.1386423. [DOI] [PubMed] [Google Scholar]
- 8.Bruinvis IAD, Mathol WAF. Calculation of electron beam depth-dose curves and output factors for arbitrary field shapes. Radiother Oncol. 1998;11:395–404. doi: 10.1016/0167-8140(88)90211-3. [DOI] [PubMed] [Google Scholar]
- 9.Garden AS, Morrison WH, Rosenthal DI, Chao KS, Ang KK. Target coverage for head and neck cancers treated with IMRT: review of clinical experiences. Semin Radiat Oncol. 2004;14:103–109. doi: 10.1053/j.semradonc.2003.12.004. [DOI] [PubMed] [Google Scholar]
- 10.Li JS, Freedman GM, Price R, Wang L, Anderson P, Chen L, Xiong W, Yang J, Pollack A, Ma CM. Clinical implementation of intensity-modulated tangential beam irradiation for breast cancer. Med Phys. 2004;31:1023–1031. doi: 10.1118/1.1690195. [DOI] [PubMed] [Google Scholar]
- 11.Meier R, Hatton J, Mehta V. Forward-planning breast IMRT: early clinical experience. Int J Radiat Oncol Biol Phys. 2003;57:S369. [Google Scholar]
- 12.Boehmer D, Bohsung J, Eichwurzel I, Moys A, Budach V. Clinical and physical quality assurance for intensity modulated radiotherapy of prostate cancer. Radiother Oncol. 2004;71:319–325. doi: 10.1016/j.radonc.2004.02.016. [DOI] [PubMed] [Google Scholar]
- 13.Jani AB, Roeske JC, Rash C. Intensity-modulated radiation therapy for prostate cancer. Clin Prostate Cancer. 2003;2:98–105. doi: 10.3816/cgc.2003.n.016. [DOI] [PubMed] [Google Scholar]
- 14.Ma CM, Mok E, Kapur A, Pawlicki T, Findley D, Brain S, Forster K, Boyer AL. Clinical implementation of a Monte Carlo treatment planning system. Med Phys. 1999;26:2133–2143. doi: 10.1118/1.598729. [DOI] [PubMed] [Google Scholar]
- 15.Convery DJ, Rosenbloom L. The generation of intensity-modulated fields for conformal radiotherapy by dynamic collimation. Phys Med Biol. 1991;37:1359–1374. [Google Scholar]
- 16.Chui CS, LoSasso T, Spirou S. Dose calculation for photon beams with intensity modulation generated by dynamic jaw or multileaf collimations. Med Phys. 1994;21:1237–1244. doi: 10.1118/1.597206. [DOI] [PubMed] [Google Scholar]
- 17.Chang SX, Cullip TJ, Deschesne KM. Intensity modulation delivery techniques: “step & amp; shoot” MLC auto-sequence versus the use of a modulator. Med Phys. 2000;27:948–959. doi: 10.1118/1.598989. [DOI] [PubMed] [Google Scholar]
- 18.Xia P, Verhey LJ. Multileaf collimator leaf sequencing algorithm for intensity modulated beams with multiple static segments. Med Phys. 1998;25:1424–1434. doi: 10.1118/1.598315. [DOI] [PubMed] [Google Scholar]
- 19.Galvin JM, Chen XG, Smith RM. Combining multileaf fields to modulate fluence distributions. Int J Radiat Oncol Biol Phys. 1993;27:697–705. doi: 10.1016/0360-3016(93)90399-g. [DOI] [PubMed] [Google Scholar]
- 20.Nelson WR, Hirayama H, Rogers DWO. The EGS4 code system 1985 Standford Linear Accelerator Center, Internal Report SLAC 265. CA: Stanford Linear Accelerator Center; 1985. [Google Scholar]
- 21.Briesmeister JF. MCNP - A general Monte Carlo N-particle transport code 1993, Version 4A, Los Alamos National Laboratory Report, LA-12625. NM: Los Alamos National Laboratory; 1993. [Google Scholar]
- 22.Ma CM, Reckwerdt P, Holmes M, Rogers DWO, Geiser B. DOSXYZ User Manual 1995, National Research Council of Canada Report No. PIRS-0509B. NRC, Ottawa: ICRU; 1995. [Google Scholar]
- 23.Cox LJ, Schach von Wittenau AE, Bergstrom PM Jr, Mohan R, Libby B, Wu Q, Lovelock DMJ. Photon beam description in REREGRINE for Monte Carlo dose calculations 1997 Lawrence Livermore National Laboratory Internal Report UCRL-JC-126731. USA: Lawrence Livermore National Laboratory; 1995. [Google Scholar]
- 24.Ma L, Boyer AL, Ma CM, Xing L. Synchronizing dynamic multileaf collimators for producing two-dimensional intensity-modulated fields with minimum beam delivery time. Int J Radiat Oncol Biol Phys. 1999;44:1147–1154. doi: 10.1016/s0360-3016(99)00121-2. [DOI] [PubMed] [Google Scholar]
- 25.Ma L, Boyer AL, Xing L, Ma CM. An optimized leaf-setting algorithm for beam intensity modulation using dynamic multileaf collimators. Phys Med Biol. 1998;43:1629–1643. doi: 10.1088/0031-9155/43/6/019. [DOI] [PubMed] [Google Scholar]
- 26.Rogers DWO, Faddegon BA, Ding GX, Ma CM, Wei J, Mackie TR. BEAM: A Monte Carlo code to simulate radiotherapy treatment units. Med Phys. 1995:22; 503–524. doi: 10.1118/1.597552. [DOI] [PubMed] [Google Scholar]
- 27.Rogers DWO, Ma CM, Ding GX, Walters B, Sheikh-Bagheri D, Zhang GG. BEAMnrc users manual 2001 NRC Report PIRS 509b (revF) USA: NRC; 2001. [Google Scholar]
- 28.Sharma SC, Johnson MW. Electron beam effective source surface distances for a high energy linear accelerator. Med Dosim. 1991;16:65–70. doi: 10.1016/0958-3947(91)90048-7. [DOI] [PubMed] [Google Scholar]
- 29.Roback DM, Khan FM, Gibbons JP, Sethi A. Effective SSD for electron beams as a function of energy and beam collimation. Med Phys. 1995;22:2093–2095. doi: 10.1118/1.597651. [DOI] [PubMed] [Google Scholar]
- 30.Cygler J, Li XA, Ding GX, Lawrence E. Practical approach to electron beam dosimetry at extended SSD. Phys Med Biol. 1997;42:1505–1514. doi: 10.1088/0031-9155/42/8/003. [DOI] [PubMed] [Google Scholar]
- 31.Almond PR, Biggs PJ, Coursey BM, Hanson WF, Huq MS, Nath R, Rogers DW. AAPM’s TG-51 protocol for clinical reference dosimetry of high-energy photon and electron beams. Med Phys. 1999;26:1847–1870. doi: 10.1118/1.598691. [DOI] [PubMed] [Google Scholar]
- 32.Hogstrom KR, Mills MD, Almond PR. Electron beam dose calculations. Phys Med Biol. 1981;26:445–459. doi: 10.1088/0031-9155/26/3/008. [DOI] [PubMed] [Google Scholar]
- 33.Kamath S, Sahni S, Palta J, Ranka S. Algorithms for optimal sequencing of dynamic multileaf collimators. Phys Med Biol. 2004;49:33–54. doi: 10.1088/0031-9155/49/1/003. [DOI] [PubMed] [Google Scholar]
- 34.Dirkx ML, Heijmen BJ, van Santvoort JP. Leaf trajectory calculation for dynamic multileaf collimation to realize optimized fluence profiles. Phys Med Biol. 1998;43:1171–1184. doi: 10.1088/0031-9155/43/5/009. [DOI] [PubMed] [Google Scholar]
- 35.Jursinic PA, Mueller R. A sector-integration method for calculating the output factors of irregularly shaped electron fields. Med Phys. 1997;24:1765–1769. doi: 10.1118/1.597962. [DOI] [PubMed] [Google Scholar]
- 36.Jones D, Andre P, Washington JT, Hafermann MD. A method for the assessment of the output of irregularly shaped electron fields. Br J Radiol. 1990;63:59–64. doi: 10.1259/0007-1285-63-745-59. [DOI] [PubMed] [Google Scholar]
- 37.Khan FM, Deibel FC, Gerbi BJ, Das IJ. Dosimetry of irregularly shaped electron fields. Med Phys. 1987;14:473. [Google Scholar]
- 38.Ahnesjö A. Collapsed cone convolution of radiant energy for photon dose calculation in heterogeneous media. Med Phys. 1989;16:577–592. doi: 10.1118/1.596360. [DOI] [PubMed] [Google Scholar]
- 39.Deasy JO, Blanco AI, Clark VH. CERR: a computational environment for radiotherapy research. Med Phys. 2003;30:979–985. doi: 10.1118/1.1568978. [DOI] [PubMed] [Google Scholar]


