Abstract
Motivation: RNA-seq has been widely used to study the transcriptome. Comparing to microarray, sequencing-based RNA-seq is able to identify splicing variants and single nucleotide variants in one experiment simultaneously. This provides unique opportunity to detect variants that associated with aberrant splicing. Despite the popularity of RNA-seq, no bioinformatics tool has been developed to leverage this advantage to identify variants associated with aberrant splicing.
Results: We have developed PVAAS, a tool to identify single nucleotide variants that associated with aberrant alternative splicing from RNA-seq data. PVAAS works in three steps: (i) identify aberrant splicings; (ii) use user-provided variants or perform variant calling; (iii) assess the significance of association between variants and aberrant splicing events.
Availability and implementation: PVAAS is written in Python and C. Source code and a comprehensive user’s manual are freely available at: http://pvaas.sourceforge.net/.
Contact: wang.liguo@mayo.edu or kocher.jeanpierre@mayo.edu
Supplementary information: Supplementary data are available at Bioinformatics online.
1 INTRODUCTION
Alternative pre-messenger RNA splicing is the primary mechanism to increase protein diversity in eukaryote (Graveley, 2001). In humans, ∼95% of multi-exon genes are alternatively spliced (Wang et al., 2008). On the other hand, this tightly regulated, sophisticated nuclear process is also a natural source of disease-causing errors. Genetic mutations in splice sites or other cis-regulatory sites (such as exonic splicing enhancer, or ESE) can impair the splicing process and lead to aberrantly spliced transcripts. Aberrant splicings are increasingly recognized as responsible for human disease (Douglas and Wood, 2011; Faustino and Cooper, 2003; Tazi et al., 2009). It is estimated that 50% of disease causing mutations affect splicing (López-Bigas et al., 2005). Despite the importance of aberrant splicing in disease development and progression, little work has been done to identity the causal mutations that are directly associated with aberrant splicing in genome scale.
The sequencing of the transcriptome using high-throughput sequencing platforms provides a unique opportunity to study the association between single nucleotide variants (SNVs) and splice variants. First, RNA-seq experiment is able to simultaneously identify aberrant splicing events and SNVs, a clear advantage compared with microarrays. Second, spliced reads (i.e. reads that spanning exon-exon junctions) provide physical evidence of the association between variants and certain isoforms. To our knowledge, no bioinformatics tool is currently available to characterize this association.
We have developed PVAAS, a program to detect SNVs that are associated with aberrant alternative splicing from RNA-seq data directly. It efficiently handles large-scale data with hundreds of millions of alignments.
2 Features and Methods
2.1 Extract and annotate spliced alignments
PVAAS takes the commonly used BAM file as input (Li et al., 2009). Spliced reads are extracted from the original BAM file and annotated using provided reference gene model(s). For pair-end RNA sequencing, the mates of splice-mapped reads are also extracted. According to the annotation status of the 5′ splice site (5′SS, or donor site) and the 3′ splice site (3′SS, or acceptor site), splicing events are grouped into 3 categories: (i) canonical splicing (i.e. both 5′ and 3′SS are known). (ii) Semi-canonical splicing (i.e. either 5′ or 3′SS is known). (iii) Novel splicing (both 5′ and 3′SS are novel). ‘Semi-canonical splicing’ and ‘novel splicing’ are considered as aberrant splicing events, because both of them involve spurious splicing site. A new BAM file containing all spliced alignments is generated to facilitate downstream analyses and visualization. In addition, the annotation information for each splice alignment is also incorporated as additional tags.
2.2 Identify variants associated with aberrant splicing
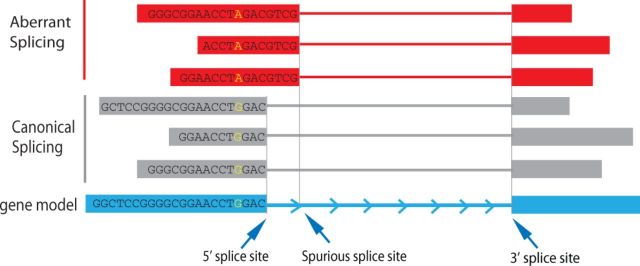
If no variants were supplied, PVAAS will try to identify SNVs from BAM file containing spliced alignments. We then investigate if there are any variants that specifically associated with aberrant splicing. In the example illustrated in Figure 1, all reads containing allele ‘G’ are canonically spliced while all reads containing allele ‘A’ are aberrantly spliced, suggesting that the ‘A’ allele is associated with aberrant splicing. We use Fisher’s exact test to evaluate the significance of association between sequence variants (SNPs or indels) and the aberrant splicing events. Let’s assume that a given SNV is covered by n splice reads, with k reads canonically spliced and m reads are aberrantly spliced (n = k + m). Let's also assume that out of the k canonically spliced reads, p reads have the alternate (non reference) allele, and out of the m aberrantly spliced reads, q reads have the alternate allele, the Fisher’s exact test can be formulated as follow:
After calculating the raw P values, the Benjamini-Hochberg procedure is used to control the false discovery rate (FDR).
Fig. 1.
Schematic diagram showing an SNV is associated with aberrant splicing (red horizontal bars). Grey horizontal bars represent canonical spliced alignments, and blue horizontal bar represents gene model
2.3 Applying PVAAS to real RNA-seq data
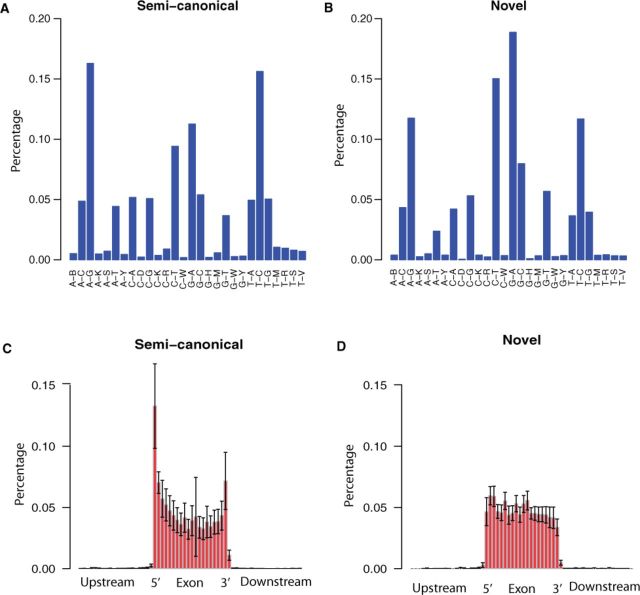
To demonstrate the usefulness of PVAAS, we applied it to one of the TCGA prostate cancer RNA-seq data (uuid = 960c1e43-d2be-41f0‐9f3a-8234cddb84be). Using the adjusted P-value cutoff 0.01, we detected 215 SNVs that significantly associated with aberrant splicing. A-to-G (or T-to-C) transitions were the most frequent (32%) mutation type that associated with semi-canonical aberrant splicing (Fig. 2A), while G-to-A (or C-to-T) transitions were the most frequent (34%) mutation type that associated with novel aberrant splicing (Fig. 2B). SNVs associated with semi-canonical aberrant splicing were primarily located in exon boundaries (Fig. 2C), while SNVs associated with novel aberrant splicing were distributed evenly across exon (Fig. 2D). A genuine example was shown in Supplementary Figure S1, a C-to-A mutation (chr9: 96320999) located near 5′SS was found significantly associated with spurious 3′SS. The use of spurious 3′SS lead to a deletion of three nucleotides compared with the canonical splice transcript.
Fig. 2.
Genotype of SNVs that were associated with semi-canonical splicing (A) and novel splicing (B). Distribution of SNVs that was associated with semi-canonical splicing (C) and novel splicing (D)
3 Summary and Discussion
The characterization of variants affecting splicing will promise deeper insights into cis-elements regulated alternative splicing. Evidence suggests that these variants could also significantly contribute to disease. For example, some synonymous point mutations previously thought to be silent mutations might disrupt motif that involved in pre-mRNA splicing, and therefore lead to the produce of aberrant isoforms (Cartegni et al., 2002).
Cis-acting splicing regulatory elements include ESEs, exonic splicing silencers (ESSs), intronic splicing enhancers and intronic splicing silencers. However, PVAAS can only be used to study ESEs and ESSs because the vast majority of the SNVs called from RNA-seq are located in expressed exons. Moreover, when using PVAAS, one has to keep in mind that tumor tissues are often contaminated with normal stromal cells and might include different sub-clones. Such heterogeneity confounds the association analysis between SNVs and aberrant splicing. Although Fisher’s test could effectively assess the significance of association between allele and aberrant splicing, technical advance such as single cell sequencing would dramatically improve the detection sensitivity and specificity.
Funding
This work was supported by the Center for Individualized Medicine at Mayo Clinic (CA15083-40C19 to J.-P.A.K.).
Conflict of Interest: none declared.
Supplementary Material
References
- Cartegni L., et al. (2002) Listening to silence and understanding nonsense: exonic mutations that affect splicing. Nat. Rev. Genet., 3, 285–298. [DOI] [PubMed] [Google Scholar]
- Douglas A., Wood M. (2011) RNA splicing: disease and therapy. Brief Funct Genomics., 10, 151–164. [DOI] [PubMed] [Google Scholar]
- Faustino N.A., Cooper T.A. (2003) Pre-mRNA splicing and human disease. Genes Dev . [DOI] [PubMed] [Google Scholar]
- Graveley B.R. (2001) Alternative splicing: increasing diversity in the proteomic world. Trends Genet., 17, 100–107. [DOI] [PubMed] [Google Scholar]
- Li H., et al. (2009) The Sequence Alignment/Map format and SAMtools. Bioinformatics, 25, 2078–2079. [DOI] [PMC free article] [PubMed] [Google Scholar]
- López-Bigas N., et al. (2005) Are splicing mutations the most frequent cause of hereditary disease? FEBS Lett., 579, 1900–1903. [DOI] [PubMed] [Google Scholar]
- Tazi J., et al. (2009) Alternative splicing and disease. Biochim. Biophys. Acta, 1792, 14–26. [DOI] [PMC free article] [PubMed] [Google Scholar]
- Wang E.T., et al. (2008) Alternative isoform regulation in human tissue transcriptomes. Nature., 456, 470–476. [DOI] [PMC free article] [PubMed] [Google Scholar]
Associated Data
This section collects any data citations, data availability statements, or supplementary materials included in this article.


