

Abstract
Bacterial pathogens rely on the availability of nutrients for survival in the host environment. The phosphoenolpyruvate-phosphotransferase system (PTS) is a global regulatory network connecting sugar uptake with signal transduction. Since the fructose PTS has been shown to impact virulence in several streptococci, including the human pathogen Streptococcus pyogenes (the group A Streptococcus [GAS]), we characterized its role in carbon metabolism and pathogenesis in the M1T1 strain 5448. Growth in fructose as a sole carbon source resulted in 103 genes affected transcriptionally, where the fru locus (fruRBA) was the most induced. Reverse transcriptase PCR showed that fruRBA formed an operon which was repressed by FruR in the absence of fructose, in addition to being under carbon catabolic repression. Growth assays and carbon utilization profiles revealed that although the entire fru operon was required for growth in fructose, FruA was the main transporter for fructose and also was involved in the utilization of three additional PTS sugars: cellobiose, mannitol, and N-acetyl-d-galactosamine. The inactivation of sloR, a fruA homolog that also was upregulated in the presence of fructose, failed to reveal a role as a secondary fructose transporter. Whereas the ability of both ΔfruR and ΔfruB mutants to survive in the presence of whole human blood or neutrophils was impaired, the phenotype was not reproduced in murine whole blood, and those mutants were not attenuated in a mouse intraperitoneal infection. Since the ΔfruA mutant exhibited no phenotype in the human or mouse assays, we propose that FruR and FruB are important for GAS survival in a human-specific environment.
INTRODUCTION
Bacterial pathogenesis is intimately linked to the availability of nutrients that a pathogen encounters in the host, such as preferred carbohydrate sources for carbon and energy. This paradigm holds true for Gram-positive pathogens in the phylum Firmicutes, where low glucose availability conveys methicillin resistance in Staphylococcus aureus, promotes successful colonization in Streptococcus pneumoniae, stimulates host cell invasion in Listeria monocytogenes, and increases toxin production in Clostridium perfringens (1). These pathogens, like all bacteria, rely on global regulatory networks and dedicated sugar transporters in order to detect the presence of preferred carbon sources as a reflection of the nutrient status of the host environment. This allows for the appropriate coordination of virulence gene expression and disease manifestations in response to surrounding conditions.
The phosphoenolpyruvate (PEP)-phosphotransferase system (PTS) is the main system that is utilized by bacteria for the uptake of sugar and sugar derivatives as well as for signal transduction (2). The PTS is made up of distinct proteins, including two cytosolic components, enzyme I (EI) (ptsI) and Hpr (ptsH), and several membrane-bound sugar-specific enzyme IIs (EIIs). Each EII is composed of two cytosolic components (EIIA-B), an integral membrane domain (EIIC), and, in some cases, a fourth component (EIID). A phosphorelay initiates from the phosphoryl donor (PEP) during glycolysis and cascades down to EI, followed by phosphorylation of Hpr at His-15, where the phosphate then is transferred to one of several sugar-specific EIIAs followed by EIIB and eventually to the incoming sugar (2). In Gram-positive bacteria, under metabolically favorable conditions, Hpr also can be phosphorylated at Ser-46 (2, 3). This allows Hpr to directly interact with the global carbon catabolite repressor protein (CcpA) in order to block the transcription of repressed metabolic operons (carbon catabolite repression [CCR]) through CcpA binding to the cre site (for catabolite response elements) (3).
Streptococcus pyogenes, the group A Streptococcus (GAS), is a Gram-positive pathogen that can colonize a variety of tissues in the human host, resulting in a wide range of invasive or noninvasive diseases. Worldwide, GAS is estimated to cause over 700 million cases of noninvasive infections, such as pharyngitis and impetigo, yearly (4). In contrast, invasive forms of disease, including necrotizing fasciitis (NF), puerperal sepsis, and streptococcal toxic shock syndrome (STSS) (5, 6), are much more life threatening. GAS infections also can lead to nonsuppurative sequelae, such as acute rheumatic fever (ARF) and acute poststreptococcal glomerulonephritis (6), that combined lead to over half a million deaths worldwide each year (4). GAS disease progression is heavily dependent on the ability of GAS to coordinate its environmental cues and nutritional status with global transcriptional networks. Examples of such synchronization include the stand-alone regulator Mga, whose activity is directly affected by the PTS (7), LacD.1, the tagatose-1,6-bisphosphate aldolase that acts as an inhibitor of speB transcription (8), and CcpA and EI (ptsI), which both indirectly repress the expression of the hemolysin streptolysin S (SLS) independently (9–12). These findings point to a direct link between GAS carbohydrate metabolism and virulence factor production.
Several PTS EIIs have been implicated in the pathogenesis of low-G+C Gram-positive bacteria, including the fructose-specific PTS (Fru) in pathogenic species of streptococci. In the oral pathogen Streptococcus gordonii, the fructose EIIABC (fruA) has been linked to biofilm formation (13). In the zoonotic pathogen Streptococcus iniae, fruA was found in the genomes of five virulent strains but was absent from nonvirulent strains (14). In GAS, a TraSH (for transposon-site hybridization) screen found fruA was a gene critical for the survival of GAS in whole human blood (15). The transcription of fruA also was induced in an analysis of global heme stress in GAS (16), a condition likely encountered during bloodstream infection.
Despite clear links to pathogenesis, the exact role of FruA and fructose utilization in the physiology and virulence of GAS has yet to be examined. fruA encodes one of the 14 EII PTS sugar transporters found in the GAS M1T1 genome (17) and is predicted to be located within a conserved three-gene fru operon conserved across low-G+C Gram-positive bacteria. In the model organism Lactococcus lactis, the fru operon is composed of fruR, encoding a DeoR family transcriptional repressor; fruK, a 1-phosphofructokinase; and fruA, an EIIABC PTS sugar transporter (18).
In this study, we have characterized the fru operon (fruRBA) in the M1T1 strain 5448, a representative of one of the most prevalent serotypes of GAS isolated from invasive forms of infections worldwide. We found that the expression of the fruRBA genes was highly induced as an operon in the presence of fructose and that FruR acted as a repressor of the operon, likely in conjunction with CcpA (CCR). Growth and metabolism studies demonstrated that FruA was the probable primary transporter of fructose for GAS and that all three fru genes were important for growth in fructose. Interestingly, fruR and fruB are important for GAS survival in whole human blood and for the evasion of human neutrophils, whereas the FruA EII transporter was not. Surprisingly, neither growth in whole mouse blood nor intraperitoneal (i.p.) infection in mice was attenuated by mutations in the fruRBA operon. These data strongly suggest that FruB and its regulation by FruR affect a human-specific mechanism for the evasion of neutrophil killing independent of FruA fructose transport.
MATERIALS AND METHODS
Bacterial strains and media.
Streptococcus pyogenes (GAS) strain 5448 (19) is an M1T1 strain isolated from an invasive infection. The strain MGAS5005 (20) was used as a reference genome for this study. GAS bacteria were cultured either in Todd-Hewitt medium supplemented with 0.2% yeast extract (THY) or in chemically defined medium (CDM) purchased from Alpha Biosciences. Prior to the use of CDM, freshly prepared sodium bicarbonate (59.51 μM) and l-cysteine (11.68 μM) (final concentrations) were added along with a carbohydrate source of either 0.5% (d-glucose) or 1% (all other PTS sugars). Escherichia coli strain DH5α (hsdR17 recA1 gyrA endA1 relA1) was used as the host for plasmid constructions. All E. coli strains were grown in Luria-Bertani broth. Antibiotics were used at the following concentrations: spectinomycin at 100 μg/ml for both E. coli and GAS, chloramphenicol at 30 μg/ml for E. coli and 1 μg/ml for GAS, and kanamycin at 50 μg/ml for E. coli and 300 μg/ml for GAS. The growth of GAS was assayed by measuring absorbance using a Klett-Summerson colorimeter (A filter) and expressed in Klett units.
DNA manipulations.
Plasmid DNA was isolated from E. coli using the Wizard plus SV miniprep system (Promega). DNA fragments were gel purified from agarose using the Wizard SV gel and PCR cleanup system (Promega). PCR for cloning and generating probes was performed using Accuprime Pfx (Life Technologies) according to the manufacturer's protocol. PCR for diagnostic assays was performed using Taq DNA polymerase (NEB). All DNA sequencing was done by Genewiz, Inc. Genomic DNA was extracted from GAS using the Master-Pure complete DNA and RNA purification kit for Gram-positive bacteria (Epicentre, Illumina).
Inactivation of fruR, fruB, and fruA in GAS 5448.
Nonpolar mutations of the fruR, fruB, and fruA genes were obtained by replacing the corresponding open reading frames (ORF) with a cat cassette using allelic exchange as previously described (21). Primers, plasmid constructs, and GAS strains are listed in Tables 1 and 2. For the fruR mutation, DNA fragments flanking the fruR gene were amplified using the primer pairs oAXSpy0660.5 and oAXSpy0660.2 (before the 5′ end of fruR) and oAXSpy0660.3 and oAXSpy0660.6 (after the 3′ end of fruR) and subsequently ligated by PCR-splicing by overlap extension (SOE) to a cat cassette amplified using the primers oCatFwd and oCatRev. The resulting PCR product then was digested by SmaI and cloned into the SmaI-digested pCRS (21), creating the plasmid p5448.ΔfruR. The plasmid p5448.ΔfruR was integrated into the GAS 5448 genome by single-crossover homologous recombination as previously described (21), and the clone was further passaged under two different conditions in order to select for either the 5448.ΔfruR mutant or the 5448.fruRR rescue strain. The 5448.ΔfruR mutant was obtained by selecting for the replacement of the fruR ORF by the cat cassette during plasmid excision through double-crossover recombination and selection for Cmr and Sps clones, whereas the 5448.fruRR rescue strain was produced by excising the entire native p5448.ΔfruR plasmid through selection of Cms and Sps clones. The genotypes of 5448.ΔfruR and 5448.fruRR strains were verified by DNA sequencing after PCR amplification of the fruR locus using primers oAXSpy0660.5 and oAXSpy0660.6 (Table 2).
TABLE 1.
Bacterial strains and plasmids used in this study
| Bacterial strain or plasmid | Relevant genotype/description | Reference or source |
|---|---|---|
| Strains | ||
| E. coli | ||
| DH5α | hsdR17 recA1 gyrA endA1 relA1 | 22 |
| S. pyogenes | ||
| 5448 | M1T1 | 19 |
| 5448.ΔfruR | ΔfruR mutant of strain 5448 | This study |
| 5448.ΔfruB | ΔfruB mutant of strain 5448 | This study |
| 5448.ΔfruA | ΔfruA mutant of strain 5448 | This study |
| 5448.fruRR | ΔfruR revertant strain | This study |
| 5448.fruBR | ΔfruB revertant strain | This study |
| 5448.fruAR | ΔfruA revertant strain | This study |
| 5448.ΔsloR | 5448 insertional inactivation of sloR | This study |
| Plasmids | ||
| pCRS | Temp-sensitive conditional vector; Spr | 15 |
| pCRK | Temp-sensitive conditional vector; Kmr | 15 |
| pACYC | Vector containing Cmr gene | 23 |
| p5448.ΔfruR | ΔfruR mutagenic plasmid; nonpolar cat | This study |
| p5448.ΔfruB | ΔfruB mutagenic plasmid; nonpolar cat | This study |
| p5448.ΔfruA | ΔfruA mutagenic plasmid; nonpolar cat | This study |
| p5448.ΔsloR | ΔsloR temp-sensitive mutagenic plasmid | This study |
| pKSM720 | GAS replicating plasmid with promoterless firefly luciferase (luc) and ribosomal binding site | 9 |
| pKSM944 | GAS replicating plasmid with Pfru driving expression of luc | This study |
| pKSM948 | GAS replicating plasmid with PsloR driving expression of luc | This study |
TABLE 2.
PCR primers used in this study
| Target | Primer name | Sequencea (5′–3′) | Reference or source |
|---|---|---|---|
| qPCR primers | |||
| gyrA | gyrA M1 RT L | CGACTTGTCTGAACGCCAAAGT | 24 |
| gyrA M1 RT R | ATCACGTTCCAAACCAGTCAAAC | 24 | |
| fruR | fruR M1 RT L | GTCAAACAAACGACCGATC | This study |
| fruR M1 RT R | TCCAAGAAATGCCTTGTCA | This study | |
| fruB | fruB M1 RT L | GTTCAGCGCCAGCTAATCT | This study |
| fruB M1 RT R | TCACAAACCACCTGAGCAC | This study | |
| fruA | fruA M1 RT L | ACCGGGCTTAGTAGCTGGT | This study |
| fruA M1 RT R | ACTTCTCCTCCTGCTGCAA | This study | |
| lacD.2 | lacD.2 M1 RT L | GCTGCTTGTGGTCCTTCTTC | 25 |
| lacD.2 M1 RT R | TTGGTGTTTGCAGCAGAATC | 25 | |
| sloR | sloR M1T1 RT L | GTGAAGTAGGCGGAGCAAA | This study |
| sloR M1T1 RT R | CGGCATAACCTGGAGACAC | This study | |
| sdhA | sdhA M1T1 RT L | TGCAGGAGCTTTTGGTCTT | This study |
| sdhA M1T1 RT R | GCAGCTGCAGAACCAACTT | This study | |
| nagB | nagB M1T1 RT L | TGTTTTGGCACATCCTCAAT | This study |
| nagB M1T1 RT R | AAGAAGAAACGCATGTGGTG | This study | |
| adh.2 | adh.2 M1T1 RT L | ATGGACTCGGTCACTCAGC | This study |
| adh.2 M1T1 RT R | ATTCCAGATGACGCGGATA | This study | |
| PCR primers | |||
| fruR | FruR RevTrans F | TATGTCAAACAAACGACCGA | This study |
| FruR SP1 | TCAGCACCTCCATGAACACG | This study | |
| FruR SP2 | ATGTAGCCGTCCTTCTTGCT | This study | |
| FruR SP3 | CCAACTCTCCTAGATCTCTA | This study | |
| oAXSpy0660.5 | cccCCCGGGCAGAGCTAGTTCACGCTAAAG | This study | |
| oAXSpy0660.2 | TATCCAGTGATTTTTTTCTCCATGATTAATTGTTTTCGTTTTGATTTT | This study | |
| oAXSpy0660.3 | CAGGGCGGGGCGTAATTTATACCGTGACCTTAAACCC | This study | |
| oAXSpy0660.6 | cccCCCGGGAATTCGGTCTCTTCTTGTGAC | This study | |
| FruR luc_1 | gggGGATCCTTGTGAGCCTAGATTATGAG | This study | |
| FruR luc_4 | gggCTCGAGGATTAATTGTTTTCGTTTTG | This study | |
| fruB | FruB RevTrans F | TATGAAGAGTCAAAATCCAA | This study |
| FruB RevTrans R | GGGAAAGCTTAGTTTTCAAA | This study | |
| oAXSpy0661.1 | cccGGATCCATTACTCAACTCCTCTGAGTC | This study | |
| oAXSpy0661.2 | TATCCAGTGATTTTTTTCTCCATAATTCAATCACCTTTGCCTTTTC | This study | |
| oAXSpy0661.3 | GATGAGTGGCAGGGCGGGGCGGCTTTCTCTGATGACTTGGC | This study | |
| oAXSpy0661.4 | cccGGATCCTAGCTACTCCCATTTCTGCAG | This study | |
| fruA | FruA RevTrans R | ATCATAAAGAAGAGATCCGT | This study |
| oAXSpy0662.1 | cccGGATCCAAAGGTGATCAAGATACTCG | This study | |
| oAXSpy0662.2 | TATCCAGTGATTTTTTTCTCCATCGTTTTTCTACCTCAACTTTATG | This study | |
| oAXSpy0662.3 | GGCAGGGCGGGGCGTAAAAGGTAAAGAACTTTTTTCTTAC | This study | |
| oAXSpy0662.4 | cccGGATCCAAAATTAGTGAGTTGATACC | This study | |
| sloR | sloR InIn F | gggGGATCCATTCTTGTTTTAGCTATTTT | This study |
| sloR InIn R | gggGGATCCCCCAGCCACAAAACCTGGGA | This study | |
| sloR luc F | gggGGATCCGTCAAACTTCCTATATCTATCTT | This study | |
| sloR luc R | gggCTCGAGATACGAACCTCCTCATTGATAATAT | This study | |
| cat | oCatFwd | ATGGAGAAAAAAATCACTGGATA | This study |
| oCatRev | TTACGCCCCGCCCTGCC | This study | |
| oCatSeq1 | TTCCATGAGCAAACTGAAACG | This study | |
| oCatSeq2 | CAGGTTTTCACCGTAACACG | This study | |
| M13 | 1201 | AACAGCTATGACCATGATTACG | Genewiz |
| 1211 | GTTGTAAAACGACGGCCAGT | Genewiz |
Boldface type denotes restriction sites. Underlined segments denote overlap with cat cassette for PCR-SOE. Lowercase letters denote nucleotides not complementary to target DNA.
A similar PCR-SOE strategy using BamHI was implemented to generate the mutagenic plasmids p5448.ΔfruB and p5448.ΔfruA to inactivate fruB and fruA, respectively. Allelic replacement with the cat cassette using these constructs resulted in the 5448.ΔfruB and 5448.ΔfruA mutant strains; the corresponding 5448.fruBR and 5448.fruAR rescue strains were generated as described above using defined primers (Table 2). Genotypes of the GAS strains were verified through DNA sequencing using the appropriate primers (Table 2).
Insertional inactivation of sloR in GAS 5448.
A 300-bp internal fragment of sloR was PCR amplified from GAS 5448 genomic DNA (gDNA) using sloR InIn F and sloR InIn R primers (Table 2) and then blunt cloned into pCRK with SmaI to generate an insertional inactivation construct, generating p5448.ΔsloR (Table 1). GAS 5448 was transformed with 20 μg of plasmid (p5448.ΔsloR) and grown on THY agar containing kanamycin at 30°C. Potential integration mutants with mutations in each gene (GAS 5448.ΔsloR mutants) were identified following growth on THY agar containing kanamycin at 37°C (Table 1). The presence of inserted plasmid was verified by PCR analysis of each GAS mutant gDNA using primers sloR luc F and 1211 (Table 2).
Carbon metabolic profile assays.
Carbohydrate metabolic profiles of wild-type (WT) 5448 and the 5448.ΔfruA mutant were determined via Biolog Omnilog (Biolog, Inc.) as previously described (12). Briefly, both the phenotype microarray 1 (PM1) and PM2A carbon panels (96-well microplates) were used, each containing 95 carbon sources and one negative control, for carbon utilization tests. Strains were cultured on blood agar plates (tryptic soy agar [TSA] plus 5% sheep blood) and resuspended in inoculating fluid (Biolog) to an optical density at 600 nm (OD600) of 0.14. A 100-μl aliquot of the cell suspension then was added to each well of the PM microplates and incubated at 37°C for 48 h. A change in a colorimetric dye present in the inoculating fluid given was used as a readout for the utilization of a carbon source using an Omnilog X instrument located at the FDA Center for Food and Applied Nutrition (CFSAN). The data were analyzed using the Omnilog software (Biolog).
Alternatively, carbohydrate metabolic profiles were determined using API 50 CH strips (bioMérieux). Strains were cultured overnight on blood agar plates, resuspended in 1 ml saline, and vortexed for 3 min. Strains then were diluted to a final OD600 of 0.14 in 10 ml of API 50 CHL medium (bioMérieux). The cell suspension then was added to each of the 50 cupules, representing one carbon source each in addition to a negative control. Strains were incubated covered at 37°C in 5% CO2 for 48 h. Utilization scores were determined at 24 h and 48 h. A plus sign was given if the cupule changed from purple to yellow, indicating complete utilization. A plus/minus sign was given if there was a partial color change, indicating partial utilization. Finally, a minus sign was given if there was no color change at all, indicating no utilization.
RNA-Seq and data analysis.
For RNA transcriptome sequencing (RNA-Seq), total RNA was extracted using a Direct-zol RNA miniprep kit (Zymo Research) with a modified procedure to improve GAS cell disruption. Cells from frozen pellets were resuspended in 700 μl of TRIzol supplemented with approximately 300 mg of acid-washed glass beads (Sigma Life Science) and disrupted by vortexing for 5 min. Beads were collected by brief centrifugation, and cell lysate was used for RNA purification as recommended by the manufacturer. RNA samples were treated with the Turbo DNase-free kit (Life Technologies) to avoid gDNA contamination. A total of 5 μg of DNase-treated RNA was treated for rRNA removal using the Ribo-Zero magnetic kit (Epicentre) for Gram-positive bacteria, and rRNA-depleted RNA then was purified with the RNAClean XP kit (Agencourt). Sample quality was assessed using a 2100 Bioanalyzer (Agilent), and sample quantity was determined using a NanoDrop 8000 spectrophotometer (Thermo Scientific).
RNA-Seq directional libraries were generated using the ScriptSeq v2 RNA-Seq library preparation kit (Illumina) according to the manufacturer's recommendations. Briefly, 45 ng rRNA-depleted RNA was fragmented and used for reverse transcription with random primers containing a 5′-tagging sequence. The 5′-tagged cDNA then was modified at its 3′ end by a terminal-tagging reaction to generate di-tagged, single-stranded cDNA that then was purified using the AMPure system (Agencourt). The purified di-tagged cDNA was used as a template to generate second-strand cDNA containing Illumina adaptor sequences, to incorporate index barcodes, and to amplify the library by limited-cycle PCR. The resulting RNA-Seq libraries were purified using the AMPure system (Agencourt), and RNA-Seq library quality was verified as described above. A rapid-run 100-bp single-read DNA sequencing then was performed at the Institute for Bioscience and Biotechnology Research (IBBR) Sequencing Facility at the University of Maryland, College Park, using the Illumina HiSeq 1500 platform. Data were generated in the standard Sanger FastQ format, and raw reads were deposited with the Sequence Read Archive (SRA) at the National Center for Biotechnology Information (accession number PRJNA297518).
Read quality was measured using FastQC (http://www.bioinformatics.babraham.ac.uk/projects/fastqc/), filtered and trimmed using trimmomatic (26), and mapped against the MGAS5005 genome (accession number CP000017) using bowtie (27), bowtie2 (28), and tophat (29) with options to allow one mismatch and randomly map multihit reads. The resulting alignments were converted to sorted BAM alignments (30) and counted (31) by coding and intergenic region. Initial visualizations of the sequencing mapping were performed using the Integrative Genomics Viewer (IGV) (32). Differential expression analyses were performed following the size-factor and quantile normalization of read counts, and batch effect estimation was taken into account by including the date in the Limma (33) statistical model. The resulting metrics of expression were visualized using circos (34) and tested for ontology enrichment using KEGG (35), goseq (36), clusterProfiler (37), GOstats (38), and topGO (39).
qRT-PCR.
The quantitative real-time PCR (qRT-PCR) experiments were performed as follows. Total RNA was isolated from strains grown to late-logarithmic phase using Triton X-100 isolation (40). Total RNA (5 μg) was subjected to DNase I treatment as described above. Twenty-five nanograms of DNase-treated total RNA was added to SYBR green master mix (Applied Biosystems) with 6.5 μl of each gene-specific real-time primer from a 20 nM stock (Table 2) using the one-step protocol on a Light Cycler 480 (Roche). Real-time primers were designed using the interactive tool Primer3 (http://biotools.umassmed.edu/bioapps/primer3_www.cgi).
The validation of RNA-Seq data was carried out by qRT-PCR of differentially regulated genes using primers listed in Table 2. cDNA was generated separately in a two-step protocol in order to mimic the strand specificity of the RNA-Seq results. Briefly, 100 ng of DNase-treated total RNA was incubated with gene-specific primers using the manufacturer's recommendations (Quanta Biosciences). Twenty-five nanograms of cDNA then was added to a SYBR green master mix (Quanta Biosciences) with 6.5 μl of gene-specific primers from a 20 nM stock.
The levels presented represent ratios of the experimental/wild-type levels relative to gyrA transcripts as the internal control. Standard errors were calculated from three biological replicates, and differences over 2-fold in expression were considered significant. Correlation coefficients for RNA-Seq were determined by plotting the log value of the array on the x axis to the log value of the qRT-PCR on the y axis. Linear regression was used to determine the line of best fit, and the resulting R2 value, which represented the fitness of the data, was calculated (see Fig. S1 in the supplemental material).
Mapping of operon structure and transcription start sites by rapid amplification of cDNA ends (5′-RACE).
Reverse transcriptase PCR (RT-PCR) was carried out on 500 ng of total RNA with Moloney murine leukemia virus reverse transcriptase (NEB) according to the manufacturer's protocol using primers FruA RevTrans R and FruB RevTrans R (Table 2). Reverse transcription was performed for 1 h at 42°C using 1 μl of cDNA as a template in the reaction mix, followed by enzyme inactivation at 90°C for 10 min. The subsequent PCR was done with the following parameters: 5 min at 95°C (initial activation); 30 cycles of 30 s at 95°C, 30 s at 55°C, and 1.5 min at 72°C (PCR); and a final extension step of 5 min at 72°C.
The 5′/3′ RACE kit (Roche) was used according to the supplier's instructions. A 500-ng aliquot of DNase-treated total RNA was used to obtain the cDNA by primer extension with primer FruR SP1. Following the 3′ tailing reaction with dATPs, the cDNA was amplified by PCR using the reverse primer FruR SP2 and oligo(dT) anchor (Table 2); the forward primer was supplied with the kit. The 5′ end of the transcript then was determined by sequencing the PCR product using the primer FruR SP3 (Table 2).
Modified diauxic growth.
The GAS wild-type strain 5448 and the 5448.ΔfruR mutant were grown on blood agar plates overnight at 37°C with 5% ambient CO2. Colonies were scraped off the plate and resuspended in saline. Klett (Nephalo) flasks containing 150 ml of CDM plus 0.5% glucose were inoculated to an OD600 of 0.05. Strains were grown to mid-log phase and then pelleted and washed in 10 ml of prewarmed (37°C) saline. The pellet then was resuspended in 1 ml of saline and split into 500-μl aliquots for inoculation into fresh CDM plus 0.5% glucose or CDM plus 1% fructose (75 ml). After 1 h of growth, 10 ml of culture was harvested for RNA extraction, and growth continued for 2 h (stationary phase). Strains were grown in two biological replicates.
Luciferase assay.
Luciferase assays were performed as previously described (9). Briefly, 5448 and 5448.ΔfruR strains were transformed with each luciferase plasmid (Table 1) and grown statically in 10 ml of CDM supplemented with spectinomycin and with 0.5% glucose or 1% fructose, mannose, or sucrose at 37°C. Upon reaching 50 Klett units, 500-μl samples were taken every 30 Klett units. Samples were pelleted, supernatant was discarded, and samples were placed at −20°C overnight. Three biological replicates were sampled at each time point to determine the relative luciferase activity of each plasmid under different carbon sources. The luciferase assay was performed using a luciferase assay system (Promega). Pellets were resuspended in various amounts of lysis buffer to normalize them to cell units according to the equation 4.5 = (x ml)(65 Klett units/2), where x is the sample volume. The luciferase assay was read using a Centro XS3 LB 960 luminometer (Berthold Technologies), into which 50 μl of Luciferin-D reagent was directly injected.
Lancefield bactericidal assay.
The ability of GAS strains to survive in whole human blood was tested as previously described (41). Briefly, GAS was grown to early mid-exponential phase (OD600 of ∼0.15) and serially diluted in saline. Blood donation was approved by the University of Maryland Institutional Review Board (IRB) (protocol 10-0735) with approved consent from donors; records have been archived. A 50-μl volume of a 10−4 dilution (ca. 50 to 200 CFU) was added to 500 μl of fresh heparinized whole human blood and rotated for 3 h at 37°C.
A murine blood bactericidal assay was performed as follows. Whole blood was obtained from 8- to 10-week-old female CD1 mice (weight, >25 g; Charles River Laboratories). The mice were anesthetized with ketamine, a blood volume of ≥500 μl was withdrawn by terminal cardiac puncture, and the blood was immediately transferred to a heparinized Vacutainer (Becton Dickinson). Cervical dislocation was performed as a secondary method of euthanasia to ensure animals were deceased following cardiac puncture. A 30-μl volume of a 10−4 dilution (ca. 50 to 200 CFU) was added to 300 μl of fresh whole mouse blood and rotated for 3 h at 37°C.
The multiplication factor (MF) was calculated for both assays by dividing the CFU obtained after blood challenge by the initial CFU inoculated. Data are presented as percent growth in blood corresponding to the MF of the mutant divided by the MF of the WT times 100. The human bactericidal assay MF of each strain was calculated from 6 biological replicates, whereas the murine bactericidal assay obtained blood from multiple mice (n = 4 to 6) in duplicate. Significance (P value) was determined using an unpaired Student t test.
Cell culture.
Human polymorphonuclear leukocytes (PMNs) or monocytes were isolated from heparinized blood of volunteer donors (IRB-approved protocol) using Polymorphprep (Axis-Shield) or Ficoll Paque plus (GE Healthcare), respectively, per the manufacturer's instructions. Contaminating red blood cells (RBCs) were removed by treatment with red cell lysis solution (Epicentre) and washing with Dulbecco's modified phosphate-buffered saline (PBS) (Sigma). Isolated PMNs and monocytes were maintained in RPMI 1640 cell culture medium (HyClone) supplemented with 2.05 mM l-glutamine and 20% plasma from donor blood for the duration of the killing assay.
The human-derived promyelocytic leukemia HL60 (Sigma) cell line was maintained as indicated in the UAB-GBS-OPA protocol (http://www.vaccine.uab.edu/UAB-GBS-OPA.pdf). Briefly, the HL60 cell line was maintained in RPMI 1640 cell culture medium supplemented with 2.05 mM l-glutamine and 10% fetal bovine serum (FBS) (HyClone). Low-passage-number HL60 cells were differentiated into neutrophil-like cells for opsonophagocytic killing assays by supplementing culture medium with 1 μM all-trans retinoic acid (ATRA) in dimethyl sulfoxide (DMSO) (3 mg/ml stock solution). PMNs, monocytes, and HL60 cells were maintained at 37°C in 5% CO2.
Opsonophagocytic killing assays.
Isolated PMNs or differentiated HL60 cells were seeded at a density of 106 cells/ml in 24-well plates with RPMI 1640 cell culture medium supplemented with 2.05 mM l-glutamine. GAS wild-type 5448 and 5448.ΔfruR, 5448.ΔfruB, and 5448.ΔfruA mutant strains, along with their respective rescue strains, were grown overnight, and cultures were diluted into fresh THY and grown to mid-log phase (OD600 of ∼0.4). Bacteria were opsonized prior to neutrophil challenge by resuspension in donor plasma (PMN assays) or FBS (HL60 assays) for 30 min at 37°C. GAS then was added to seeded neutrophils to the desired multiplicity of infection (MOI of 0.1 unless otherwise indicated) in a final volume of 1 ml RPMI 1640 cell culture medium (HyClone) plus 2.05 mM l-glutamine, 20% plasma, or FBS. Neutrophil-challenged bacteria were incubated at 37°C in 5% CO2 for 2 h. GAS also was incubated in RPMI 1640 plus 2.05 mM l-glutamine, 20% plasma, or FBS in the absence of PMNs, monocytes, or differentiated HL60 cells for the purpose of survival comparison.
Following incubation, surviving GAS was harvested by collecting supernatants and neutrophils. Neutrophils were immediately lysed by resuspension in sterile H2O, and the intracellular contents were pelleted and recombined with corresponding well supernatants for plating on THY agar to obtain total viable bacterial counts after overnight incubation at 37°C and 5% CO2. The resistance of GAS to opsonophagocytic killing following neutrophil challenge was assessed by comparing CFU obtained from the plating of viable bacteria isolated from killing assays to CFU obtained from GAS incubation in cell culture media in the absence of neutrophils (CFU obtained from PMNs divided by CFU obtained from medium times 100). All survival indices are normalized to the survival of wild-type 5448 (100%) under the conditions tested. Data presented are the results of at least 3 biological replicates, each performed in triplicate, with P values determined by unpaired t test.
Murine intraperitoneal model of infection.
All animal work was performed in AAALAC-accredited animal biosafety level 2 facilities at the University of Maryland by following IACUC-approved protocols (R12-112) for the humane treatment of animal subjects in accordance with guidelines set up by the Office of Laboratory Animal Welfare (OLAW) at NIH, Public Health Service, and the Guide for the Care and Use of Laboratory Animals (42). Every effort to limit distress and pain to animals was taken.
An overnight culture (10 ml) was used to inoculate 80 ml of THY and incubated static at 37°C until late-logarithmic phase (100 Klett units). Briefly, 6- to 7-week-old female CD-1 mice (Charles River Laboratories) were injected in the peritoneal cavity with 100 μl of a 4 × 10⁹ CFU/ml dilution (4 × 10⁸ CFU). Mice were monitored three times daily for a period not exceeding 72 h and were euthanized using CO2 asphyxiation, consistent with the recommendations of the Panel on Euthanasia of the American Veterinary Medical Association, upon signs of systemic morbidity (hunching, lethargy, and hind-leg paralysis). Survival data were assessed by Kaplan-Meier survival analysis and tested for significance by log-rank test. Data shown represent 10 mice for each strain.
BioProject accession number.
Raw reads were deposited in the Sequence Read Archive (SRA) at the National Center for Biotechnology Information under accession number PRJNA297518.
RESULTS
Transcriptome of M1T1 5448 growing with fructose as the sole carbon source.
Our previous genome-wide screen to identify genes required for GAS 5448 fitness in whole human blood identified the putative PTS fructose enzyme II (EII) gene fruA (15), suggesting a role for fructose utilization in host survival. To determine the effect of fructose on GAS gene expression, we conducted RNA transcriptome sequencing (RNA-Seq) in order to assess how fructose affects global transcription. Total RNA was isolated from wild-type 5448 grown in chemically defined medium (CDM) supplemented with 0.5% glucose or 1% fructose to late logarithmic phase in two biological replicates and processed for RNA-Seq. Data obtained from fructose-grown cells were compared to those of glucose-grown cells (WT-glu/WT-fru), with changes in gene expression over 2-fold (log2 ≤ −1.0 or log2 ≥ 1.0) being considered significant (Table 3).
TABLE 3.
Subset of genes differentially expressed in fructoseb
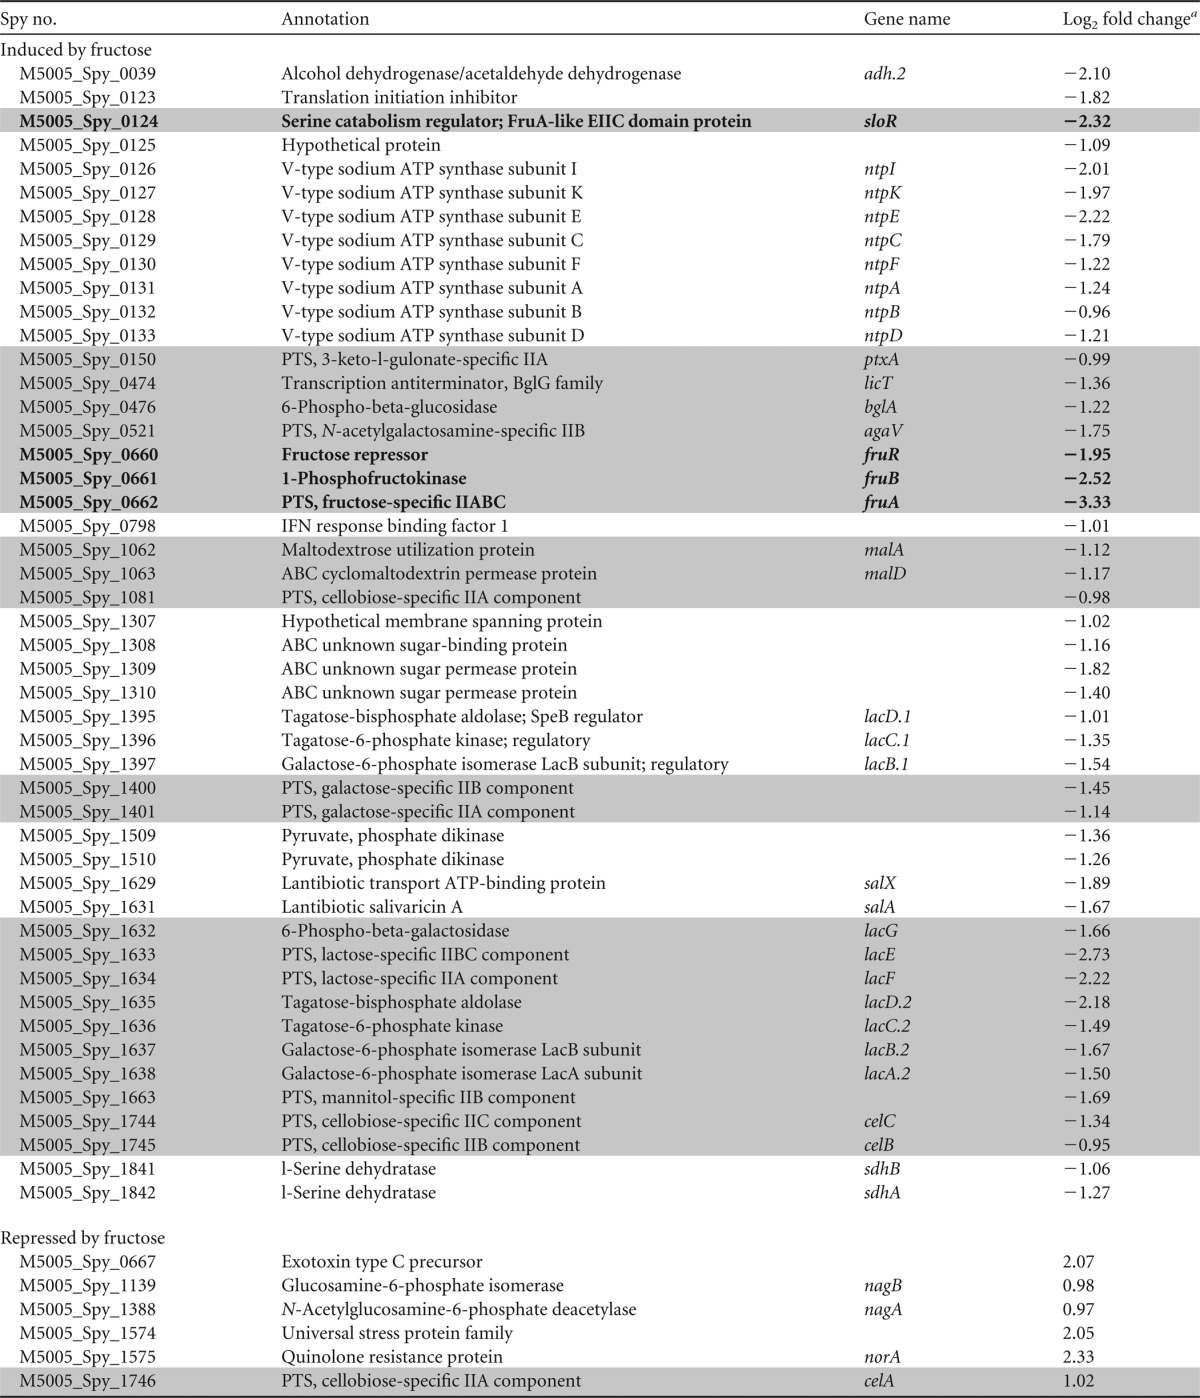
a Log2 fold changes were determined by comparing CDM-glu/CDM-fru values.
Entries in boldface type indicate the fruRBA operon.
A total of 195 genes (103 nonphage genes; 5.5% of genome) were altered by the presence of fructose but not glucose as the sole carbon source (Table 3; also see Fig. S1 in the supplemental material). Several predicted and established sugar metabolism operons were highly induced during growth in fructose (Table 3, shaded gray), including the lacD.1 and lacD.2 β-glucoside-specific PTS operons, the maltose-specific ABC transport system (malADC), and the predicted fructose operon (fruRBA). Of these, the putative fruRBA operon was the most highly induced by fructose, with more than a 5-fold increase in expression (Table 3). In addition, several members of the SerR regulon involved in serine metabolism were induced by fructose (43), including genes encoding the putative regulator SloR, the V-type sodium ATP synthase (ntp) operon, and the serine dehydratase (sdhAB) operon. Interestingly, sloR is predicted to encode a transmembrane protein that exhibits homology to the EIIC domain of the putative FruA PTS transporter. Notably, only six genes, including nagB and nagA, involved in N-acetylglucosamine metabolism, appeared to be repressed in the presence of fructose. Overall, the two largest gene ontology categories found to be induced by fructose were carbohydrate transport and metabolism (33 genes; 32% COGxxxxG) and energy production conversion (9 genes; 9% COGxxxxC). Therefore, the presence of fructose influences the expression of a subset of sugar metabolism genes, particularly the predicted fruRBA fructose utilization operon.
In order to validate the RNA-Seq results, six genes were selected for analysis by qPCR (see Fig. S2 in the supplemental material). Overall, the qPCR results confirmed the RNA-Seq data with a correlation coefficient (R2) calculated to be 0.83 (n = 7) (see Fig. S2).
fruRBA represents an operon in M1T1 GAS.
In the 5448 genome, the fru locus is comprised of three contiguous genes (Fig. 1A and Table 3): fruR, encoding a predicted transcriptional repressor; fruB, encoding the enzyme 1-phosphofructokinase; and fruA, encoding a predicted fructose-specific EIIABC component of the sugar PTS. Each of the three genes slightly overlaps, with the start codon of the gene downstream being found in the upstream gene, suggesting they form an operon. RT-PCR of transcripts from 5448 grown in CDM plus 1% fructose showed transcriptional linkage between fruB-fruA and fruR-fruB, and a 1.5-kb full-length transcript was detected between fruR and fruA (Fig. 1A; also see Fig. S3A in the supplemental material). These data demonstrate that fruRBA genes are expressed as an operon during inducing growth in fructose as the sole carbon source.
FIG 1.

Expression of fruRBA genes in individual fru mutants and their rescue strains in THY. (A) Genetic organization of fruR (encoding a transcriptional regulator), fruB (encoding 1-phosphofructokinase), and fruA (encoding PTS fructose-specific EIIABC) is shown. The magnified region indicates promoter sequences, including putative FruR and CcpA (cre) binding sites (underlined). Solid lines indicate transcription linkage found by RT-PCR. The transcriptional start site is indicated by an arrow, and the −10 and −35 positions are shown. (B to D) Real-time qPCR analyses of relative transcript levels for each gene in the fru operon in individual mutants and their respective rescue strains in fruR (B), fruB (C), and fruA (D) compared to levels for wild-type 5448 grown in THY to late log phase. Probes targeted gene regions as indicated by the dotted line in panel A. Error bars represent the standard errors from three biological replicates. Dashed lines indicate 2-fold significance. Significance was determined using comparisons of transcript levels relative to those of the gyrA gene.
To determine the transcriptional start site (TSS) of the fru operon, 5′-RACE was used in conjunction with a primer complementary to fruR (FruR SP1) (Table 2). A TSS that possessed classical −10 (TATAAT) and −35 (TTGACT) promoter hexamers was identified 56 bp upstream of the start codon for fruR (Fig. 1A; also see Fig. S3B in the supplemental material). A predicted CcpA-binding site (cre site [11]) and FruR-binding site (18) also were identified overlapping and upstream of the promoter, respectively (Fig. 1A). Finally, a putative rho-independent terminator was detected downstream of fruA, consistent with the generation of the full-length fruRBA transcript (Fig. 1A). Thus, the promoter of the fruRBA operon appears to be under CcpA-mediated catabolite repression by glucose and FruR-mediated induction by fructose.
Nonpolar deletion mutants of genes in the fruRBA operon.
To interrogate each gene in the fru operon for its role in fructose metabolism and virulence, we generated nonpolar deletions for fruR, fruB, and fruA by allelic exchange in the 5448 genome with an in-frame chloramphenicol (cat) cassette (23), generating the 5448.ΔfruR, 5448.ΔfruB, and 5448.ΔfruA mutant strains (Table 1). These mutations subsequently were verified by PCR (data not shown). Both 5448.ΔfruR and 5448.ΔfruA strains showed growth kinetics comparable to those of the parental 5448 in THY (see Fig. S4A in the supplemental material). The 5448.ΔfruB mutant had a slightly lower growth rate than the WT but reached the same yield after overnight growth (see Fig. S4A). When the mutants were streaked on TSA supplemented with 5% sheep blood, the 5448.ΔfruB mutant exhibited a small-colony phenotype compared to that of WT 5448 (see Fig. S4B).
Due to the translational overlap between the genes in the fru operon, we wanted to further ensure that the mutations generated for each individual gene did not influence the expression of the gene downstream. qPCR was utilized to assess this using probes centered on each gene, as shown in Fig. 1A, for each individual mutant with RNA isolated during late-logarithmic phase in THY. The data for ΔfruR, ΔfruB, and ΔfruA mutants show that the transcript levels for each mutant were significantly reduced (Fig. 1B to D). Revertant strains for each mutant restored the transcript levels of that gene. Importantly, the transcript levels of the other genes in the operon were unaffected by other individual mutations, as expected due to the operon being under CCR in THY. Thus, the mutations made in the fru operon genes were nonpolar, and their transcript levels could be restored via reversion.
FruA is required for optimal growth and utilization of fructose by GAS 5448.
FruA is predicted to be a fusion of the EIIA, EIIB, and EIIC enzyme subunits of a fructose-specific PTS EII involved in import and concomitant phosphorylation of fructose. To confirm the role of FruA in the utilization of fructose, the 5448.ΔfruA mutant was grown on a panel of PTS sugars and compared to the parental GAS 5448. In order to establish what PTS sugars are amenable to 5448 growth, growth curves in CDM supplemented with a 1% (0.5% for glucose) concentration of 11 readily available PTS sugars were determined (Fig. 2A). WT 5448 was able to grow in 9 of the 11 PTS sugars tested; however, mannitol and cellobiose were not conducive to significant growth of 5448 and were eliminated from further analysis. When 5448.ΔfruA was grown in the remaining 9 PTS sugars, only fructose resulted in reduced growth (Fig. 2B and E; also see Fig. S5 in the supplemental material). Importantly, reversion of the ΔfruA mutation (5448.fruAR) restored growth in fructose back to wild-type levels (Fig. 2B and E; also see Fig. S5). Both 5448.ΔfruR and 5448.ΔfruB strains also displayed significant growth defects in CDM supplemented with 1% fructose that were restored in the revertant (Fig. 2C and D). These data suggest that FruA is the primary EII transporter of fructose in GAS 5448 and that FruB and FruR also are required for growth on fructose as the sole carbon source.
FIG 2.

Growth analysis of 5448 and fru operon mutants in PTS sugars. (A) Total yield was calculated for GAS 5448 grown for 26 h at 37°C with 5% CO2 in various PTS sugars as the sole carbon source. (B) Growth rates were determined for 5448 (black bars) and 5448.ΔfruA (white bars) strains in 9 PTS sugars (P < 0.05). The growth of the fruAR revertant (gray bar) was assessed for fructose only. Error bars represent standard errors of the means from three biological replicates. Statistical analysis was performed using an unpaired t test. (C to E) Growth curves for the 5448.ΔfruR mutant and its 5448.fruRR revertant (C), 5448.ΔfruB mutant and its 5448.fruBR revertant (D), and 5448.ΔfruA and its 5448.fruAR revertant (E) compared to that of 5448 in chemically defined medium (CDM) supplemented with 1% fructose were measured by absorbance using a Klett-Summerson colorimeter (Klett units) and compared to results for wild-type 5448. Data are representative of three independent experiments.
Due to the growth defect that was exhibited by a ΔfruA mutant, we also wanted to ascertain if fruA affects the utilization of other carbon sources. We used Biolog PM1 and PM2A phenotype microarrays (PMs) to monitor the metabolism of 190 different carbon sources of the ΔfruA strain. The parental GAS 5448 and 5448.ΔfruA strains were different in their utilization of 72 carbon sources (data not shown), 3 of which are designated PTS sugars (N-acetyl-d-galactosamine, cellobiose, and mannitol) (Table 4). Surprisingly, fructose was not identified in the Biolog assay as having a defect in metabolism (Table 4). This suggests that there is another PTS transporter that is able to transport fructose, although at levels that do not sustain wild-type growth (Fig. 2B and E; also see Fig. S5 in the supplemental material). To confirm this observation, wild-type 5448 and 5448.ΔfruA strains also were tested using a bioMérieux API 50 strip that tests the utilization of a subset of 50 carbohydrates (Fig. 3). As seen with Biolog, the 5448.ΔfruA strain was able to utilize fructose similarly to 5448 in this assay; however, the fructose utilization is insufficient to support growth. We also tested 5448.ΔfruB and 5448.ΔfruR strains using the API 50 strips. Like the 5448.ΔfruA strain, both the ΔfruR and ΔfruB mutants were able to utilize fructose, even though neither was able to grow on fructose as the sole carbon source (Fig. 3). Taken together, these data suggest that fruA is required for optimal growth on fructose and that FruA is the main fructose transporter for GAS. Since a PTS-defective mutant (ΔptsI) of M1T1 GAS is defective for the utilization of fructose in the Biolog assay (12), there appears to be another PTS EII that is able to transport fructose to be metabolized, albeit not at the levels necessary to support GAS growth on fructose. Finally, the loss of fruA affects the utilization of other carbon sources; however, this is unsurprising, because a ΔptsI mutant also affects the utilization of non-PTS carbon sources through currently unknown mechanisms.
TABLE 4.
Carbon sources with altered utilization
| Carbon sourcea | Result forb: |
|
|---|---|---|
| 5448 | 5448.ΔfruA mutant | |
| N-Acetyl-d-galactosamine | + | +/− |
| d-Cellobiose | + | +/− |
| d-Mannitol | + | +/− |
| d-Galactose | + | + |
| d-Fructose | + | + |
| α-d-Glucose | + | + |
| d-Mannose | + | + |
| Sucrose | + | + |
| α-d-Lactose | + | + |
| Maltose | + | + |
| Salicin | + | + |
| d-Trehalose | + | + |
| β-Methyl-d-glucoside | + | + |
| Maltotriose | + | + |
Only PTS carbon sources are listed.
+, Omnilog value (OV) of >200; +/−, 125 < OV < 200; −, OV < 125. Carbon sources with differences in utilization are set in boldface type.
FIG 3.
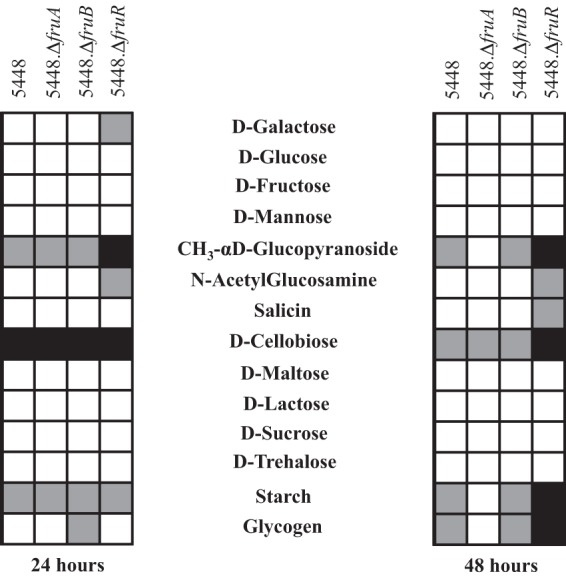
Limited carbohydrate metabolism profile of 5448 and the fru operon mutants. Wild-type 5448 and the 5448.ΔfruA, 5448.ΔfruB, and 5448.ΔfruR mutants were assayed using API 50 CH results after incubation at 37°C for 24 h and 48 h. Listed are select carbon sources from a panel of 49 carbohydrate sources: complete utilization (white boxes), partial utilization (gray boxes), and no utilization (black boxes) based on the colorimetric indicator dye shown for each.
Effect of fructose on sloR.
The RNA-Seq data (Table 3) showed that several members of the SerR regulon (43) were upregulated in fructose, including sloR, the putative streptolysin O regulator (44). In silico analysis of sloR showed nine transmembrane domains that exhibited a high degree of homology to a fructose-specific EIIC. Given that a ΔfruA mutant still could utilize fructose (Table 4 and Fig. 2E and 3; also see Fig. S5 in the supplemental material), we wanted to explore the role of SloR in fructose utilization and transport in addition to confirming its regulation in fructose.
An insertional inactivation mutant of sloR (5448.ΔsloR strain; Table 1) was generated using a temperature-sensitive replicating plasmid. The growth of the 5448.ΔsloR mutant in CDM plus 1% fructose was found to be comparable to that of wild-type 5448 (see Fig. S6B in the supplemental material), suggesting that SloR does not play a role in fructose uptake. We also tested the effect SloR had on the metabolism of other sugar sources using the API 50 assay, and we saw no observable difference between a ΔsloR strain and wild-type 5448 (data not shown). However, the effect of fructose on the induction of sloR was confirmed using qPCR (see Fig. S2, blue bar). Additionally, an expression reporter plasmid was constructed by cloning the promoter of sloR (PsloR) upstream of the firefly luciferase gene (luc), and activity was determined through the quantification of relative luciferase units (LU). A significant increase in PsloR-luciferase activity was observed when cells were grown in fructose compared to sucrose (see Fig. S6A). To rule out that FruR regulates sloR, we also tested sloR transcript levels in a ΔfruR strain grown in fructose and glucose using qPCR and saw no observable difference (data not shown). Taken together, we show that sloR induction is a fructose-specific phenotype; however, this induction is independent of FruR. We also show that sloR is not an alternative transporter of fructose.
FruR is a repressor of the fruRBA operon.
In other streptococci, fruR encodes a putative DeoR-like repressor in the family of carbohydrate regulatory proteins (13, 18, 45). To confirm that FruR is a repressor of the fru operon, we grew wild-type 5448 and the 5448.ΔfruR mutant under both catabolite-repressing (glucose) and -inducing (fructose) conditions in order to isolate RNA for qPCR. Growth in CDM plus 0.5% glucose (Fig. 4A) was successful; however, when fructose was the sole carbon source available, the ΔfruR strain failed to grow (Fig. 2C and 4A). In order to generate appropriate cell density to extract RNA, we applied a modified diauxic growth condition. Both the WT and the ΔfruR strain were grown in CDM plus 0.5% glucose to late logarithmic phase, washed twice, and transferred for growth in either CDM plus 1% fructose or CDM plus 0.5% glucose for 1 h. qPCR was used to determine the effect of the 5448.ΔfruR mutant on the transcription of fruB and fruA using RNA from cells grown in either fructose or glucose. When we compared WT 5448 growth in glucose to that in fructose, we saw an increase in transcript levels across the entire operon (Fig. 4B, black bars), mirroring what we saw in the RNA-Seq results (Table 3). Comparing WT 5448 grown in fructose to the 5448.ΔfruR mutant grown in fructose, an increase in fruB and fruA transcript levels is observed, indicating that FruR acts as a repressor of this operon (Fig. 4B, checkered bars). Furthermore, an even larger increase in transcript levels for fruB and fruA in the 5448.ΔfruR mutant was observed when it was grown in glucose than when it was grown in fructose, indicating that the operon is also under carbon catabolite repression (CCR) (Fig. 4B, diagonal bars).
FIG 4.
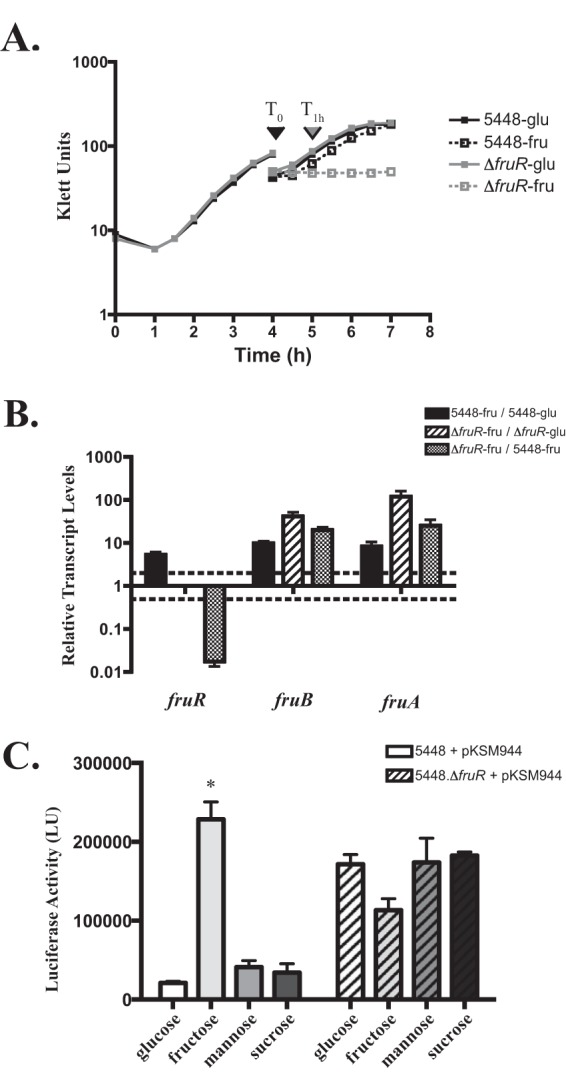
FruR represses expression of the fruRBA operon. (A) Growth of 5448 (black) or the 5448.ΔfruR mutant (gray) strain under modified diauxic conditions. Cells were grown in CDM plus 0.5% glucose (solid line) to late log phase (To), washed, and transferred into CDM with either 0.5% glucose (solid line) or 1% fructose (dashed line). Cells were outgrown for 1 h (T1 h) in either sugar for RNA extraction. (B) Transcript levels of fru operon genes were measured by qRT-PCR with respect to growth condition. 5448 grown in fructose compared to growth in glucose (black bars), the 5448.ΔfruR mutant grown in fructose compared to growth in glucose (diagonal bars), and the 5448.ΔfruR mutant grown in fructose compared to growth in WT 5448 (checkered bars) are shown. Error bars represent the standard errors from two biological replicates. Differences greater than 2-fold in expression for the mutant compared with that of the wild type (denoted by a dashed line) are considered significant. Significance was determined using comparisons of transcript levels relative to those of the gene gyrA. (C) PfruR promoter activity in WT 5448 containing the PfruR-luc luciferase reporter plasmid was grown in CDM containing 0.5% glucose or 1% fructose, mannose, or sucrose. Samples were taken at the mid-logarithmic phase of growth and assayed for luciferase production, expressed in relative luciferase units (LU). Error bars represent means ± standard deviations (SD) of results from three biological replicates performed in triplicate. Significance for panel C was determined by comparison of results for growth in fructose, mannose, or sucrose to those for growth in glucose using an unpaired t test (P ≤ 0.001).
To confirm the role of FruR in the repression of the fru operon, a luciferase reporter assay was performed using the mapped promoter region of the operon (PfruR). A significant increase in luciferase activity was observed only when WT 5448 containing the PfruR-luc construct was grown in CDM plus 1% fructose as opposed to 0.5% glucose or 1% sucrose or mannose (Fig. 4C), indicating the induction of the operon is fructose dependent. When the same assay was performed in the ΔfruR background, there was an overall increase in luciferase activity for all sugars tested (Fig. 4C). Therefore, both FruR and CcpA negatively control the expression of the fru operon, and fructose (after conversion to fructose-1-phosphate) likely acts as an inducer of the operon through inactivation of FruR.
fruB and fruR, but not fruA, are important for 5448 survival in whole human blood.
The fruA gene was identified as being important for GAS survival in whole human blood during a genome-wide TraSH screen (15). To determine the step in fructose utilization that might be involved in GAS survival in blood, we performed Lancefield bactericidal assays on each of the nonpolar fru operon mutants and their respective revertant strains. Interestingly, both 5448.ΔfruR and 5448.ΔfruB strains exhibited decreased survival in whole human blood relative to that of the parental GAS 5448 (Fig. 5A). Surprisingly, the 5448.ΔfruA mutant did not show a significant decrease in survival in human blood, although it trended downward and was variable. The revertant strains for all three mutants showed a restoration of growth comparable to the level for wild-type 5448 (Fig. 5A). Thus, although our TraSH screen had indicated that fruA was needed for GAS survival in human blood (15), our data using defined nonpolar mutants in the fru operon indicate that fruR and fruB are mostly responsible for this phenotype.
FIG 5.

fruR and fruB are important for survival in human blood and phagocytic cells. In all assays, wild-type 5448 (black bars) was compared to 5448.ΔfruR (white bars), 5448.ΔfruB (light gray bars), and 5448.ΔfruA (dark gray bars) mutants for growth and survival. The respective rescued mutant strains are indicated with diagonal lines. (A) Lancefield bactericidal assay was performed by monitoring growth in whole human blood with rotation at 37°C for 3 h. Data are presented as percent growth in blood corresponding to the multiplication factor (MF) of the mutant divided by the MF of the wild type times 100. Error bars represent means ± SD of the results of six independent experiments. (B) Survival in neutrophil-like HL60 cells. GAS (1 × 10⁵ CFU/well) and HL60 cells (1 × 10⁶ CFU/well) were incubated for 2 h at 37°C. Cells were lysed and the percentage of surviving GAS CFU was determined relative to the level of survival for 5448. (C) Survival in human neutrophils (PMNs). GAS (1 × 10⁵ CFU/well) and neutrophils (1 × 10⁶ CFU/well) were incubated for 2 h at 37°C. Neutrophils then were lysed, and the percentage of surviving GAS CFU was determined and is shown as survival relative to that of the WT (5448). (D) Survival in human monocytes. GAS (1 × 10⁵ CFU/well) and human monocytic cells (1 × 10⁶ CFU/well) were incubated for 2 h at 37°C. Cells were lysed, and the percentage of surviving GAS CFU was determined relative to that for survival of 5448. Error bars in panels B to D represent means ± SD of the results from three biological replicates performed in triplicate. Significance for panel A was determined using a Student t test (P ≤ 0.0015), while significance for panels B to D was determined by unpaired t test (P < 0.05).
fruR and fruB are important for GAS 5448 survival in neutrophils and monocytes.
The phenotype exhibited by 5448.ΔfruR and 5448.ΔfruB strains in whole human blood can be attributed to defects in metabolic processes or in immune evasion. To clarify this question, we subjected 5448.ΔfruR and 5448.ΔfruB strains to opsonophagocytic killing assays using the human-derived promyelocytic leukemia cell line HL60 differentiated into neutrophil-like cells (Fig. 5B) and freshly isolated human PMNs (Fig. 5C). Neutrophils are the predominant cell type that act as a first line of defense at the site of infection, and they can kill pathogens through multiple extra- or intracellular means, such as antimicrobial peptides, phagocytosis, and DNA neutrophil extracellular traps (NETs) (46). Both neutrophil-like HL60 cells and human-isolated PMNs were infected using an MOI of 0.1, and strains were plated for survival and compared to the parental 5448. When either the 5448.ΔfruR or 5448.ΔfruB mutant was incubated with HL60 cells, each showed a significant decrease in survival compared to that of 5448 (Fig. 5B). However, the 5448.ΔfruA mutant survived at levels comparable to that of the wild-type GAS. Importantly, 5448.fruRR and 5448.fruBR revertant strains either partially or completely restored the phenotype to wild-type levels (Fig. 5B). These phenotypes were recapitulated with freshly isolated human PMNs (Fig. 5C), supporting a requirement for FruB and FruR, but not FruA, for survival in human neutrophils. There was also a survival defect observed for the 5448.ΔfruR or 5448.ΔfruB mutant, but not the 5448.ΔfruA mutant, in human monocytes, suggesting a role for these fru operon genes in evading killing by different phagocytic cell types (Fig. 5D). To account for a defect in growth for any of the fru operon mutants, we also grew each strain in RPMI plus 20% plasma and saw no growth defect compared to the parental 5448 (see Fig. S7 in the supplemental material). Thus, fruR and fruB, but not fruA, are important for GAS resistance to killing by human neutrophils and primary monocytes.
fruR and fruB phenotypes are not observed in murine models of infection.
Murine models of infection have long been used as the gold standard for simulating disease of human pathogens, with GAS being no exception. The significant reduction in survival of both 5448.ΔfruR and 5448.ΔfruB strains in human blood and phagocytic cells led us to hypothesize that both mutants would show attenuated virulence in mouse models. We first subjected 5448.ΔfruR and 5448.ΔfruB strains to a modified Lancefield bactericidal assay using whole murine blood. Unexpectedly, we found that both 5448.ΔfruR and 5448.ΔfruB mutants did not show a defect for growth in mouse blood, as was seen in human blood (Fig. 6A). To test the impact of the fru operon mutants in vivo, an intraperitoneal (i.p.) murine model of systemic GAS infection was used. Mice were infected i.p. with 4 × 10⁸ CFU/ml of 5448, 5448.ΔfruR, and 5448.ΔfruB strains and monitored three times daily during a 72-h period. Similar to the murine Lancefield bactericidal assay, we did not see a decrease in survival for the 5448.ΔfruR or 5448.ΔfruB mutant compared to survival of the parental 5448 (Fig. 6B). Thus, while fruR and fruB appear to be important for survival against neutrophil and monocyte killing in human blood, they do not affect GAS pathogenesis during murine models of infection. This strongly suggests a species-specific mechanism is involved.
FIG 6.

fruR and fruB mutants do not affect survival in murine models of infection. The 5448.ΔfruR and 5448.ΔfruB mutants were compared to wild-type 5448 in two assays. (A) Survival in a modified Lancefield bactericidal assay using whole mouse blood. The data are presented as percent growth in blood corresponding to the multiplication factor (MF) of the mutant divided by the MF of the wild type times 100. Data represent GAS survival in blood obtained from multiple mice (n = 4 to 6). Error bars represent means ± SD of the results from two independent experiments. Significance was determined using a Student t test (P ≤ 0.0015). (B) Survival in a murine intraperitoneal (i.p.) model of infection. GAS (∼4 × 10⁸ CFU/mouse) was injected i.p. into mice (n = 10/strain), which were monitored for morbidity over the course of 72 h. Significance was determined using Kaplan-Meier survival analysis and log-rank test.
DISCUSSION
The current study was undertaken to assess the importance of fructose utilization in GAS pathogenesis. Our results reveal a fructose-induced fruRBA operon that was found to be required for the growth of GAS in fructose and implicate FruA as the primary transporter of fructose in GAS. FruR acts as a repressor at the fru operon promoter, likely along with CcpA, to allow for fructose induction of the system. Mutants lacking fruR and fruB, but not fruA, were found to be sensitive to survival in whole human blood and phagocytic killing by neutrophils and monocytes. Interestingly, neither mutant was found to be required for survival in murine blood or for virulence in a murine model of systemic infection. Thus, fruRBA plays a key role in both GAS metabolism and pathogenesis, revealing a mechanism by which this human pathogen can sense its nutritional environment during infection and link this status to evading the host innate immune response.
Fructose-induced regulon of GAS.
Metabolic genes for utilization of alternative (nonglucose) sugars typically are induced only during times of low glucose (derepression of CCR) and in the presence of the inducing sugar. For pathogenic streptococci and related low-G+C Gram-positive bacteria, a genome-wide fructose-induced regulon previously has been determined only for Streptococcus mutans and the probiotic Lactobacillus acidophilus (47, 48). In S. mutans, microarray analysis revealed 68 genes (3.5% of genome) that were differentially expressed at least 2-fold in fructose compared to expression in glucose, whereas a similar analysis in L. acidophilus found that 110 genes (6% of the genome) were regulated. Our RNA-Seq analysis discovered that growth of GAS in CDM with fructose affected the transcription of roughly 5.5% of the nonprophage genome (102 genes) compared to growth in glucose (Table 3; also see Table S1 in the supplemental material). This is in line with what was observed in both L. acidophilus and S. mutans, highlighting a fairly focused fructose-specific response in these cells.
The most highly fructose-induced genes in GAS were fruRBA, followed by several other sugar-specific PTS operons, such as lacD.1 and lacD.2. The comparable L. acidophilus fruRBA genes also were highly induced by fructose (48). In contrast, the S. mutans genes for fruRBA (Smu.0870-72) were constitutively expressed, and a separate mannose/fructose family PTS was found to be inducible (47). There are three potential mechanisms by which fructose could enter GAS. (i) The predominant pathway in Gram-positive bacteria involves the canonical PTSfru EIIABC (fruA-fruI), a 1-phosphofructokinase (fruB-fruK), and a fructose-responsive regulator (fruR). (ii) An alternate PTS recognizes and translocates fructose as fructose-6-phosphate (F6P) with lower affinities than those of pathway i. (iii) Facilitated diffusion transport using a membrane-spanning permease would esterify free fructose at position 6 using ATP (49). The induction of fruRBA by fructose in GAS suggests pathway i is the main pathway; however, the induction of other PTSs (e.g., lacD.1 and lacD.2) suggests that pathway ii also plays a role in fructose utilization. This is supported by the fact that mutants lacking any of the fruRBA genes still are able to metabolize fructose (Fig. 3 and Table 4), albeit not to a level that supports growth (Fig. 2; also see Fig. S5 in the supplemental material). Thus, the role of other PTS operons in the utilization of fructose will need to be explored further.
We also observed an increase in the expression of genes in the serine catabolism regulon, including sloR, sdhAB, and ntpA-K (43). We further validated the fructose induction of sloR expression via qPCR (see Fig. S2 in the supplemental material) and through promoter-luciferase fusions (see Fig. S6A). SloR initially was implicated in streptolysin O expression (44), but more recently it was shown to be involved in serine acquisition (43). However, SloR shows significant homology to a fructose EIIC transporter (50), suggesting that it plays a role in the transport of fructose (pathway ii described above, i.e., intake as F6P) and potentially aids in signal transduction to coordinate gene expression. However, a sloR mutant did not show any significant effect on the utilization of fructose or any other PTS sugar by GAS (see Fig. S6B). In other Streptococcus and Listeria species, orphan EIICs have been suggested to act as environmental sensors that interact with other regulatory proteins to influence gene expression (51, 52). It is possible that SloR serves a similar sensory role in GAS, and this hypothesis is being explored.
Interestingly, we also observed three virulence-related genes to be upregulated in a fructose environment. These genes (and the proteins that they encode) are M5005_spy_0798 (interferon [IFN] response binding factor 1), M5005_spy_1629 (lantibiotic transport ATP-binding protein SalX), and M5005_spy_1631 (lantibiotic salivaricin A) (Table 3; also see Table S1 in the supplemental material). While these genes may be related to the virulence phenotype exhibited by fruR-fruB in either the Lancefield or PMN killing assays, we are less confident that this is the actual contributing factor(s) of the phenotype. This is due in part to the fact that these genes are observed to be upregulated in the fructose environment and also may be regulated only by the presence of fructose, independent of virulence. The neutrophil/whole-blood environment is different from that of CDM plus fructose/glucose; therefore, the transcriptome results generated in CDM are not necessarily representative of the ex vivo environments. Therefore, while the regulation of these genes is fructose dependent, it is not necessarily fruR-fruB dependent, and this is being investigated further. Overall, we feel that our RNA-Seq data support our stated hypothesis that the virulence defect is attributed to a signaling effect due to the feedback of fruB-fruR.
Role of the fruRBA operon in fructose metabolism. (i) FruA.
The GAS M1T1 genome is predicted to encode 14 sugar-specific EII translocation components of the PTS. Functional characterization of only 1 of these putative EIIs has been carried out, resulting in the predicted function in glucose import (PTSGlu) being corrected to an experimentally validated role in maltose uptake (PTSMal) (17). Therefore, homology and subsequent annotation do not necessarily follow functionality. This is the first study in GAS characterizing fructose utilization and the contribution of the fruRBA operon, confirming its annotated role in fructose metabolism. We found that an in-frame mutant of fruA (5448.ΔfruA strain), encoding the putative PTS EIIABC, exhibited a significant growth defect compared to the WT (5448), but it did show some residual growth on fructose (Fig. 2 and 3; also see Fig. S4 in the supplemental material). Nonpolar mutants of fruB (5448.ΔfruB strain), encoding 1-phosphofructokinase, and fruR (5448.ΔfruR strain), a putative repressor, also showed a comparable defect in growth on fructose, confirming that the entire fru operon is necessary for fructose utilization in GAS. As mentioned above, the residual growth and utilization of fructose may involve other PTS EII pathways (Fig. 3 and Table 4). However, since fruRBA is the only operon in the 5448 genome that encodes a 1-phosphofructokinase (M5005_Spy_0061; FruB), it strongly suggests that this operon, through FruA, is the primary operon for fructose transport utilization (53). This has been observed in several other Gram-positive bacterial species (13, 18, 45, 54).
(ii) FruR.
The DeoR-family transcriptional regulator FruR is directly involved in the repression of the fru operon in L. lactis (18) and other Gram-positive bacteria (13, 45, 54). Through transcriptional analysis of the 5448.ΔfruR mutant and its 5448.ΔfruRR rescue strain, we demonstrated that FruR represses the transcription of the fruRBA operon through the fru promoter (Pfru) and that the promoter is required for fructose induction (Fig. 4). Furthermore, the expression of the operon exhibits evidence of CCR, likely through a CcpA-mediated CCR mechanism. In silico analysis of the fruR promoter region identified the presence of a putative FruR binding site (18) upstream of the −35 hexamer and a catabolite response element (cre) site for CcpA binding (9–11) overlapping the start of transcription (Fig. 1). The physiological inducer of FruR derepression is fructose-1-phosphate (F1P), and only 1 mM F1P is sufficient to disrupt FruR binding to its operator in Pseudomonas putida (55, 56). Fructose-1-phosphate is also the inducer of the fruRBA operon in other Gram-positive species, such as L. lactis (18). This correlates with FruR being a member of the DeoR family of repressors, which typically are induced by sugar phosphates produced by the regulatory pathway they control (2, 13, 18).
(iii) FruB.
1-Phosphofructokinase (fruB) converts imported F1P to fructose-1,6-bisphosphate (FBP), and our data show that it is also necessary for GAS growth on fructose (Fig. 2). This is likely due to the fact that the fruB mutant (5448.ΔfruB strain) would be expected to build up F1P due to an inability to convert it to FBP following transport by FruA. Since the majority of intracellular fructose cannot be further metabolized, the gluconeogenesis of FBP for glycolysis would be blocked, resulting in growth arrest. The fruB mutant (5448.ΔfruB strain) also exhibited a small-colony phenotype when plated on blood agar (see Fig. S4 in the supplemental material) and showed a slightly longer doubling time than the parental 5448 and its 5448.ΔfruBR revertant, implicating this enzyme in playing a role outside the conversion of F1P to FBP (discussed below). Although other PTS EII pathways exist in GAS that allow for the transport of fructose as F6P, as demonstrated by both the RNA-Seq and Biolog/API 50 CH metabolic data (Tables 3 and 4 and Fig. 3; also see Table S1), the efficiency of transport is not able to support growth. In addition, when fructose is transported by alternative PTSs (pathway ii described above), a 6-phosphofructokinase (pfkA) enzyme would need to be present to convert F6P to FBP (49). However, pfkA was not upregulated when GAS was grown in fructose as the sole carbon source (Table 3; also see Table S1).
Role of FruR and FruB in innate immune evasion.
We initially had found fruA, the final gene in the fru operon, to be necessary for survival of GAS in whole human blood using a genome-wide TraSH screen (15). However, in the current study, nonpolar defined GAS mutants of fruR and fruB, but not fruA, exhibited a significant survival defect in whole human blood as well as within neutrophil-like HL60 cells, human neutrophils, and peripheral blood monocytic cells (PBMCs) (Fig. 5). One possible explanation for the lack of a fruA phenotype here is that TraSH screens are based on large libraries of mutants that must compete to survive. Therefore, fruA may only show a defect in blood survival and killing by phagocytes in a competitive environment. In addition, the TraSH screen relied on a GAS oligonucleotide microarray that was found to miss almost 40% of the genome due to technical limitations of hybridization and array probes. This may explain why we did not find fruB or fruA in the same screen. Regardless, fruA was not found to be important for GAS survival in human blood or neutrophils in this study, which suggests that this phenotype is not linked to fructose uptake and phosphorylation.
Since a fruB mutant (5448.ΔfruB strain) is defective for survival in whole blood and human-derived phagocytic cells (Fig. 5), it appears that 1-phosphofructokinase enzymatic activity (F1P conversion to FBP) is crucial for GAS to evade the innate immune response through an undefined mechanism. It could simply be that the buildup of F1P triggers a downstream regulatory cascade that influences genes important for resistance to phagocytic killing. However, FruB may play a more direct role. The GAS LacD.1 tagatose-1,6-bisphosphate aldolase enzyme has been adapted to play a regulatory role in controlling the expression of the SpeB exotoxin through interacting with the transcriptional regulator RopB (8). LacD.1 still functions as an aldolase, although it is not the preferred aldolase used in galactose metabolism in GAS (57). Therefore, a metabolically functional enzyme can play a regulatory role via indirect interaction with regulatory proteins. The mechanism by which FruB impacts immune evasion currently is being investigated.
FruR, which also exhibits decreased survival in whole human blood and phagocytic killing, likely contributes to this phenotype through its regulation of fruB. Although there is an increase in fruB transcript levels (Fig. 4B), and presumably FruB protein levels, in a ΔfruR mutant, it is still sensitive to phagocytic killing (Fig. 5). These data suggest that there is a stoichiometry effect in the cell that leads to a similar defect in immune evasion. In silico analysis of the MGAS5005 genome shows that a consensus FruR binding site (18) only occurs once in the genome, upstream of FruR. Therefore, it is unlikely that FruR directly affects the transcription of genes beyond the fruRBA operon.
fruRB-mediated immune evasion is specific to the human host environment.
Although fruR and fruB GAS mutants were defective for survival in human blood and phagocytes (Fig. 5), we saw no growth defects in whole mouse blood or any attenuation in a mouse model of systemic GAS infection (Fig. 6). This strongly suggests that the fruRB-mediated mechanism of innate immune evasion is highly adapted to its human host. Recapitulation of human disease in a susceptible laboratory animal has been the gold standard for pathogenesis since the inception of Koch's postulates. Host-pathogen research has favored mouse models due to reduced cost, reproducibility, and availability of reagents, among others. However, this poses a challenge with testing human-restricted pathogens in mice, where striking differences in the immune system between these two species can lead to varied disease progression. Immune system differences can lead to misleading results, as has been seen using mouse models to identify protective antigens for an S. aureus vaccine, where identified targets in mice have not been a good predictor of outcomes in human clinical trials (58). Of particular note, the composition of blood between the two species is quite different; human blood is neutrophil rich (50 to 70% of blood), whereas mouse blood has more circulating lymphocytes and fewer neutrophils (10 to 25% of blood) (59).
While mice have been used extensively for studying GAS pathogenesis, there are aspects related to species specificity that have been problematic for disease modeling. GAS is able to produce a wide range of disease severities in different mouse strains, causing different strains of mice to be either better or worse models for simulating GAS infections (60). To elicit disease in a mouse, the inocula required often are several times larger than what would be needed in humans. It also can be difficult to reiterate certain GAS diseases in mice. Mice do not elicit symptoms of GAS pharyngitis (strep throat) when infected intranasally or in the pharynx directly. An in vivo model of streptococcal impetigo, one of the most prevalent forms of noninvasive disease (4), required the grafting of human foreskin onto huSCID mice (61). Known GAS virulence factors, such as streptokinase (62, 63) and protein H (64, 65), were not testable until the development of humanized mice expressing either human plasminogen (66) or human C4BP/factor H (67). Additionally, murine T cells appear not to proliferate and respond to GAS superantigens such as SMEZ, SpeG, or SpeC, while human T cells do (68). It appears that coevolution between the human immune system and GAS has resulted in adaptation to its natural host environment. Whether 1-phosphofructokinase (FruB) directly senses a human-specific environmental stimulus, leading to downstream virulence gene regulation, or whether its presence merely results in the signal remains to be determined. However, it is clear that GAS possesses a link between fructose metabolism and regulation of immune evasion molecules that are important during human infections.
Supplementary Material
ACKNOWLEDGMENTS
We thank Suwei Zhao at the IBBR Next-Generation Sequencing Core and Yan Wang of the CMNS Genomics Core at the University of Maryland for technical assistance in Illumina sequencing and qPCR analysis, respectively.
This work was supported by a grant from the NIH National Institute of Allergy and Infectious Diseases (AI047928) to K.S.M. and in part by an NIH F31 predoctoral fellowship (AI100576 to K.M.V.). G.S.S. was supported in part by an NIH T32 training grant (AI089621) on host-pathogen interactions. L.A.V. was supported in part by a diversity and health-related supplement (AI047928-13S1). N.M.E. and A.T.B. were supported by an NIH NIAID grant (AI094773).
K.M.V., G.S.S., L.A.V., Y.L.B., and K.S.M. conceived and designed the research plan, K.M.V., G.S.S., L.A.V., E.I., and Y.L.B. performed the research, A.T.B. and N.M.E. performed the RNA-Seq bioinformatic analysis, and R.B. provided expertise and access to Biolog. K.M.V., G.S.S., Y.L.B., and K.S.M. wrote the paper.
Funding Statement
HHS | NIH | National Institute of Allergy and Infectious Diseases (NIAID) provided funding to Kevin S. McIver under grant number AI047298. HHS | NIH | National Institute of Allergy and Infectious Diseases (NIAID) provided funding to Kayla M. Valdes under fellowship number AI100576. HHS | NIH | National Institute of Allergy and Infectious Diseases (NIAID) provided supplemental funding to Luis A. Vega and Kevin S. McIver under grant number AI047298-13S1. HHS | NIH | National Institute of Allergy and Infectious Diseases (NIAID) provided funding to Ganesh S. Sundar under training grant number AI089621. HHS | NIH | National Institute of Allergy and Infectious Diseases (NIAID) provided funding to Ashton T. Belew and Najib M. El-Sayed under grant number AI094773.
Footnotes
Supplemental material for this article may be found at http://dx.doi.org/10.1128/IAI.01296-15.
REFERENCES
- 1.Gorke B, Stulke J. 2008. Carbon catabolite repression in bacteria: many ways to make the most out of nutrients. Nat Rev Microbiol 6:613–624. doi: 10.1038/nrmicro1932. [DOI] [PubMed] [Google Scholar]
- 2.Deutscher J, Francke C, Postma PW. 2006. How phosphotransferase system-related protein phosphorylation regulates carbohydrate metabolism in bacteria. Microbiol Mol Biol Rev 70:939–1031. doi: 10.1128/MMBR.00024-06. [DOI] [PMC free article] [PubMed] [Google Scholar]
- 3.Deutscher J, Herro R, Bourand A, Mijakovic I, Poncet S. 2005. P-Ser-HPr–a link between carbon metabolism and the virulence of some pathogenic bacteria. Biochim Biophys Acta 1754:118–125. doi: 10.1016/j.bbapap.2005.07.029. [DOI] [PubMed] [Google Scholar]
- 4.Carapetis JR, Steer AC, Mulholland EK, Weber M. 2005. The global burden of group A streptococcal diseases. Lancet Infect Dis 5:685–694. doi: 10.1016/S1473-3099(05)70267-X. [DOI] [PubMed] [Google Scholar]
- 5.Bisno AL, Brito MO, Collins CM. 2003. Molecular basis of group A streptococcal virulence. Lancet Infect Dis 3:191–200. doi: 10.1016/S1473-3099(03)00576-0. [DOI] [PubMed] [Google Scholar]
- 6.Cunningham MW. 2000. Pathogenesis of group A streptococcal infections. Clin Microbiol Rev 13:470–511. doi: 10.1128/CMR.13.3.470-511.2000. [DOI] [PMC free article] [PubMed] [Google Scholar]
- 7.Hondorp ER, Hou SC, Hause LL, Gera K, Lee CE, McIver KS. 2013. PTS phosphorylation of Mga modulates regulon expression and virulence in the group A streptococcus. Mol Microbiol 88:1176–1193. doi: 10.1111/mmi.12250. [DOI] [PMC free article] [PubMed] [Google Scholar]
- 8.Loughman JA, Caparon MG. 2006. A novel adaptation of aldolase regulates virulence in Streptococcus pyogenes. EMBO J 25:5414–5422. doi: 10.1038/sj.emboj.7601393. [DOI] [PMC free article] [PubMed] [Google Scholar]
- 9.Kinkel TL, McIver KS. 2008. CcpA-mediated repression of streptolysin S expression and virulence in the group A streptococcus. Infect Immun 76:3451–3463. doi: 10.1128/IAI.00343-08. [DOI] [PMC free article] [PubMed] [Google Scholar]
- 10.Shelburne SA III, Keith D, Horstmann N, Sumby P, Davenport MT, Graviss EA, Brennan RG, Musser JM. 2008. A direct link between carbohydrate utilization and virulence in the major human pathogen group A Streptococcus. Proc Natl Acad Sci U S A 105:1698–1703. doi: 10.1073/pnas.0711767105. [DOI] [PMC free article] [PubMed] [Google Scholar]
- 11.Kietzman CC, Caparon MG. 2010. CcpA and LacD.1 affect temporal regulation of Streptococcus pyogenes virulence genes. Infect Immun 78:241–252. doi: 10.1128/IAI.00746-09. [DOI] [PMC free article] [PubMed] [Google Scholar]
- 12.Gera K, Le T, Jamin R, Eichenbaum Z, McIver KS. 2014. The phosphoenolpyruvate phosphotransferase system in group A streptococcus acts to reduce streptolysin S activity and lesion severity during soft tissue infection. Infect Immun 82:1192–1204. doi: 10.1128/IAI.01271-13. [DOI] [PMC free article] [PubMed] [Google Scholar]
- 13.Loo CY, Mitrakul K, Voss IB, Hughes CV, Ganeshkumar N. 2003. Involvement of an inducible fructose phosphotransferase operon in Streptococcus gordonii biofilm formation. J Bacteriol 185:6241–6254. doi: 10.1128/JB.185.21.6241-6254.2003. [DOI] [PMC free article] [PubMed] [Google Scholar]
- 14.Pridgeon JW, Li Y, Yildirim-Aksoy M, Song L, Klesius PH, Srivastava KK, Reddy PG. 2013. Fitness cost, gyrB mutation, and absence of phosphotransferase system fructose specific IIABC component in novobiocin-resistant Streptococcus iniae vaccine strain ISNO. Vet Microbiol 165:384–391. doi: 10.1016/j.vetmic.2013.04.001. [DOI] [PubMed] [Google Scholar]
- 15.Le Breton Y, Mistry P, Valdes KM, Quigley J, Kumar N, Tettelin H, McIver KS. 2013. Genome-wide identification of genes required for fitness of group A streptococcus in human blood. Infect Immun 81:862–875. doi: 10.1128/IAI.00837-12. [DOI] [PMC free article] [PubMed] [Google Scholar]
- 16.Sachla AJ, Le Breton Y, Akhter F, McIver KS, Eichenbaum Z. 2014. The crimson conundrum: heme toxicity and tolerance in GAS. Front Cell Infect Microbiol 4:159. [DOI] [PMC free article] [PubMed] [Google Scholar]
- 17.Shelburne SA III, Keith DB, Davenport MT, Horstmann N, Brennan RG, Musser JM. 2008. Molecular characterization of group A Streptococcus maltodextrin catabolism and its role in pharyngitis. Mol Microbiol 69:436–452. doi: 10.1111/j.1365-2958.2008.06290.x. [DOI] [PMC free article] [PubMed] [Google Scholar]
- 18.Barriere C, Veiga-da-Cunha M, Pons N, Guedon E, van Hijum SA, Kok J, Kuipers OP, Ehrlich DS, Renault P. 2005. Fructose utilization in Lactococcus lactis as a model for low-GC gram-positive bacteria: its regulator, signal, and DNA-binding site. J Bacteriol 187:3752–3761. doi: 10.1128/JB.187.11.3752-3761.2005. [DOI] [PMC free article] [PubMed] [Google Scholar]
- 19.Chatellier S, Ihendyane N, Kansal RG, Khambaty F, Basma H, Norrby-Teglund A, Low DE, McGeer A, Kotb M. 2000. Genetic relatedness and superantigen expression in group A streptococcus serotype M1 isolates from patients with severe and nonsevere invasive diseases. Infect Immun 68:3523–3534. doi: 10.1128/IAI.68.6.3523-3534.2000. [DOI] [PMC free article] [PubMed] [Google Scholar]
- 20.Sumby P, Porcella SF, Madrigal AG, Barbian KD, Virtaneva K, Ricklefs SM, Sturdevant DE, Graham MR, Vuopio-Varkila J, Hoe NP, Musser JM. 2005. Evolutionary origin and emergence of a highly successful clone of serotype M1 group A streptococcus involved multiple horizontal gene transfer events. J Infect Dis 192:771–782. doi: 10.1086/432514. [DOI] [PubMed] [Google Scholar]
- 21.Le Breton Y, McIver KS. 2013. Genetic manipulation of Streptococcus pyogenes (the group A streptococcus, GAS). Curr Prot Microbiol 9D:3.1. [DOI] [PMC free article] [PubMed] [Google Scholar]
- 22.Hanahan D, Meselson M. 1983. Plasmid screening at high colony density. Methods Enzymol 100:333–342. doi: 10.1016/0076-6879(83)00066-X. [DOI] [PubMed] [Google Scholar]
- 23.Rose RE. 1988. The nucleotide sequence of pACYC184. Nucleic Acids Res 16:355. doi: 10.1093/nar/16.1.355. [DOI] [PMC free article] [PubMed] [Google Scholar]
- 24.Ribardo DA, Lambert TJ, McIver KS. 2004. Role of Streptococcus pyogenes two-component response regulators in the temporal control of Mga and the Mga-regulated virulence gene emm. Infect Immun 72:3668–3673. doi: 10.1128/IAI.72.6.3668-3673.2004. [DOI] [PMC free article] [PubMed] [Google Scholar]
- 25.Leday TV, Gold KM, Kinkel TL, Roberts SA, Scott JR, McIver KS. 2008. TrxR, a new CovR-repressed response regulator that activates the Mga virulence regulon in group A Streptococcus. Infect Immun 76:4659–4668. doi: 10.1128/IAI.00597-08. [DOI] [PMC free article] [PubMed] [Google Scholar]
- 26.Bolger AM, Lohse M, Usadel B. 2014. Trimmomatic: a flexible trimmer for Illumina sequence data. Bioinformatics 30:2114–2120. doi: 10.1093/bioinformatics/btu170. [DOI] [PMC free article] [PubMed] [Google Scholar]
- 27.Langmead B. 2010. Aligning short sequencing reads with Bowtie. Curr Prot Bioinformatics Chapter 11:Unit 11.7. doi: 10.1002/0471250953.bi1107s32. [DOI] [PMC free article] [PubMed] [Google Scholar]
- 28.Langmead B, Salzberg SL. 2012. Fast gapped-read alignment with Bowtie 2. Nat Methods 9:357–359. doi: 10.1038/nmeth.1923. [DOI] [PMC free article] [PubMed] [Google Scholar]
- 29.Trapnell C, Roberts A, Goff L, Pertea G, Kim D, Kelley DR, Pimentel H, Salzberg SL, Rinn JL, Pachter L. 2012. Differential gene and transcript expression analysis of RNA-seq experiments with TopHat and Cufflinks. Nat Protoc 7:562–578. doi: 10.1038/nprot.2012.016. [DOI] [PMC free article] [PubMed] [Google Scholar]
- 30.Li H, Handsaker B, Wysoker A, Fennell T, Ruan J, Homer N, Marth G, Abecasis G, Durbin R. 2009. The sequence alignment/map format and SAMtools. Bioinformatics 25:2078–2079. doi: 10.1093/bioinformatics/btp352. [DOI] [PMC free article] [PubMed] [Google Scholar]
- 31.Anders S, Pyl PT, Huber W. 2015. HTSeq–a Python framework to work with high-throughput sequencing data. Bioinformatics 31:166–169. doi: 10.1093/bioinformatics/btu638. [DOI] [PMC free article] [PubMed] [Google Scholar]
- 32.Robinson JT, Thorvaldsdóttir H, Winckler W, Guttman M, Lander ES, Getz G, Mesirov JP. 2011. Integrative genomics viewer. Nat Biotechnol 29:24–26. doi: 10.1038/nbt.1754. [DOI] [PMC free article] [PubMed] [Google Scholar]
- 33.Ritchie ME, Phipson B, Wu D, Hu Y, Law CW, Shi W, Smyth GK. 2015. Limma powers differential expression analyses for RNA-sequencing and microarray studies. Nucleic Acids Res 43:e47. doi: 10.1093/nar/gkv007. [DOI] [PMC free article] [PubMed] [Google Scholar]
- 34.Krzywinski M, Schein J, Birol I, Connors J, Gascoyne R, Horsman D, Jones SJ, Marra MA. 2009. Circos: an information aesthetic for comparative genomics. Genom Res 19:1639–1645. doi: 10.1101/gr.092759.109. [DOI] [PMC free article] [PubMed] [Google Scholar]
- 35.Ogata H, Goto S, Sato K, Fujibuchi W, Bono H, Kanehisa M. 1999. KEGG: Kyoto encyclopedia of genes and genomes. Nucleic Acids Res 27:29–34. doi: 10.1093/nar/27.1.29. [DOI] [PMC free article] [PubMed] [Google Scholar]
- 36.Young MD, Wakefield MJ, Smyth GK, Oshlack A. 2010. Gene ontology analysis for RNA-seq: accounting for selection bias. Genome Biol 11:R14. doi: 10.1186/gb-2010-11-2-r14. [DOI] [PMC free article] [PubMed] [Google Scholar]
- 37.Yu G, Wang LG, Han Y, He QY. 2012. clusterProfiler: an R package for comparing biological themes among gene clusters. OMICS 16:284–287. doi: 10.1089/omi.2011.0118. [DOI] [PMC free article] [PubMed] [Google Scholar]
- 38.Beissbarth T, Speed TP. 2004. GOstat: find statistically overrepresented gene ontologies within a group of genes. Bioinformatics 20:1464–1465. doi: 10.1093/bioinformatics/bth088. [DOI] [PubMed] [Google Scholar]
- 39.Alexa A, Rahnenfuhrer J, Lengauer T. 2006. Improved scoring of functional groups from gene expression data by decorrelating GO graph structure. Bioinformatics 22:1600–1607. doi: 10.1093/bioinformatics/btl140. [DOI] [PubMed] [Google Scholar]
- 40.Sung K, Khan SA, Nawaz MS, Khan AA. 2003. A simple and efficient Triton X-100 boiling and chloroform extraction method of RNA isolation from Gram-positive and Gram-negative bacteria. FEMS Microbiol Lett 229:97–101. doi: 10.1016/S0378-1097(03)00791-2. [DOI] [PubMed] [Google Scholar]
- 41.Lancefield RC. 1957. Differentiation of group A streptococci with a common R antigen into three serological types, with special reference to the bactericidal test. J Exp Med 106:525–544. doi: 10.1084/jem.106.4.525. [DOI] [PMC free article] [PubMed] [Google Scholar]
- 42.National Research Council. 2011. Guide for the care and use of laboratory animals, 8th ed National Academies Press, Washington, DC. [Google Scholar]
- 43.LaSarre B, Federle MJ. 2011. Regulation and consequence of serine catabolism in Streptococcus pyogenes. J Bacteriol 193:2002–2012. doi: 10.1128/JB.01516-10. [DOI] [PMC free article] [PubMed] [Google Scholar]
- 44.Savic DJ, McShan WM, Ferretti JJ. 2002. Autonomous expression of the slo gene of the bicistronic nga-slo operon of Streptococcus pyogenes. Infect Immun 70:2730–2733. doi: 10.1128/IAI.70.5.2730-2733.2002. [DOI] [PMC free article] [PubMed] [Google Scholar]
- 45.Wen ZT, Browngardt C, Burne RA. 2001. Characterization of two operons that encode components of fructose-specific enzyme II of the sugar:phosphotransferase system of Streptococcus mutans. FEMS Microbiol Lett 205:337–342. doi: 10.1111/j.1574-6968.2001.tb10969.x. [DOI] [PubMed] [Google Scholar]
- 46.Kolaczkowska E, Kubes P. 2013. Neutrophil recruitment and function in health and inflammation. Nat Rev Immunol 13:159–175. doi: 10.1038/nri3399. [DOI] [PubMed] [Google Scholar]
- 47.Ajdic D, Pham VT. 2007. Global transcriptional analysis of Streptococcus mutans sugar transporters using microarrays. J Bacteriol 189:5049–5059. doi: 10.1128/JB.00338-07. [DOI] [PMC free article] [PubMed] [Google Scholar]
- 48.Barrangou R, Azcarate-Peril MA, Duong T, Conners SB, Kelly RM, Klaenhammer TR. 2006. Global analysis of carbohydrate utilization by Lactobacillus acidophilus using cDNA microarrays. Proc Natl Acad Sci U S A 103:3816–3821. doi: 10.1073/pnas.0511287103. [DOI] [PMC free article] [PubMed] [Google Scholar]
- 49.Kornberg HL. 2001. Routes for fructose utilization by Escherichia coli. J Mol Microbiol Biotechnol 3:355–359. [PubMed] [Google Scholar]
- 50.Kelley LA, Sternberg MJ. 2009. Protein structure prediction on the Web: a case study using the Phyre server. Nat Protoc 4:363–371. doi: 10.1038/nprot.2009.2. [DOI] [PubMed] [Google Scholar]
- 51.Van den Bogert B, Boekhorst J, Herrmann R, Smid EJ, Zoetendal EG, Kleerebezem M. 2013. Comparative genomics analysis of Streptococcus isolates from the human small intestine reveals their adaptation to a highly dynamic ecosystem. PLoS One 8:e83418. doi: 10.1371/journal.pone.0083418. [DOI] [PMC free article] [PubMed] [Google Scholar]
- 52.Kreft J, Vazquez-Boland JA. 2001. Regulation of virulence genes in Listeria. Int J Med Microbiol 291:145–157. doi: 10.1078/1438-4221-00111. [DOI] [PubMed] [Google Scholar]
- 53.Ferenci T, Kornberg HL. 1971. Role of fructose-1,6-diphosphatase in fructose utilization by Escherichia coli. FEBS Lett 14:360–363. doi: 10.1016/0014-5793(71)80301-0. [DOI] [PubMed] [Google Scholar]
- 54.Voigt C, Bahl H, Fischer RJ. 2014. Identification of PTS(Fru) as the major fructose uptake system of Clostridium acetobutylicum. Appl Microbiol Biotechnol 98:7161–7172. doi: 10.1007/s00253-014-5809-1. [DOI] [PubMed] [Google Scholar]
- 55.Chavarria M, Durante-Rodriguez G, Krell T, Santiago C, Brezovsky J, Damborsky J, de Lorenzo V. 2014. Fructose 1-phosphate is the one and only physiological effector of the Cra (FruR) regulator of Pseudomonas putida. FEBS Open Biol 4:377–386. doi: 10.1016/j.fob.2014.03.013. [DOI] [PMC free article] [PubMed] [Google Scholar]
- 56.Chavarria M, Santiago C, Platero R, Krell T, Casasnovas JM, de Lorenzo V. 2011. Fructose 1-phosphate is the preferred effector of the metabolic regulator Cra of Pseudomonas putida. J Biol Chem 286:9351–9359. doi: 10.1074/jbc.M110.187583. [DOI] [PMC free article] [PubMed] [Google Scholar]
- 57.Loughman JA, Caparon MG. 2007. Comparative functional analysis of the lac operons in Streptococcus pyogenes. Mol Microbiol 64:269–280. doi: 10.1111/j.1365-2958.2007.05663.x. [DOI] [PubMed] [Google Scholar]
- 58.Kim HK, Missiakas D, Schneewind O. 2014. Mouse models for infectious diseases caused by Staphylococcus aureus. J Immunol Methods 410:88–99. doi: 10.1016/j.jim.2014.04.007. [DOI] [PMC free article] [PubMed] [Google Scholar]
- 59.Mestas J, Hughes CC. 2004. Of mice and not men: differences between mouse and human immunology. J Immunol 172:2731–2738. doi: 10.4049/jimmunol.172.5.2731. [DOI] [PubMed] [Google Scholar]
- 60.Medina E, Lengeling A. 2005. Genetic regulation of host responses to group A streptococcus in mice. Brief Funct Genomics Proteomics 4:248–257. doi: 10.1093/bfgp/4.3.248. [DOI] [PubMed] [Google Scholar]
- 61.Scaramuzzino DA, McNiff JM, Bessen DE. 2000. Humanized in vivo model for streptococcal impetigo. Infect Immun 68:2880–2887. doi: 10.1128/IAI.68.5.2880-2887.2000. [DOI] [PMC free article] [PubMed] [Google Scholar]
- 62.Gladysheva IP, Turner RB, Sazonova IY, Liu L, Reed GL. 2003. Coevolutionary patterns in plasminogen activation. Proc Natl Acad Sci U S A 100:9168–9172. doi: 10.1073/pnas.1631716100. [DOI] [PMC free article] [PubMed] [Google Scholar]
- 63.Khil J, Im M, Heath A, Ringdahl U, Mundada L, Cary Engleberg N, Fay WP. 2003. Plasminogen enhances virulence of group A streptococci by streptokinase-dependent and streptokinase-independent mechanisms. J Infect Dis 188:497–505. doi: 10.1086/377100. [DOI] [PubMed] [Google Scholar]
- 64.Accardo P, Sanchez-Corral P, Criado O, Garcia E, Rodriguez de Cordoba S. 1996. Binding of human complement component C4b-binding protein (C4BP) to Streptococcus pyogenes involves the C4b-binding site. J Immunol 157:4935–4939. [PubMed] [Google Scholar]
- 65.McArthur JD, Walker MJ. 2006. Domains of group A streptococcal M protein that confer resistance to phagocytosis, opsonization and protection: implications for vaccine development. Mol Microbiol 59:1–4. doi: 10.1111/j.1365-2958.2005.04967.x. [DOI] [PubMed] [Google Scholar]
- 66.Sun H, Ringdahl U, Homeister JW, Fay WP, Engleberg NC, Yang AY, Rozek LS, Wang X, Sjobring U, Ginsburg D. 2004. Plasminogen is a critical host pathogenicity factor for group A streptococcal infection. Science 305:1283–1286. doi: 10.1126/science.1101245. [DOI] [PubMed] [Google Scholar]
- 67.Ermert D, Shaughnessy J, Joeris T, Kaplan J, Pang CJ, Kurt-Jones EA, Rice PA, Ram S, Blom AM. 2015. Virulence of group A streptococci is enhanced by human complement inhibitors. PLoS Pathog 11:e1005043. doi: 10.1371/journal.ppat.1005043. [DOI] [PMC free article] [PubMed] [Google Scholar]
- 68.Proft T, Moffatt SL, Berkahn CJ, Fraser JD. 1999. Identification and characterization of novel superantigens from Streptococcus pyogenes. J Exp Med 189:89–102. doi: 10.1084/jem.189.1.89. [DOI] [PMC free article] [PubMed] [Google Scholar]
Associated Data
This section collects any data citations, data availability statements, or supplementary materials included in this article.