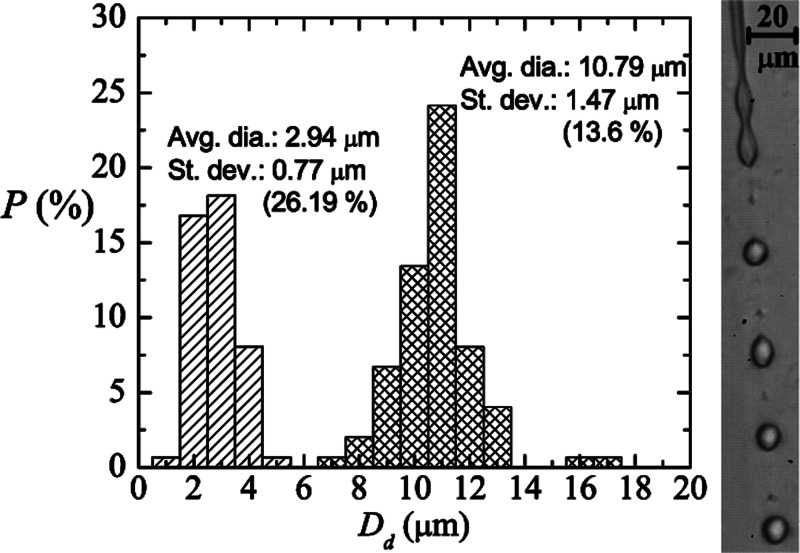
FIG. 6.
Probability distribution for the droplet diameter Dd produced with our technique for z = 144 μm, μl/h, and Q = 2 ml/h. The meshed and striped bars correspond to the results obtained for primary and satellite droplets, respectively, resulting from the breakup of a liquid PDMS precursor jet. The image on the right shows the primary and satellite droplets coming from the breakup of the jet.

