Abstract
A new class of synthetic models for the active site of [NiFe]-hydrogenases are described. The NiI/II(SCys)2 and FeII(CN)2CO sites are represented with (RC5H4)NiI/II and FeII(diphos)(CO) modules, where diphos = 1,2-C2H4(PPh2)2(dppe) or cis-1,2-C2H2(PPh2)2(dppv). The two bridging thiolate ligands are represented by CH2(CH2S)22− (pdt2−), Me2C(CH2S)22− (Me2pdt2−), and (C6H5S)22−. The reaction of Fe(pdt)(CO)2(dppe) and [(C5H5)3Ni2]BF4 affords [(C5H5)Ni(pdt)Fe(dppe)-(CO)]BF4 ([1a]BF4). Monocarbonyl [1a]BF4 features an S = 0 NiIIFeII center with five-coordinated iron, as proposed for the Ni-SIa state of the enzyme. One-electron reduction of [1a]+ affords the S = 1/2 derivative [1a]0, which, according to density functional theory (DFT) calculations and electron paramagnetic resonance and Mössbauer spectroscopies, is best described as a NiIFeII compound. The NiIFeII assignment matches that for the Ni-L state in [NiFe]-hydrogenase, unlike recently reported NiIIFeI-based models. Compound [1a]0 reacts with strong acids to liberate 0.5 equiv of H2 and regenerate [1a]+, indicating that H2 evolution is catalyzed by [1a]0. DFT calculations were used to investigate the pathway for H2 evolution and revealed that the mechanism can proceed through two isomers of [1a]0 that differ in the stereochemistry of the Fe(dppe)CO center. Calculations suggest that protonation of [1a]0 (both isomers) affords NiIII–H–FeII intermediates, which represent mimics of the Ni-C state of the enzyme.
Graphical abstract

INTRODUCTION
Hydrogenases are enzymes that catalyze the oxidation of hydrogen and reduction of protons at high rates and low overpotentials, reactions that are potentially useful for clean energy applications.1–4 Hydrogenases are classified into three main families according to the metals in their active site: [Fe]-, [FeFe]-, and [NiFe]-hydrogenases.5,6 These enzymes are oxygen-sensitive but the [NiFe]-hydrogenases can recover from oxygen poisoning.8,9 Model compounds have been useful in elucidating catalytic mechanisms or atom identity, notably with [FeFe]-hydrogenases.7,10 [FeFe]-hydrogenase models are fairly advanced and have strong resemblance and relevance to the enzymatic system.3,4,11 In contrast, models of the oxygentolerant [NiFe]-hydrogenases are less mature, and comparisons to the enzymatic system are sometimes less applicative.3,4,12,13
The [NiFe]-hydrogenase active site features a [Ni(SCys)4]z center linked through two thiolate bridges to an Fe(CN)2(CO) center (Figure 1). In the absence of a third bridging ligand, the geometry at nickel resembles that of SF4, while iron is square-pyramidal. The active states of the enzyme differ in three ways: (i) the oxidation state of the Ni center, (ii) the presence/absence of a hydride ligand bridging the two metals, and (iii) the state of protonation of at least one terminal cysteinyl thiolate. In contrast to the fluctuating oxidation states at the nickel center, iron appears to remain low-spin FeII throughout all of the known states of the enzyme active site.
Figure 1.
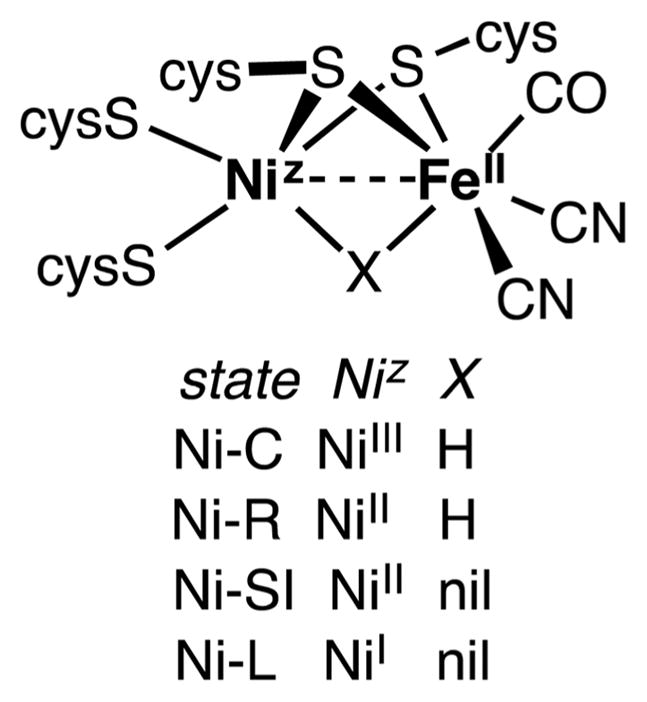
States of the active site of the [NiFe]-hydrogenases.
Beyond complementing our understanding of the enzyme, synthetic models could underpin the development of new catalysts for the processing of H2.1,2 The possibility of connecting synthetic complexes to enzyme states was established with [(dppe)Ni(pdt)(μ-H)Fe(CO)3]+.14,21 A related nickel–iron hydride [(amine)2Ni(SR)2(μ-H)FeL3]+ catalyzes the reduction of redox dyes by H2, a characteristic assay for the hydrogenases.15 With a NiII–H–FeII core, these synthetic complexes represent early models for the Ni-R state of the protein, despite discrepancies (Table 1).16
Table 1.
Summary of Models for the Active States of the [NiFe]-Hydrogenasea
| state | core description | state of the art models | comment |
|---|---|---|---|
| Ni-R | NiII–H–FeII | [(diphos)Ni(pdt)(μ-H)Fe(CO)2L]+14 [(amine)2Ni(SR)2(μ-H)FeL3]+ 15 |
models: dFe–H < dNi–H enzyme: dFe–H > dNi–H16 |
| Ni-SI | NiII–_–FeII | [(diphos)Ni(SR)2Fe(CO)2L2]+ 17 | model: six-coordinated iron enzyme: five-coordinated iron18 |
| Ni-C | NiIII–H–FeII 19 | none | no progress |
| Ni-L | NiI–_–FeII | [(diphos)Ni(pdt)Fe(CO)2L]+ 20 | model: NiIIFeI vs enzyme: NiIFeII 16 |
diphos = R2PCH2CH2PR2; (amine)2(SR)2 = tetradentate diaminodithiolate;15 L = PR3 or P(OR)3; pdt2− = CH2(CH2S−)2.
Concurrent with the development of these diamagnetic models,21,22 efforts have been made to replicate the paramagnetic states of the enzyme. The two most prominent paramagnetic states are Ni-C and Ni-L. Invoked in all catalytic mechanisms is Ni-C,6,7,23–25 which features a hydride bridging the NiIII and FeII centers. No synthetic analogues of this nickel(III) hydride have been detected, but this paper provides a first glimpse of a synthetic model. With a NiIFeII core, Ni-L is typically generated by low-temperature photolysis of Ni-C, and recent evidence points to its role in catalysis.26,27 These S = 1/2 states deviate most strongly from the conventional chemistry of dimetal systems and therefore offer the greatest opportunity for the discovery of fundamentally new reactivity. The first reported S = 1/2 NiFe complex was [(diphos)Ni(pdt)Fe-(CO)2L]+. Spectroscopic, crystallographic, and computational analyses show, however, that these cations are described as NiIIFeI derivatives,20,28 not NiIFeII as assigned to the Ni-L state of the enzyme.16 The lapse is a consequence of the Fe(CO)2L center, which stabilizes FeI. In the present report, the Fe(CO)2L center is replaced by the Fe(diphos)(CO) module, which more strongly stabilizes FeII.22
One of the weaknesses in the first generation of active-site model is a high reorganization energy upon oxidation at nickel.21 This work addresses this weakness. Redox at the nickel centers typically induces changes in the coordination geometry, such that NiI species (cf. Ni-L) are tetrahedral and NiII/III species (cf. Ni-SIa, Ni-R, Ni-C) are square-planar (Figure 2). In contrast, the NiFe active site changes only subtly as it converts among catalytic states.16,27 To minimize reorganizational barriers, the [Ni(diphos)]z site is replaced by [(C5H5)Ni]z. The [(C5H5)Ni(SR)2]z center has the advantage that its geometry is relatively insensitive to redox, in contrast to Ni(dppe)(SR)2-based models (Figure 2). Not only does the hapticity of C5H5 not change, but crystallographic studies29–31 show that the Ni-C5H5 distances are relatively invariant (<0.12 Å) for NiI, NiII, and NiIII(C5H5) compounds.
Figure 2.
Nickel diphosphine complexes changing geometry upon the oxidation of tetrahedral Ni0/I. The Ni(C5H5) center is structurally invariant over three oxidation states.
RESULTS AND DISCUSSION
Models for Ni-SI: Synthesis and Structure
The reaction of Fe(pdt)(CO)2(dppe) and [(C5H5)3Ni2]BF4 in nitromethane affords [(C5H5)Ni(pdt)Fe(dppe)(CO)]BF4 ([1a]BF4; eq 1) as a dark-red powder. The derivatives [(C5H5)Ni(pdt)Fe(dppv)-(CO)]BF4 ([1b]BF4), [(C5H5)Ni(Me2pdt)Fe(dppe)(CO)]-BF4 ([1c]BF4), and [(CH3C5H4)Ni(pdt)Fe(dppe)(CO)]BF4 ([1d]BF4), where dppv = cis-1,2-C2H2(PPh2)2 and Me2pdt2− = Me2C(CH2S−)2, were also prepared using the appropriate nickel and iron precursors. These salts are similar to [1a]BF4 in terms of their reactivity and spectroscopic properties. The reaction of Fe(pdt)(CO)2(dppe) and [(C5H5)3Ni2]BF4 proceeds via an intermediate with ν̃CO = 1980 cm−1 that converts to [1a]+. We assign this intermediate band to the dicarbonyl complex trans-[(C5H5)Ni(pdt)Fe(dppe)(CO)2]-BF4. The disappearance of the intermediate band follows first-order decay (Figures S45 and S46). When the reaction progress is monitored by 31P NMR spectroscopy, the iron precursor is consumed within ca. 5 min and two new singlet resonances are observed, one of which corresponds to the product [1a]+. Additionally, electrospray ionization mass spectrometry (ESI-MS) of the reaction mixture indicates the presence of the molecular cation [(C5H5)Ni(pdt)Fe(dppe)-(CO)2]+. These observations are consistent with the rapid attachment of “(C5H5)Ni+” to the two isomers of the iron dithiolate. The cis-carbonyl derivative appears to release CO rapidly, whereas the isomer with trans-CO ligands is somewhat persistent.
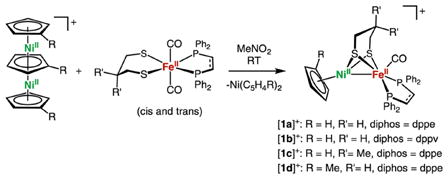 |
(1) |
Purified compounds [1a–1d]BF4 display a single ν̃CO band in the range of 1940–1951 cm−1, consistent with the presence of one isomer. These values are similar to those observed in Ni-SIa, which range from 1927 to 1947 cm−1 (Table 2).6
Table 2.
IR Data for Compounds [1a–1d]BF4 and [2b]BF4 in a CH2Cl2 Solution and the Ni-SIa State in Selected Organisms
| compound |
ν̃CO (cm−1)
|
|
|---|---|---|
| expt | calca | |
| [(C5H5)Ni(pdt)Fe(dppe)(CO)]BF4 ([1a]BF4) | 1943 | 1948/1946 |
| [(C5H5)Ni(pdt)Fe(dppv)(CO)]BF4 ([1b]BF4) | 1951 | 1951/1949 |
| [(C5H5)Ni(Me2pdt)Fe(dppe)(CO)]BF4 ([1c]BF4) | 1940 | 1937/1935 |
| [(CH3C5H4)Ni(pdt)Fe(dppe)(CO)]BF4 ([1d]BF4) | 1943 | 1947/1945 |
| [(C5H5)Ni(SPh)2Fe(dppv)(CO)]BF4 ([2b]BF4) | 1956 | 1959 |
| Ni-SIa (Synechocytis SH)6 | 1947 | n/a |
| Ni-SIa (D. vulgaris Miyazaki F)32 | 1943 | n/a |
| Ni-SIa (D. gigas)32 | 1934 | n/a |
| Ni-SIa (A. aeolicus)6 | 1927 | n/a |
| Ni-SIa (Allochromatium vinosum)32 | 1931 | n/a |
The first value corresponds to the conformer in which the central CH2 of the Fe(pdt)Ni core is oriented toward iron, and the second value corresponds to the conformer in which the same CH2 is oriented toward nickel. The calculations were performed in the absence of BF4−.
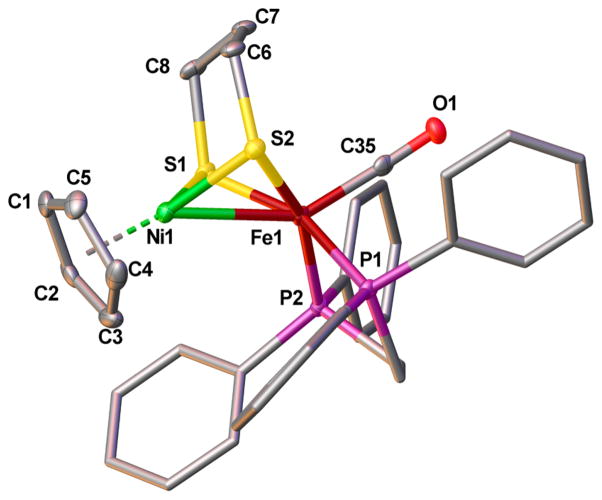
The structure of [1a]+ was confirmed by X-ray crystallography. The Ni–Fe distance is 2.5145(4) Å (Figure 3). Although the enzyme in the SIa state has not been characterized crystallographically, it is generally assumed that the Ni–Fe distance is ~2.6 Å in all active states.6 The stereochemistry of the FeL2(CO) site is biomimetic in the sense that CO occupies an apical site, and the two Lewis basic phosphine ligands are approximately trans to the sulfur centers of the thiolates.
Figure 3.
Solid-state structure of [1a]BF4 shown at the 50% probability level. Hydrogen atoms, counterions, and solvent have been omitted for clarity. Selected bond distances (Å): Ni1–Fe1, 2.5145(4); Ni1–centroid, 1.722(3); Ni1–Savg, 2.1645(7); Fe1–Savg, 2.2208(7); Fe1–C35, 1.757(2); C35–O1, 1.147(2).
The 31P NMR spectra of complexes [1a–1d]BF4 are simple, exhibiting only a single resonance, indicating chemically equivalent phosphorus centers or a dynamic process. The diphosphine in complexes [1a–1d]BF4 is only observed in the dibasal arrangement, whereas other Fe(dithiolate)-(diphosphine)CO compounds have been shown to adopt both a dibasal and an apical–basal arrangement.33 The phosphorus centers remain NMR-equivalent at −90 °C, suggesting either an exceptionally low barrier for isomerization or the presence of a single isomer. In the IR spectrum, only a single isomer is observed, which, like the enzyme’s active site, has both donor ligands in basal positions.
The reaction of cis,cis-Fe(SPh)2(CO)2(dppv) and [(C5H5)3Ni2]BF4 gave the dicarbonyl [(C5H5)Ni(SPh)2Fe-(dppv)(CO)2]BF4 ([2bCO]BF4), isolated as dark, almost black, microcrystals. Its 1H NMR spectrum exhibits only one (C5H5) signal, and an AB quartet pattern in the 31P NMR spectrum, indicating low symmetry. The structure was confirmed crystallographically (Figure S53). The Ni–Fe distance is 3.308(1) Å, indicating a noncovalent interaction. The stereochemistry at iron is identical with the precursor, wherein all ligands are cis. The μ-SPh groups are diaxial.
Upon treatment with Me3NO, the dicarbonyl readily decarbonylated to give [2b]BF4, isolated as a black solid. The IR spectrum of [2b]+ in a CH2Cl2 solution displays a single ν̃CO band at 1956 cm−1, versus 2042 and 2002 cm−1 observed for the precursor. The monocarbonyl cation, [2b]+, decomposes gradually in a CH2Cl2 solution. However, the complex is stable in MeCN, and the ν̃CO band shifts 22 cm−1 to higher energies, suggesting the formation of an adduct. The 31P NMR spectrum of [2b]+ exhibits a singlet at δ 78.8. Under 1 atm of CO, MeCN solutions of [2b]+ partially convert back to [2bCO]+. In contrast, [1a]+ is not reactive toward CO.
Electrochemistry
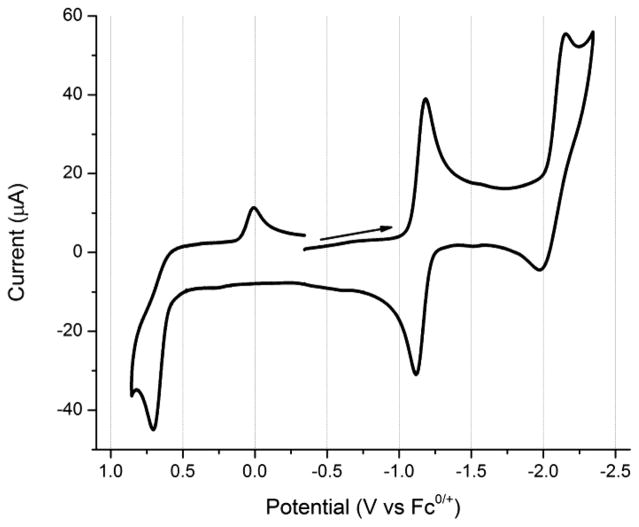
The cyclic voltammetry of [1a]BF4 in dichloromethane (CH2Cl2) is very rich (Figure 4). Compounds [1b–1d]+ produce similar voltammograms (Table 3). Compounds [1a–1d]+ exhibit an irreversible oxidation near +0.65 V and a reversible one-electron reduction near −1.20 V, all versus Fc0/+. Additionally, a quasi-reversible reduction is observed near −2.15 V, which becomes fully reversible when in tetrahydrofuran (THF) with [Bu4N]B(C6H3-3,5-(CF3)2)4 as the electrolyte. An irreversible reduction wave is generated at ca. 0.0 V versus Fc0/+ following the irreversible oxidation.
Figure 4.
Cyclic voltammogram of [1a]BF4 at 500 mV s−1. Conditions: ~1 mM in CH2Cl2; 100 mM [NBu4]PF6; glassy carbon electrode (d = 3 mm); silver wire as the pseudoreference with an internal Fc standard at 0 V; platinum as the counter electrode.
Table 3.
Electrochemical Properties of Compounds [1a–1d]+ (V vs Fc+/0 in CH2Cl2)a
| compound | Ep,ox(NiIIFeII/NiIIIFeII) | calcb,c | E1/2(NiIIFeII/NiIFeII) | calcb,c | Ep,redd(NiIFeII/NiIFeI) | calcb,c,d |
|---|---|---|---|---|---|---|
| [1a]BF4 | 0.70 | 0.70 | −1.16 | −1.16 | −2.15 | −2.15 |
| [1b]BF4 | 0.72 | 0.73 | −1.15 | −1.12 | −2.18 | −2.05 |
| [1c]BF4 | 0.67 | 0.76 | −1.09 | −1.16 | −2.15 | −2.12 |
| [1d]BF4 | 0.62 | 0.66 | −1.21 | −1.23 | −2.17 | −2.18 |
For the calculated values, the central CH2 of the Fe(pdt)Ni core is oriented toward iron and assumed to remain in this orientation upon reduction or oxidation. Additional calculated values corresponding to the same CH2 being oriented toward nickel, or flipping from iron to nickel, are available in Tables S1 and S2. In all cases, the conformation of the Fe(pdt)Ni core does not affect the potential.
[1a]BF4 was used as the reference so the experimental and calculated values agree by construction.
The calculations were performed on the positively charged species in the absence of BF4−.
This wave is assigned to a NiIFeII/NiIFeI couple, where the NiIFeI state is an open-shell singlet.
The redox couples in the different derivatives are relatively similar. The reversible couple is most affected by Me2pdt substitution. With Δν̃CO = 3 cm−1 (Table 1), the donor properties of pdt2− and Me2pdt2− are similar in this system, and the difference in the potential of the NiIIFeII/NiIFeII redox couple may be due to the steric effects of the methyl groups. The reversible reduction in complexes [1a–1d]+ shifts to more positive potentials by 50 mV upon replacement of (C5H5) for CH3C5H4. This effect suggests that the reduction is nickel-centered, generating a NiIFeII species. CH3C5H4 substitution most affected the oxidation observed at ≈0.75 V, shifting this couple by −80 mV, whereas other substitutions only generate a 20–30 mV effect. This observation suggests that oxidation is nickel-centered. The reduction near −2 V is negligibly affected by the nickel-based ligands and is proposed to be an iron-centered reduction, generating a NiIFeI species.
Density functional theory (DFT) was used to calculate the potentials associated with the couples [1a–1d]2+/+, [1a–1d]+/0, and [1a–1d]0/−. The potentials were calculated relative to [1a]BF4 and are provided in Table 3. The experimental trends are well reproduced by the calculations. The BF4− ions were not included in the calculations, which may cause deviations between the calculated and experimental values. The reduction potentials were also calculated for an alternative geometry optimization scheme, as well as using different functionals, and these results are provided in Tables S1 and S2.
Models for Ni-L: Synthesis and Structure
The reduced species [1a–1d]0 and [2b]0 were produced on a preparative scale by treatment with (C5H5)2Co (E0 = −1.23 V; eq 2).
| (2) |
Purified samples [1a–1d]0 and [2b]0 were isolated as black, air-sensitive solids. Reduction of [1a–1d]+ and [2b]+, a NiIIFeII/NiIFeII couple, shifts ν̃CO by ca. 40 cm−1 to around 1900 cm−1. A similar change is observed for the reduction of [(dppe)Ni(pdt)Fe(CO)3]+, a NiIIFeI/NiIFeI couple (Δν̃CO ≈ 35 cm−1 for this tricarbonyl).20 Oxidation state changes centered at iron typically shift ν̃CO by ca. 100 cm−1 as observed for [(dppe)Pt(pdt)Fe(CO)3]+/0, a PtIIFeI/PtIIFe0 couple.21 For the Ni-L state of the [NiFe]-hydrogenases, the values of ν̃CO range from 1911 (Desulfovibrio vulgaris Miyazaki F)34 to 1862 cm−1 (Aquifex aeolicus) (Table 4).26,35
Table 4.
IR Data for ν̃CO in Compounds [1a–1d]0 and [2b]0 in a CH2Cl2 Solution
| compound |
ν̃CO (cm−1)
|
|
|---|---|---|
| expt | calca | |
| [1a]0 | 1901 | 1901/1901 |
| [1b]0 | 1903 | 1909/1906 |
| [1c]0 | 1897 | 1898/1899 |
| [1d]0 | 1898 | 1900/1900 |
| [2b]0 | 1915 | 1911 |
The first value corresponds to the isomer in which the central CH2 of the Fe(pdt)Ni core is oriented toward iron, and the second value corresponds to the isomer in which the same CH2 is oriented toward nickel.
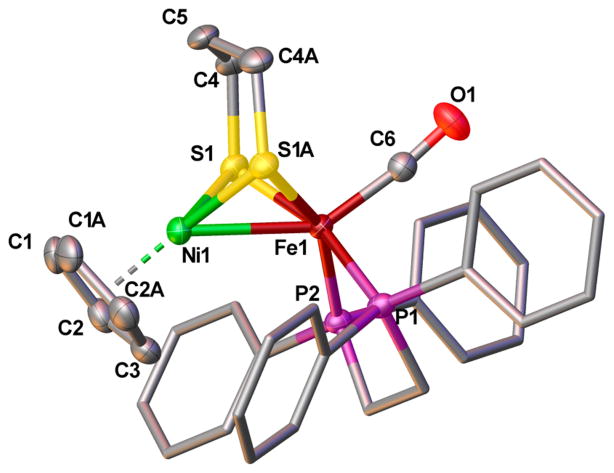
X-ray crystallographic analysis confirmed that the solid-state structures of [1a]0 (Figure 5) and [1a]+ (Figure 3) are very similar. The principal changes in these structures are in the coordination sphere of nickel, which suggests that the couple [1a]+/0 involves a nickel-centered reduction. The Ni-C5H5 and Ni–S bonds elongate by about 5%, while the Fe–ligand bond lengths remain virtually unchanged. The Ni–Fe distance shortens by ~0.1 Å to 2.4593(5) Å, which is well within the sum of the atomic radii [2.56(6) Å], indicating the presence of metal–metal bonding. Although there are no crystallographic data on the metal–metal-bonded Ni-L state of the enzyme, DFT calculations predict this distance to be 2.56 Å.36 The observed structural changes are consistent with reduction at the nickel center in the transformation of [1a]+ to [1a]0. The DFT-optimized structures of [1a]+ and [1a]0 were in excellent agreement with the crystal structures (Table 5).
Figure 5.
Solid-state structure of [1a]0 shown at the 50% probability level. Hydrogen atoms and solvent have been omitted for clarity. Selected bond distances (Å): Ni1–Fe1, 2.4593(6); Ni1–centroid, 1.795(3); Ni1–Savg, 2.2772(5); Fe1–Savg, 2.2544(5); Fe1–C6, 1.745(3); C6–O1, 1.159(3).
Table 5.
Key Bond Distances (Å) in [1a]BF4 and [1a]0 and the Differences from the Crystal Structures and DFT Calculations
| bond | [1a]BF4 | calc | [1a]0 | calc | experimental difference | DFT difference |
|---|---|---|---|---|---|---|
| Ni–Fe | 2.5145(4) | 2.566 | 2.4593(5) | 2.508 | −0.055 | −0.058 |
| Ni–centroid | 1.722(3) | 1.739 | 1.795(3) | 1.814 | +0.073 | +0.075 |
| Ni–Savg | 2.1645(7) | 2.168 | 2.2772(5) | 2.259 | +0.113 | +0.091 |
| Fe–Savg | 2.2208(7) | 2.236 | 2.2544(5) | 2.252 | +0.034 | +0.016 |
| Fe–Pavg | 2.2256(7) | 2.249 | 2.235(8) | 2.236 | +0.009 | −0.013 |
| Fe–C | 1.757(2) | 1.721 | 1.745(3) | 1.727 | −0.012 | +0.006 |
| C–O | 1.147(2) | 1.171 | 1.159(3) | 1.174 | +0.012 | +0.003 |
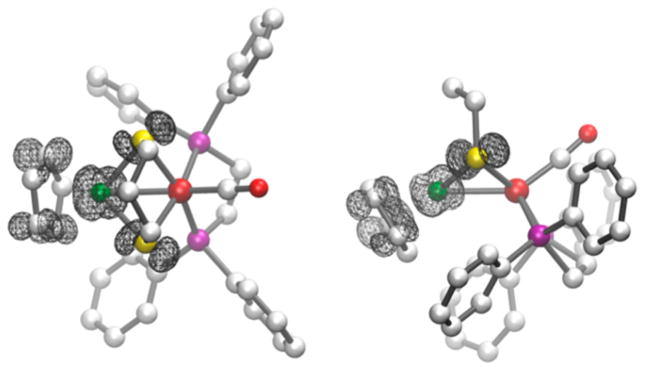
DFT analysis of the spin density was used to determine the site of reduction of [1a–1d]+. The plot of the spin density for [1a]0 (Figure 6) reveals that the unpaired electron resides primarily on the nickel center, with some delocalization on the pdt2− and (C5H5)− ligands but no significant delocalization on the iron. This result is consistent with the NiIFeII assignment and the experimentally observed elongation of the Ni–ligand bonds upon reduction of [1a]+.
Figure 6.
Views of the isocontour plot of the positive spin density for [1a]0 from two perspectives. The spin density is localized about the nickel coordination sphere. Color scheme: green, nickel; maroon, iron; yellow, sulfur; purple, phosphorus; red, oxygen; white, carbon. The hydrogen atoms have been removed for clarity.
The spin densities for the reduced species [1a–1d]0 and [2b]0 are given in Table 6 and consistently indicate a nickel-based reduction across all species. As observed for related nickel–iron dithiolate complexes,20,21 the spin densities are not significantly affected by the conformation of the pdt ligand. Furthermore, the calculations also predict that an iron-based reduction would require potentials of 0.2–0.4 V more negative than the experimentally observed nickel-based reduction potentials (Table S1).
Table 6.
Calculated Spin Densities in Mixed-Valence Species [1a–1d]0 and [2b]0 a
| compound | Ni | Fe | 2S | C5H5 |
|---|---|---|---|---|
| [1a]0 | 0.71 | −0.17 | 0.24 | 0.24 |
| 0.71 | −0.19 | 0.23 | 0.25 | |
| [1b]0 | 0.69 | −0.16 | 0.22 | 0.25 |
| 0.69 | −0.17 | 0.22 | 0.25 | |
| [1c]0 | 0.69 | −0.15 | 0.22 | 0.24 |
| 0.71 | −0.20 | 0.24 | 0.25 | |
| [1d]0 | 0.69 | −0.17 | 0.23 | 0.25b |
| 0.70 | −0.19 | 0.23 | 0.26b | |
| [2b]0 | 0.72 | −0.20 | 0.20 | 0.26 |
For each complex, the first entry corresponds to the isomer in which the central CH2 of the Fe(pdt)Ni core is oriented toward the Fe center, and the second entry corresponds to the isomer in which the same CH2 is oriented toward the Ni center.
For [1d]0, this is the spin density over the CH3C5H4 ligand.
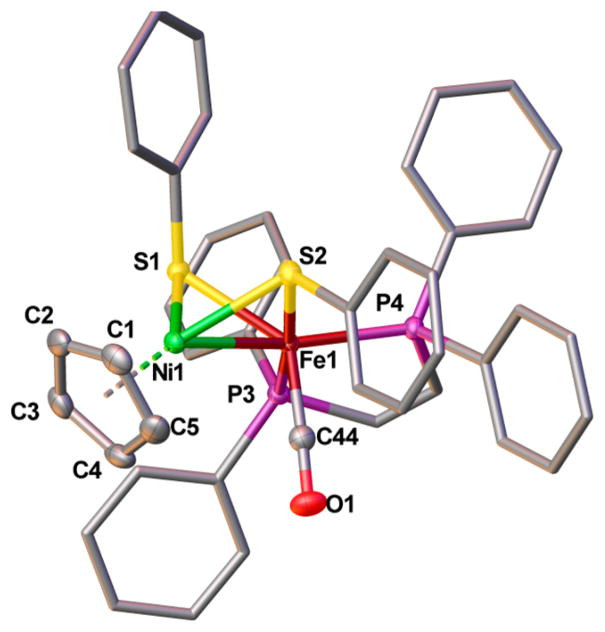
Crystallographic analysis revealed that the structure of [2b]0 differs strongly from that of [1a]0 (Figure 7). Specifically, the iron center is inverted such that the CO ligand is poised between the iron and nickel centers (eq 3). The CO ligand is not bridging, as indicated by the long Ni–CO distance of 2.878 Å. The DFT-optimized geometry of [2b]0 is in good agreement with the crystal structure (Table S8), and the Ni–CO distance is calculated to be 2.916 Å. Furthermore, ν̃CO for [2b]0 is calculated to be 1911 cm−1 for the rotated structure, close to the observed value of 1915 cm−1. A small shoulder at approximately 1900 cm−1 is also observed in the spectrum and may result from the presence of a second rotamer. For [2b]0, the isomer in which the CO ligand is apical, as in the structure of [2b]+, is calculated to be higher in free energy by 3.70 kcal mol−1 compared to the isomer in which the CO ligand is poised between the iron and nickel centers. This free energy difference is consistent with the crystal structure of [2b]0 featuring an inverted iron center.
Figure 7.
Solid-state structure of [2b]0 shown at the 50% probability level. Hydrogen atoms and solvent have been omitted for clarity. Selected bond distances (Å): Ni1–Fe1, 2.4594(3); Ni1–centroid, 1.817(2); Ni1–Savg, 2.3067(5); Fe1–Savg, 2.2868(5); Fe1–Pavg, 2.1934(5); Fe1–C44, 1.738(2); C44–O1, 1.162(2).
 |
(3) |
Models for Ni-L: Spectroscopy
The X-band continuous-wave electron paramagnetic resonance (CW-EPR) spectrum of [1a]0 is rhombic with g values of 1.991, 2.042, and 2.138. No hyperfine coupling was detected (Figure 8). Spectra of [1b–1d]0 are very similar to that of [1a]0 (Table 7). The absence of significant 31P hyperfine coupling is consistent with a nickel-centered radical, indicating that these compounds feature (C5H5)NiI centers. Large 31P hyperfine coupling was observed in related mixed-valence compounds containing iron(I) phosphine centers, e.g., [(CO)2(PR3)Fe(pdt)Ni-(diphosphine)]+.20,28
Figure 8.
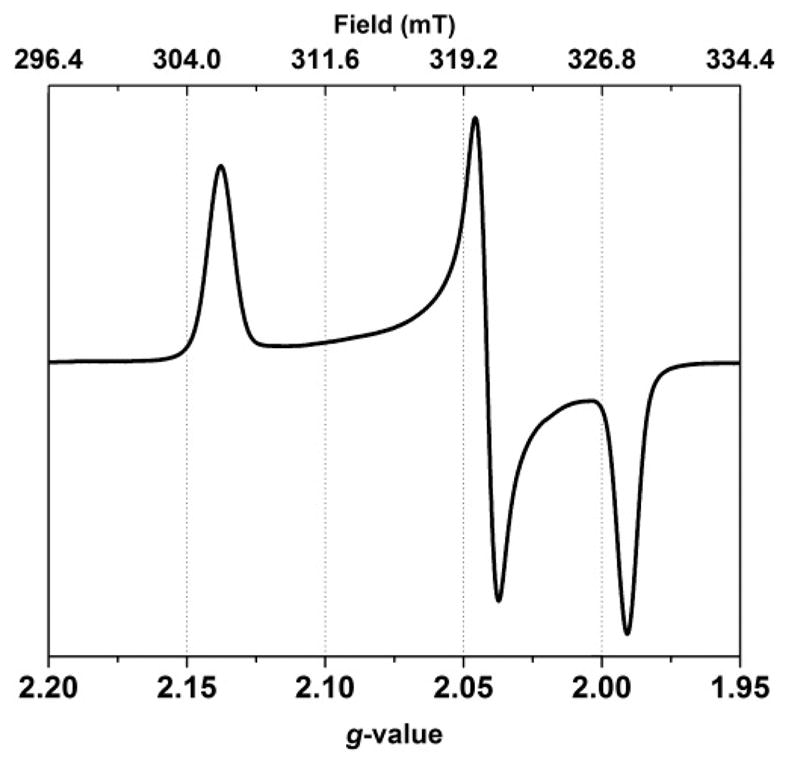
X-band CW-EPR spectrum of a ~2 mM frozen solution of [1a]0 in 1:1 CH2Cl2/THF (110 K).
Table 7.
EPR Parameters for Compounds [1a–1d]0 and [2b]0 (Frozen CH2Cl2/Toluene Solution at 110 K) and the Ni-L State in Desulfovibrio vulgaris Miyazaki F6
| compound | g1, g2, g3 |
|---|---|
| [1a]0 | 1.991, 2.042, 2.138 |
| [1b]0 | 1.987, 2.042, 2.134 |
| [1c]0 | 1.997, 2.044, 2.138 |
| [1d]0 | 1.987, 2.039, 2.130 |
| [2b]0 | 1.984, 2.039, 2.143 |
| Ni-L1 (D. vulgaris) | 2.046, 2.118, 2.296 |
Q-band ENDOR experiments were conducted to probe the spin distribution in the mixed-valence state. Consistent with the absence of any hyperfine splitting in the EPR spectrum, the 31P hyperfine couplings were found to be very small (~11 MHz; Table 8 and Figure S10). Several proton hyperfine contributions were detected using ENDOR spectroscopy with hyperfine splittings ranging from 4 to 11 MHz (Figure S9). The variant of complex [1a]0 carrying C5D5 ([1a-d5]0) in place of C5H5 afforded a greatly simplified 1H ENDOR pattern with the largest proton coupling (~11 MHz) being absent (Figure S8), indicating that the spin density is localized on the nickel and its immediate coordination sphere. The weaker 1H couplings observed for [1a-d5]0 are assigned to two equivalent methylene protons of pdt2−. These observations are consistent with DFT analysis, which shows that the spin density in [1a]0 and [2b]0 is primarily localized on the (C5H5)Ni(pdt) center (Figure 6 and Table 6). Despite the different stereochemistry at iron, at least in the solid state, and the presence of SPh− versus R2pdt2−, the EPR spectra of all mixed-valence compounds are similar.
Table 8.
Hyperfine Couplings in [1a]0 from Q-Band ENDOR and Applied Field Mössbauer Measurements
| nucleus | HFI expt (MHz)
|
||
|---|---|---|---|
| A1 | A2 | A3 | |
| C51H5 | −4.86 | +3.25 | −11.25 |
| CH2(C1H2S)2 | 7.3 | 4.4 | 4.36 |
| 31P | 11.1 | 11.3 | 12.7 |
| 57Fe | −3.8 | −0.73 | −0.9 |
The [1a-d5]0 orientation-selective ENDOR patterns (Figure S8) could be simulated with one proton hyperfine interaction (originating from two equivalent pdt2− methylene protons). Although, in principle, up to eleven protons [C5H5 + CH2(CH2S)2] could contribute to the 1H ENDOR spectra of [1a]0, only one additional contribution, assigned to the (C5H5) ligand, could be distinguished and evaluated (see Figure S9). It can be assumed that the proton(s) with their hyperfine tensors approximately aligned with the g-tensor axes lead to the strongest contributions along these axes in the orientation-selective ENDOR spectra. The hyperfine tensors of the C5H5 protons that are not aligned with the g-tensor axes give rise to additional weaker features in the ENDOR spectra (Figure S9), which have not been simulated. The simulation parameters of the C5H5− and pdt2− (CH2S) contributions are given in Table 8.
The measured Mössbauer spectra of [1a–1c]0 and the corresponding cations are quite similar (see Figures S1–S6). All exhibit low isomer shifts of δ = 0.11–0.14 mm s−1 and small quadrupole splittings of ΔEq = 0.72–1.15 mm s−1 (Table 9). The Mössbauer data are in agreement with a low-spin iron in all complexes. Consistent with other data in this paper, the spectra support the oxidation-state assignments of NiIIFeII for compounds [1a–1c]BF4 and NiIFeII for compounds [1a–1c]0. The isomer shifts observed in the NiIFeII compounds [1a–1c]0 are larger than the shift observed for the NiIIFeI compound [(dppe)Ni(pdt)Fe(CO)3]BF4 (δ = 0.04 mm s−1), while the quadrupole splittings are comparable (ΔEq = 0.57).20 Mössbauer data for the [NiFe]-hydrogenases are sparse and suffer from difficulties in identifying and correcting for the dominating subspectra of the accessory FeS clusters.37,38 Isomer shifts in the range of 0.05–0.15 mm s−1 have been assigned to the iron center of the [NiFe] center.39
Table 9.
Mössbauer Parameters for Compounds [1a–1c]BF4, [1a–1c]0, and Ni-SIa in Regulatory Hydrogenase (RH) from Ralstonia eutropha
| compound | δ (mm s−1) | ΔEqa (mm s−1) | η |
|---|---|---|---|
| [1a]BF4 | 0.11 | 1.15 | 0.13 |
| [1b]BF4 | 0.11 | 1.10 | |
| [1c]BF4 | 0.12 | 0.87 | |
| [1a]0 | 0.14 | −0.73 | |
| [1b]0 | 0.13 | −0.72 | |
| [1c]0 | 0.13 | −0.76 | |
| Ni-SIa RH (R. eutropha)86 | 0.10 | 1.60 |
ΔEq signs for [1a–1c]0 are obtained from magnetic Mössbauer spectra.
The Mössbauer spectrum of [1a]0 was further examined at high magnetic fields. This spectrum shows a very weak internal field contribution with an isotropic 57Fe hyperfine coupling of 2 MHz (Table 8 and Figure S7). For comparison, magnetic Mössbauer spectra of the FeI center in the Hox state of the [FeFe]-hydrogenase indicate 57Fe hyperfine couplings in the range of 10–20 MHz.40,41 The weak coupling is consistent with the spin being localized on the nickel center.
Electronic Structure Analysis
The geometries of the various species were optimized using DFT/BP86 and compared to the available experimental data to further probe the electronic structures of [1a–1d]+ and [1a–1d]0. The optimized geometries are in good agreement with the X-ray crystal structures. Relevant bond lengths for [1a]+ and [1a]0 are compared in Table 5. The BF4− counterions were not included in the geometry optimizations, which may introduce minor discrepancies between the X-ray crystal and DFT-optimized structures. Comparisons between the DFT and X-ray crystal structures for species [1b–1d]+ and [2b]0, as well as structural and energetic information for all systems studied, are provided in Tables S4–S8. Moreover, the CO stretching frequencies (ν̃CO) calculated with DFT are also in good agreement with the experimental data (Tables 2 and 4).
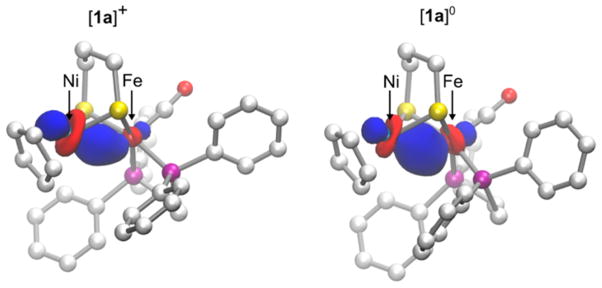
The short Ni–Fe distances in both [1a]+ and [1a]0 suggest the presence of metal–metal bonding interactions. According to previous analyses, such Ni–Fe bonds typically arise from overlap of the dz2 orbitals.21,42,43 Interestingly, however, the nature of the Ni–Fe bonding is quite different between [1a]+ and [1a]0, as revealed by analysis of the bonding molecular orbitals (MOs) localized using the Pipek–Mezey criteria.44 For [1a]+, the bonding orbital (Figure 9, left) reveals a dative Ni → Fe two-center, two-electron bond, which resembles a Lewis acid–base-type interaction between the d8 NiII and d6 FeII centers. In contrast, for [1a]0, a more covalent two-center, two-electron bond is present (Figure 9, right), in which the Ni and Fe dz2 orbitals contribute equally to the bonding orbital. An alternative bonding analysis using natural bond orbitals (NBOs)45 is provided in the Supporting Information (pp S38–S40). The formation of a stronger σ bond in [1a]0 is consistent with the experimentally observed contraction of the Ni–Fe bond distance from 2.51 Å in [1a]+ to 2.46 Å in [1a]0. This Ni–Fe bond-length contraction is also found in the DFT-optimized structures (Table 5). These chemical bonding patterns are similar for [2b]+ and [2b]0 (Figure S58), indicating that the stereochemistry at iron and the presence of SPh− or R2pdt2− does not disrupt the Ni–Fe bond.
Figure 9.
Pipek–Mezey localized MOs showing the Ni–Fe σ bonds in [1a]+ and [1a]0. The composition of the MO in [1a]+ is 85% nickel and 15% iron, and the composition of the MO in [1a]0 is 53% nickel and 47% iron. Only the α orbital is shown for [1a]0; however, the β orbital is similar.
Protonation of Ni-L Model
Upon treatment with ≥1 equiv of acid, solutions of [1a]0 liberate H2 and afford the formation of [1a]+ (eq 4).
| (4) |
H2 evolution was observed for HBF4, p-toluenesulfonic acid (pKaMeCN = 8.01), and [pyridinium]BF4 (pKaMeCN = 12.33) but not for [NH4]PF6 (pKaMeCN = 14.46). With HBF4, the yield of H2 was 0.44 equiv, as assayed by gas chromatography. With [1a]0 functioning as a one-electron reductant, 0.5 equiv would be predicted.
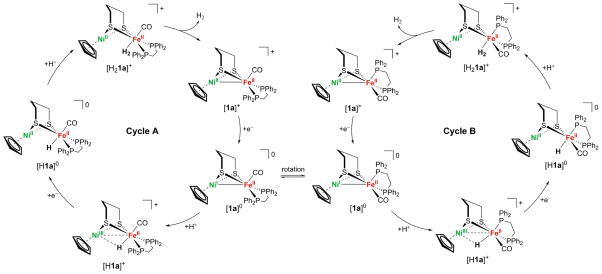
Protonolysis of [1a]0 to give [1a]+ entails the conversion of an S = 1/2 precursor to an S = 0 product, which implicates a multistep process involving electron transfer. We anticipated that protonation of [1a]0 would afford [(C5H5)Ni(pdt)HFe-(CO)(dppe)]+ ([H1a]+), a NiIII–FeII species (see the DFT section below). However, hydrides were not obtained experimentally; rather, only [1a]+ was obtained. To explain this result, [H1a]+ is proposed to undergo reduction by its conjugate base [1a]0, giving [H1a]0, which, in turn, undergoes protonolysis to give [1a]+. Similarly, we found that protonation of [2b]0 afforded [2b]+. The proposed sequence of reactions is summarized in Scheme 1.
Scheme 1.
Proposed H2 Evolution Mechanism
In the presence of excess acid, [1a]0/+ is a formal, albeit slow, electrocatalyst for H2 evolution. Using trifluoroacetic acid, the catalytic current is observed at −1.16 V, corresponding to the [1a]+/0 couple, with an acid-independent rate46 of ca. 4 s−1 (Figure S32). Because the hydride intermediates could not be characterized, they were analyzed with DFT in the context of the mechanism for H2 evolution. Additionally, the exclusive observation of the dibasal intermediate prompted theoretical investigation of an apical–basal isomer. These calculations provide insight into the structure and bonding of the nickel(III) hydride intermediate and also predict the occurrence of two parallel catalytic cycles involving isomers of [1a]0. Similar bimetallic hydrides have been known to adopt different isomers.22,47 Furthermore, recent work suggests that the protonation of (dppe)Ni(pdt)-Fe(CO)3 proceeds via an unobserved isomer.21
According to the calculations, the dibasal and apical–basal isomers of [1a]0 are nearly isoergic (ΔG° = +0.48 kcal mol−1) and interconvert via a relatively low free energy barrier, ΔGǂ = 11.76 kcal mol−1 (Table 11); however, all other protonation and oxidation states have a much higher barrier for isomerization (ΔG > 20 kcal mol−1). This result prompted the investigation of two parallel pathways for H2 evolution, labeled A and B in Figure 10.
Table 11.
Calculated Reaction Free Energies and Free Energy Barriers (kcal mol−1) for Isomerization of Dibasal to Apical–Basal Isomers for [1a]0 and Its Derivatives in the Proposed Catalytic Cyclea,b,c
| compound | ΔG° | ΔGǂ |
|---|---|---|
| [1a]0 | 0.48 | 11.76 |
| [H1a]+ | 2.21 | 20.84 |
| [H1a]0 | 5.18 | 25.64 |
| [H21a]+ | 9.86 | 30.03 |
| [1a]+ | 2.03 | 21.54 |
See Figure 10 for structures of all species.
For the isomerization considered here, the central CH2 of the Fe(pdt)Ni core is oriented toward the nickel center. The calculated values corresponding to the cases where the same CH2 is oriented toward the iron center are provided in Table S9.
The potential energy surface was found to be relatively flat along the isomerization pathway, leading to relatively small imaginary frequencies for the TSs.
Figure 10.
Proposed mechanism for H2 production proceeding through two isomers. Cycle A, on the left, proceeds through structures in which the dppe ligand is in the dibasal position. Cycle B, on the right, proceeds through structures in which the dppe ligand spans apical–basal positions. Isomerization of [1a]0, which has the lowest free energy barrier, could lead to a transition between cycles A and B.
These pathways are initiated by protonation of isomers of [1a]0 that differ in terms of the stereochemistry of the (pdt)Fe(dppe)(CO) site. The adoption of the apical–basal isomer does not disrupt the Ni–Fe σ bond (Figure S56) or the localization of the unpaired spin density (Table 10 and Figure S57). The isomerization from the dibasal to the apical–basal configuration is expected to occur only for the [1a]0 species because the calculated ΔGǂ values for the analogous isomerization for all other intermediates in the catalytic cycle shown in Figure 10 are greater than 20 kcal mol−1 (Table 11). DFT analysis revealed that the transition state (TS) for this isomerization disrupts the metal–metal bonding (Supporting Information, p S41). For [1a]0, the TS is best described as NiIIFeI, while the TS is NiIIFeII in [1a]+. The lower isomerization barrier for [1a]0 is attributed to the greater stability of five-coordinated FeI compared to five-coordinated FeII.
Table 10.
Spin Densities and Bond Lengths (Å) of [1a]0, [H1a]+, and [H1a]0 a
| [1a]0
|
[H1a]+
|
[H1a]0
|
||||
|---|---|---|---|---|---|---|
| isomer A | isomer B | isomer A | isomer B | isomer A | isomer B | |
| ρ(Ni) | 0.71 | 0.70 | 0.45 | 0.42 | 0.00 | 0.00 |
| ρ(Fe) | −0.19 | −0.16 | 0.24 | 0.29 | 0.00 | 0.00 |
| ρ(2S) | 0.23 | 0.23 | 0.12 | 0.09 | 0.00 | 0.00 |
| ρ(C5H5) | 0.25 | 0.23 | 0.18 | 0.16 | 0.00 | 0.00 |
| d(Ni–Fe) | 2.53 | 2.47 | 2.60 | 2.59 | 3.01 | 2.85 |
| d(Ni–H) | n/a | n/a | 1.80 | 1.79 | 2.44 | 2.05 |
| d(Fe–H) | n/a | n/a | 1.61 | 1.58 | 1.54 | 1.53 |
For these calculations, the central CH2 of the Fe(pdt)Ni core is oriented toward the nickel center. An analogous table for the cases where the same CH2 is oriented toward the iron center is provided in the Table S10.
The first step in the catalytic cycle produces isomers of [H1a]+. In both isomers, the unpaired electron is localized mainly in the nickel coordination sphere (Table 10), indicating that these species are best described as NiIIIHFeII, analogous to the Ni-C state in the enzyme. Moreover, the DFT-optimized structure of [H1a]+ reveals that the hydride is more closely bound to iron than to nickel.
Subsequent to its formation, [H1a]+ is reduced by a second 1 equiv of [1a]0 to form [1a]+ and the nickel(II)–iron(II) hydride [H1a]0. This electron transfer is proposed to occur spontaneously on the basis of the calculated reduction potential of [H1a]+, which is less negative than the calculated reduction potential of [1a]+ by 0.16 (cycle A) and 0.03 V (cycle B) versus Fc+/0 in CH2Cl2. Reduction to form [H1a]0 mainly affects the nickel center and results in significant elongation of the Ni–H distance by 0.64 and 0.26 Å for the A and B isomers, respectively. Thus, [H1a]0, which would be analogous to the Ni-R state of the enzyme, is more accurately described as a semiterminal iron(II) hydride than a bridging hydride.
The catalytic cycle closes with the protonation of [H1a]0 to produce the H2-adduct intermediate, [H21a]+, followed by the release of H2 from [H21a]+ to generate [1a]+. Although the two cycles are very similar energetically, the calculations predict that this protonation is thermodynamically less favorable for the apical–basal isomer [H1aB]0 than for the dibasal isomer [H1aA]0 by ~5 kcal mol−1.
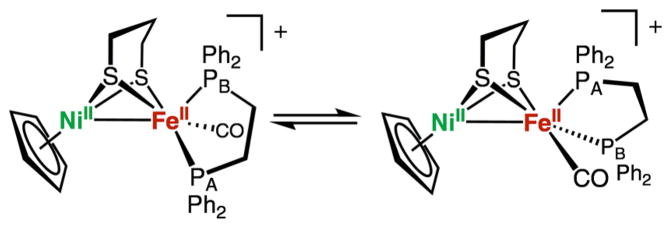
In light of these computational results, additional experiments were performed to probe for the presence of two isomers in the catalytic cycle. The calculated ν̃CO values for [1aA]0 and [1aB]0 are 1901 and 1904 cm−1, respectively, and the calculated ν̃CO values for [1aA]+ and [1aB]+ are 1946 and 1949 cm−1, respectively. The calculated ν̃CO values for all intermediates in the catalytic cycles are provided in Table S11. These small calculated ν̃CO differences between the isomers are within the numerical accuracy of DFT. As previously mentioned, solutions of [1a]+, which were synthesized directly, were confirmed crystallographically and spectroscopically to exist only in the dibasal geometry. However, the preparation of [1a]+ by the addition of excess acid to [1a]0, presumably going through the catalytic cycle(s) to generate H2, produced a solution containing both isomers of [1a]+. The 31P NMR spectrum of the [1a]+ solution obtained after presumably proceeding through the catalytic cycle(s) displayed two 31P NMR signals, one assigned to the dibasal isomer (cycle A), in which the two 31P centers are equivalent, and the other assigned to the apical–basal isomer (cycle B), in which the two 31P centers are equilibrated by the rocking motion shown in Figure 11. The free energy barrier to this rocking motion is calculated to be relatively low, ΔGǂ = 9.5 kcal mol−1, and the 31P NMR spectrum of the isomer mixture was unchanged when recorded at −100 °C, consistent with a relatively low free energy barrier. These analyses support the proposal that H2 evolution can proceed via either cycle A or cycle B shown in Figure 10, thereby producing both isomers of [1a]+.
Figure 11.
Representation of the iron-centered rocking motion in [1aB]+.
CONCLUSIONS
Experiment and theory indicate that the new complexes reported in this paper replicate aspects of the following enzyme states: Ni-SIa, Ni-L, Ni-C, and Ni-R. Two of these species, the NiIIFeII and NiIFeII derivatives, were crystallized and fully characterized. The other two species are implicated in a H2 evolution experiment and characterized computationally.
The Ni-SIa state is distinguished by the NiIIFeII bimetallic core and the absence of a third bridging ligand, features that are replicated in compounds [1a–1d]BF4. The Ni-L state is distinguished by the formal NiIFeII oxidation states, a feature that is replicated in [1a–1d]0. The oxidation state assignments are supported by EPR and Mössbauer spectroscopic data, crystallographic results, voltammetric measurements, and DFT calculations.
The previous attempts to model states with NiIIFeII cores suffered from the presence of six-coordinated iron centers.17,48 The NiIIFeII models reported in this paper, in fact, arise via such FeL4(μ-SR)2-containing intermediates, which undergo decarbonylation. DFT analysis of the bonding suggests that decarbonylation is driven by formation of the Ni–Fe bond. Although [1a–1d]+ and [2b]+ are reasonable spectroscopic models for the Ni-SIa state of the enzyme, challenges remain. In the Ni-SIa state, the nickel center binds CO to give Ni-SIaCO.6,49 In contrast, [1a–1d]+ exhibit no detectable affinity for CO. Substitution of the dithiolate bridge with bridging monothiolates, as in [2b]+, facilitates the binding of CO at iron. In contrast, the enzyme binds CO at nickel. This difference is understandable because the (C5H5)Ni(μ-SR)2 site has a higher electron count than the (RS)2Ni(μ-SR)2 site found in the enzyme. Replicating terminal thiolate ligation at nickel remains one of the central challenges in this area.50
The first attempts to model the mixed-valence active site of the Ni-L state focused on [(CO)2LFe(pdt)Ni-(diphosphine)]+.20,28 These cations are described as NiIIFeI, which is reversed from the NiIFeII states assigned in Ni-L. More recently, we have characterized complexes with the configuration NiIRuII, wherein the RuII center is redox-inactive.51 In this work, the Fe(CO)2(PR3) center in previous Fe–Ni models was replaced by a Fe(CO)(PR3)2 center, which stabilizes the FeII state, as illustrated by [1a–1d]0 and [2b]0.
Because they are substrates, hydrogenic ligands are a major focus in research concerning the hydrogenases and their models.52,53 The DFT-optimized analysis of the nickel(III)–iron(II) hydride [H1a]+ reveals that the unpaired electron is localized mainly in the nickel coordination sphere, as seen for Ni-C. In the model, the hydride ligand is more closely bound to iron than to nickel [Δ(M–H) ~ 0.2 Å]. This report is the first suggestion of the accessibility of such a state in [NiFe]-hydrogenase model complexes. In the enzyme, proton-transfer reactions are coupled to electron-transfer reactions,16 and a similar effect is seen in the reduction of [H1a]+ by [1a]0. The resulting nickel(II)–iron(II) hydride [H1a]0, analogous to the Ni-R state of the enzyme, reacts with proton sources to liberate H2. Although thwarting efforts to isolate this hydride, this facile protonolysis is analogous to the behavior of the Ni-R/Ni-SI pair.16 According to our calculations, the nickel(II)–iron(II) hydride is more accurately described as a terminal iron(II) hydride than a bridging hydride. In contrast, high-resolution X-ray crystallographic analysis of Ni-R from D. vulgaris reveals Ni–H and Fe–H distances of 1.58 and 1.78 Å (error 0.08 Å), respectively; i.e., the hydride is more closely associated with nickel.16 The structural difference between the model complex and the protein may reflect the influence of terminal thiolate ligands on nickel.50
EXPERIMENTAL SECTION
Reactions and manipulations were performed using standard Schlenk techniques at room temperature or in a nitrogen atmosphere glovebox. Solvents were HPLC-grade and dried by filtration through activated alumina or distilled under nitrogen over an appropriate drying agent. Bu4NPF6 (GFS Chemicals, Columbus, OH) was recrystallized multiple times from a CH2Cl2 solution by the addition of hexane. Chromatography was performed using Siliflash P60 from Silicycle (230–400 mesh). ESI-MS data for compounds were acquired using a Waters Micromass Quattro II spectrometer. 1H NMR spectra (500 MHz) were referenced to residual solvent relative to tetramethylsilane. 31P{1H} NMR spectra (202 MHz) were referenced to external 85% H3PO4. Fourier transform infrared (FT-IR) spectra were recorded on a PerkinElmer 100 FT-IR spectrometer. Crystallographic data for compounds [1a]0, [1c]0, [2b]0, and [2b]BF4 were collected using a Siemens SMART diffractometer equipped with a Mo Kα source (λ = 0.71073 Å), and crystallographic data for compounds [1a]BF4 and [1d]BF4 were collected using a Bruker D8 Venture diffractometer equipped with a Mo Kα microfocus source and a Photon 100 detector. X-band EPR spectra were recorded on a Varian E-line 12″ Century Series X-band continuous-wave spectrometer. Q-band ENDOR spectra were recorded on a Bruker Elexsys E580 Q-band pulse EPR spectrometer using a home-built pulse Q-band ENDOR resonator54 and an ENI 300L RF amplifier. Cryogenic temperatures were achieved using a Cryogenic Ltd. closed-cycle cryostat. ENDOR simulations and spectral fits were performed using EasySpin (“salt”)55 and home-written scripts in Matlab. Mössbauer spectra were recorded on an alternating constant-acceleration spectrometer. The minimum experimental line width was 0.24 mm s−1 (full width at half-maximum). The sample temperature was maintained constant in either an Oxford Variox or an Oxford Mössbauer-Spectromag cryostat. The latter is a split-pair conducting magnet system for applying fields of up to 8 T to the samples that can be kept at temperatures in the range 1.5–250 K. The field at the sample is perpendicular to the γ-ray beam. Isomer shifts are quoted relative to metallic iron at 300 K. Mössbauer spectra were simulated with a home-written spin-Hamiltonian program based on the usual nuclear Hamiltonian formalism.37
[(C5H5)3Ni2]BF4, [(MeC5H4)3Ni2]BF4, and [(C5D5)3Ni2]BF4
In a modification of Werner’s procedure,56 a solution of nickelocene (2.08 g, 11.0 mmol) in Et2O (150 mL) was treated dropwise with an excess of HBF4·Et2O (2 mL, 13.8 mol). Over the course of several minutes, a purple solid precipitated from a pale yellow solution. The solid was collected by filtration and washed thoroughly with ether. Yield: 2.07 g (95%). 1H NMR (nitromethane-d3): δ 5.48 (10H, s), 4.80 (5H, s). 13C{1H} NMR (nitromethane-d3): δ 87.8, 56.6.
[(C5H5)Ni(pdt)Fe(dppe)(CO)]BF4 ([1a]BF4)
To a solution of [(C5H5)3Ni2]BF4 (498 mg, 1.24 mmol) in CH3NO2 (50 mL) was added a solution of Fe(pdt)(dppe)(CO)222 (771 mg, 1.25 mmol) in CH3NO2 (25 mL). After 30 min, the slurry converted to a dark-red solution. Solvent was removed under reduced pressure, and the residue was washed several times with pentane until the filtrate was colorless. The residue was extracted into a minimal volume of CH2Cl2 and subjected to column chromatography. Byproducts elute with 100% CH2Cl2. The product eluted with 90:10 CH2Cl2/THF as a dark-red band. The solvent was removed under reduced pressure to yield a dark-red solid. Yield: 841 mg (85%). 1H NMR (acetone-d6): 8.01 (m, 4H), 7.5 (m, 16H), 4.75 (s, 5H, C5H5), 3.83 (m, 2H, PCH2CH2P), 3.62 (m, 2H, PCH2CH2P), 2.83 (m, 3H), 2.43 (m, 2H), 1.66 (m, 1H, S2CH2CH2CH2S2). 31P{1H} NMR (acetone-d6): δ 77.1. ESI-MS: m/z 711 ([M]+), 683 ([M – CO]+). IR (CH2Cl2): ν̃CO 1943 cm−1 (THF). Anal. Calcd for C35H35FeNiOP2S2 (found): C, 52.61 (52.67); H, 4.42 (4.70). Single crystals of [1a]BF4 were obtained by vapor diffusion of pentane into THF solutions.
[(C5H5)Ni(pdt)Fe(dppv)(CO)]BF4 ([1b]BF4)
Compound [1b]BF4 was prepared in a fashion similar to that of [1a]BF4 using Fe(pdt)(dppv)(CO)222 as the iron reagent. Yield: 66%, dark-red powder. 1H NMR (CH2Cl2): δ 8.44 (m, 2H, PCHCHP), 7.91 (br, 4H), 7.54 (s, br, 4H), 7.45 (s, br 12H), 4.31 (s, 5H, C5H5), 2.77 (m, 3H) 2.36 (m, 2H), 1.69 (m, 1H, S2CH2CH2CH2S2). 31P{1H} NMR (CH2Cl2): δ 83.8. ESI-MS: m/z 709 ([M]+), 681 ([M – CO]+). IR (CH2Cl2): ν̃CO 1951 cm−1.
[(C5H5)Ni(Me2pdt)Fe(dppe)(CO)]BF4 ([1c]BF4)
Compound [1c]BF4 was prepared in a fashion similar to that of [1a]BF4 using Fe(Me2pdt)(dppe)(CO)222 as the iron source. Yield: 77%, dark-red powder. 1H NMR (CH2Cl2): δ 7.77 (m, 4H), 7.46 (m, 16), 4.46 (s, 5H, C5H5), 3.65 (m, 2H, PCH2CH2P), 3.11 (m, 2H PCH2CH2P), 2.71 (m, 2H, S2CH2CMe2CH2S2), 2.17 (m, 2H, S2CH2CMe2CH2S2), 1.50 (s, 3H, S2CH2CMe2CH2S2), 1.19 (s, S2CH2CMe2CH2S2). 31P{1H} NMR (CD2Cl2): δ 75.1. ESI-MS: m/z 739 ([M]+), 711 ([M – CO]+). IR (CH2Cl2): ν̃CO 1940 cm−1. Single crystals of [1c]BF4 were obtained by evaporation of concentrated THF solutions.
[(CH3C5H4)Ni(pdt)Fe(dppe)(CO)]BF4 ([1d]BF4)
Compound [1d]BF4 was prepared in a similar fashion to [1a]BF4 using the [(CH3C5H4)3Ni2]BF4 as the nickel source and Fe(pdt)(dppe)(CO)2 as the iron source. Yield: 81%, dark-red powder. 1H NMR (CH2Cl2): δ 7.80 (br, 4H) 7.52 (br, 4H) 7.43(br, 12H), 4.67 (br, 1H) 3.91 (br, 1H), 3.82 (s, 3H), 3.43 (m, 2H, PCH2CH2P), 3.05 (m, 2H, PCH2CH2P), 3.05 (m, 3H), 2.31 (m, 2H), 1.89 (br, 2H), 1.75 (m, 1H, S2CH2CH2CH2S2). 31P{1H} NMR (CD2Cl2): δ 79.2. ESI-MS: m/z 725 ([M]+), 697 ([M – CO]+). IR (CH2Cl2): ν̃CO 1943 cm−1.
[(C5D5)Ni(pdt)Fe(dppe)(CO)]BF4 ([1a]BF4-d5)
Compound [1a]BF4-d5 was prepared in a fashion similar to that of [1a]BF4 using [(C5D5)3Ni2]BF4 as the nickel source. The product was characterized by ESI-MS, which indicated >95% deuteration (see the Supporting Information).
Fe(SPh)2(CO)2(dppv)
This compound was synthesized in a fashion similar to that of the published procedure.57 To a mixture of FeSO4·7H2O (1.112g, 4.0 mmol) and dppv (1.584 g, 4.0 mmol) in MeOH (80 mL) was added dropwise a solution of PhSNa (1.056 g, 8.0 mmol) in MeOH (20 mL) with stirring under the presence of CO. After stirring for 6 h at room temperature, the solvent was removed under reduced pressure. The residue was extracted with CH2Cl2 (40 mL). After filtration to remove Na2SO4, the extract was concentrated (15 mL) and diluted with hexane (50 mL). Cooling this mixture at −20 °C for 12 h gave a red solid. Yield: 2.23 g (77%). 1H NMR (CD2Cl2): δ 6.85–8.03 (32H, m). 31P{1H} NMR (CD2Cl2): δ 81.9 (d, J = 55 Hz), 61.1 (d, J = 55 Hz). IR (CH2Cl2): ν̃CO 2023, 1978 cm−1.
[(C5H5)Ni(SPh)2Fe(dppv)(CO)2]BF4 ([2bCO]BF4)
To a solution of [(C5H5)3Ni2]BF4 (200 mg, 0.5 mmol) in CH3NO2 (15 mL) was added a solution of Fe(SPh)2(dppv)(CO)2 (364 mg, 0.5 mmol) in CH3NO2 (10 mL). After 30 min, the slurry converted to a dark-red solution. Solvent was removed under reduced pressure, and the residue was washed with pentane until the filtrate was colorless. The residue was extracted into a minimal volume of CH2Cl2 and subjected to column chromatography. After eluting impurities with 100% CH2Cl2, the product eluted with 90:10 CH2Cl2/THF as a dark-red band. The solvent was removed under reduced pressure to yield a dark-red solid. Yield: 380 mg (81%). 1H NMR (CD2Cl2): δ 6.85–8.57 (32H, m), δ 4.46 (5H, s). 31P{1H} NMR (CD2Cl2): δ 75.9 (d, J = 45 Hz), 64.2 (d, J = 45 Hz). ESI-MS: m/z 849 ([M]+), 821 ([M – CO]+), 793 ([M – 2CO]+). IR (CH2Cl2): ν̃CO 2042, 2002 cm−1. Anal. Calcd for C45H37BF4FeNiO2P2S2·CH2Cl2 (found): C, 54.05 (53.69); H, 3.85 (3.72). Single crystals of [2bCO]BF4 were obtained by solvent diffusion of pentane into CH2Cl2 solutions.
[(C5H5)Ni(SPh)2Fe(dppv)(CO)]BF4 ([2b]BF4)
To a solution of [2bCO]BF4 (280 mg, 0.3 mmol) in CH2Cl2 (30 mL) was added Me3NO·2H2O (34 mg, 0.3 mmol). After 1 h, the solvent was removed under reduced pressure, and the residue was washed several times with pentane. The residue was extracted into a minimal volume of CH2Cl2 (5 mL), pentane (30 mL) was added, and the mixture was cooled to −20 °C. The product was collected as a black powder. Yield: 200 mg (74%). 31P{1H} NMR (CD2Cl2): δ 78.8. ESI-MS: m/z 821 ([M]+), 793 ([M – CO]+). IR (CH2Cl2): ν̃CO 1956 cm−1. Anal. Calcd for C44H37BF4FeNiOP2S2·0.5CH2Cl2 (found): C, 56.16 (56.08); H, 4.02 (4.19).
(C5H5)Ni(pdt)Fe(dppe)(CO) ([1a]0)
To a stirred solution of [1a]BF4 (21.2 mg, 26.5 μmol) in THF (3 mL) was added cobaltocene (5.8 mg, 30.7 μmol) in THF (3 mL). The solution immediately darkened, and solid [(C5H5)2Co]BF4 precipitated. The solvent is removed under reduced pressure, and the product was extracted into toluene (2 mL). The slurry was filtered through diatomaceous earth to yield a homogeneous, brown-black solution. The product is crystallized upon the addition of pentane (15 mL). Yield: 17.0 mg (90%), black powder. Single crystals were obtained by vapor diffusion of pentane into concentrated toluene solutions. IR (CH2Cl2): ν̃CO 1901 cm−1. Anal. Calcd for C35H35FeNiOP2S2 (found): C, 59.02 (58.72); H, 4.95 (4.65).
(C5H5)Ni(pdt)Fe(dppv)(CO) ([1b]0)
Compound [1b]0 was prepared in a fashion similar to that of [1a]0. Yield: 86%, black powder. IR (CH2Cl2): ν̃CO 1903 cm−1.
(C5H5)Ni(Me2pdt)Fe(dppe)(CO) ([1c]0)
Compound [1c]0 was prepared in a fashion similar to that of [1a]0. Yield: 87%, black powder. IR (CH2Cl2): ν̃CO 1897 cm−1.
(CH3C5H4)Ni(pdt)Fe(dppe)(CO) ([1d]0)
Compound [1d]0 was prepared in a fashion similar to that of [1a]0. Yield: 80%, black powder. IR (CH2Cl2): ν̃CO 1898 cm−1.
(C5D5)Ni(pdt)Fe(dppe)(CO) ([1a-d5]0)
Compound [1a-d5]0 was prepared in a fashion similar to that of [1a]0.
(C5H5)Ni(SPh)2Fe(dppv)(CO) ([2b]0)
Compound [2b]0 was prepared in a fashion similar to that of [1a]0. Yield: 61%, black powder. IR (CH2Cl2): ν̃CO 1915 cm−1. Single crystals of [2b]0 were obtained by vapor diffusion of pentane into concentrated toluene solutions.
COMPUTATIONAL METHODS
DFT results reported herein were performed using the BP86 density functional.58,59 Additional benchmarking was performed using the B3P86,58,60 BP86-D2,58,59,61 M06-L,62 and ωB97XD61,63–65 functionals and is presented in Tables S1–S7. The DFT calculations were performed with the Stuttgart pseudopotential and associated basis set of Preuss and co-workers (SDD)66 for the nickel and iron centers, the 6-31G** basis set67 for the μ-hydrogen ligand, and the 6-31G* basis set68,69 for all other atoms. The starting geometries for [1a–1d]+, [1a]0, and [2b]0 were obtained from their respective crystal structures. The starting coordinates for species without crystal structures were obtained by manual alteration of the most closely related crystal structure. Solvation free energies were calculated in CH2Cl2 using the conductor-like polarizable continuum model (C-PCM)70,71 with the Bondi atomic radii72 and including the nonelectrostatic contributions of dispersion,73,74 repulsion,73,74 and cavitation energies.75
For the results presented in the main paper, geometry optimizations were performed in the gas phase. However, geometry optimizations were also performed in solution and were found to be consistent with the gas-phase optimizations. A comparison of the structures optimized in the gas and solution phases is provided in Tables S4–S7. In all cases, the minimum-energy structures were confirmed to have no imaginary frequencies. The ν̃CO frequencies were calculated within the harmonic model. Typically, DFT is more reliable for calculating changes in the frequencies than the absolute frequencies, and often scaling factors dependent on the functional are used.76 Herein, however, the absolute ν̃CO values are reported because the BP86 functional gives excellent agreement with the experimental values without the application of scaling factors. Nonetheless, Δν̃CO values calculated using different functionals are provided in Table S3. The TSs for isomerization of the Fe(dppe)(CO) subunit were identified using the synchronous transit-guided quasi-Newton method,77,78 and the TSs were confirmed to have only one imaginary frequency. Each TS was verified to lead to the relevant dibasal or apical–basal isomers by following the intrinsic reaction coordinate using the local quadratic approximation79,80 for 5–10 steps in the forward and reverse directions and subsequently optimizing the geometries.
Thermochemical data were calculated at T = 298.15 K. All calculated free energies included zero-point energy, entropic contributions, and solvation effects. The reaction free energies (ΔG°) and free energy barriers (ΔGǂ) associated with isomerization of the Fe(dppe)(CO) subunit in solution were calculated from the optimized geometries and TSs. The relative reduction potentials were calculated from the corresponding reaction free energies using a methodology described elsewhere.81–84 Chemical bonding analysis was performed using the Pipek–Mezey localization criteria,44 using keyword IOp(4/9=20212), and NBOs.45 All calculations were performed using the Gaussian 09 electronic structure program.85 Structures and energies of the systems studied herein are provided in Tables S12–S73.
Supplementary Material
Acknowledgments
The synthesis work was supported by the National Institutes of Health through Grant GM061153 and the International Center of Carbon-Neutral Energy Research. We thank Bernd Mienert for the Mössbauer measurements and Dr. Eckhard Bill for insight into their interpretation. We also thank Katharina Weber for help with sample preparation and preliminary DFT calculations. The computational portion of this work was funded by the National Science Foundation Graduate Research Fellowship Program under Grant DGE-1144245 (to M.T.H.) and by the National Science Foundation Center for Chemical Innovation under Grant CHE-1305124. We thank Dr. Danielle Gray for assistance with the X-ray crystallographic analysis.
Footnotes
Notes
The authors declare no competing financial interest.
The Supporting Information is available free of charge on the ACS Publications website at DOI: 10.1021/acs.inorg-chem. 5b01662.
Experimental details, calculated reduction potentials, Δν̃CO, a comparison of crystal and DFT-optimized structures using different DFT functionals, calculated relative free energies, barriers, and spin densities for all intermediates in the catalytic cycles, extended discussion of the Ni–Fe bond, discussion of the TS and isomerization for [1a]+ and [1a]0, and coordinates and energies of all optimized structures (PDF)
X-ray crystallographic data in CIF format (CIF)
References
- 1.Bullock RM, Appel AM, Helm ML. Chem Commun. 2014;50:3125. doi: 10.1039/c3cc46135a. [DOI] [PubMed] [Google Scholar]
- 2.Wang M, Chen L, Sun L. Energy Environ Sci. 2012;5:6763. [Google Scholar]
- 3.Lansing JC, Manor BC, Rauchfuss TB. In: Encyclopedia of Inorganic and Bioinorganic Chemistry. Scott RA, editor. John Wiley; Chichester, U.K: 2014. [Google Scholar]
- 4.Schollhammer P, Weigand W, editors. Bioinspired Catalysis. Wiley-VCH; Weinheim, Germany: 2014. [Google Scholar]
- 5.Frey M. Chem Bio Chem. 2002;3:153. [Google Scholar]
- 6.Lubitz W, Ogata H, Rüdiger O, Reijerse E. Chem Rev. 2014;114:4081. doi: 10.1021/cr4005814. [DOI] [PubMed] [Google Scholar]
- 7.Tard C, Pickett CJ. Chem Rev. 2009;109:2245. doi: 10.1021/cr800542q. [DOI] [PubMed] [Google Scholar]
- 8.Parkin A, Sargent F. Curr Opin Chem Biol. 2012;16:26. doi: 10.1016/j.cbpa.2012.01.012. [DOI] [PubMed] [Google Scholar]
- 9.Wulff P, Day CC, Sargent F, Armstrong FA. Proc Natl Acad Sci U S A. 2014;111:6606. doi: 10.1073/pnas.1322393111. [DOI] [PMC free article] [PubMed] [Google Scholar]
- 10.Berggren G, Adamska A, Lambertz C, Simmons TR, Esselborn J, Atta M, Gambarelli S, Mouesca JM, Reijerse E, Lubitz W, Happe T, Artero V, Fontecave M. Nature. 2013;499:66. doi: 10.1038/nature12239. [DOI] [PMC free article] [PubMed] [Google Scholar]
- 11.Carroll ME, Barton BE, Rauchfuss TB, Carroll PJ. J Am Chem Soc. 2012;134:18843. doi: 10.1021/ja309216v. [DOI] [PMC free article] [PubMed] [Google Scholar]
- 12.Ohki Y, Tatsumi K. Eur J Inorg Chem. 2011;2011:973. [Google Scholar]
- 13.Chiou TW, Liaw WF. C R Chim. 2008;11:818. [Google Scholar]
- 14.Barton BE, Rauchfuss TB. J Am Chem Soc. 2010;132:14877. doi: 10.1021/ja105312p. [DOI] [PMC free article] [PubMed] [Google Scholar]; Manor BC, Rauchfuss TB. J Am Chem Soc. 2013;135:11895. doi: 10.1021/ja404580r. [DOI] [PMC free article] [PubMed] [Google Scholar]
- 15.Ogo S, Ichikawa K, Kishima T, Matsumoto T, Nakai H, Kusaka K, Ohhara T. Science. 2013;339:682. doi: 10.1126/science.1231345. [DOI] [PubMed] [Google Scholar]
- 16.Ogata H, Nishikawa K, Lubitz W. Nature. 2015;520:571. doi: 10.1038/nature14110. [DOI] [PubMed] [Google Scholar]
- 17.Jiang J, Maruani M, Solaimanzadeh J, Lo W, Koch SA, Millar M. Inorg Chem. 2009;48:6359. doi: 10.1021/ic900929u. [DOI] [PubMed] [Google Scholar]
- 18.Krämer T, Kampa M, Lubitz W, van Gastel M, Neese F. Chem Bio Chem. 2013;14:1898. doi: 10.1002/cbic.201300104. [DOI] [PubMed] [Google Scholar]
- 19.Kampa M, Lubitz W, van Gastel M, Neese F. JBIC, J Biol Inorg Chem. 2012;17:1269. doi: 10.1007/s00775-012-0941-9. [DOI] [PubMed] [Google Scholar]
- 20.Schilter D, Nilges MJ, Chakrabarti M, Lindahl PA, Rauchfuss TB, Stein M. Inorg Chem. 2012;51:2338–2348. doi: 10.1021/ic202329y. [DOI] [PMC free article] [PubMed] [Google Scholar]
- 21.Huynh MT, Schilter D, Hammes-Schiffer S, Rauchfuss TB. J Am Chem Soc. 2014;136:12385. doi: 10.1021/ja505783z. [DOI] [PMC free article] [PubMed] [Google Scholar]
- 22.Carroll ME, Chen J, Gray DE, Lansing JC, Rauchfuss TB, Schilter D, Volkers PI, Wilson SR. Organometallics. 2014;33:858. doi: 10.1021/om400752a. [DOI] [PMC free article] [PubMed] [Google Scholar]
- 23.De Lacey AL, Fernández VM, Rousset M, Cammack R. Chem Rev. 2007;107:4304. doi: 10.1021/cr0501947. [DOI] [PubMed] [Google Scholar]
- 24.Siegbahn PEM, Tye JW, Hall MB. Chem Rev. 2007;107:4414. doi: 10.1021/cr050185y. [DOI] [PubMed] [Google Scholar]
- 25.Wu H, Hall MB. C R Chim. 2008;11:790. [Google Scholar]
- 26.Hidalgo R, Ash PA, Healy AJ, Vincent KA. Angew Chem, Int Ed. 2015;54:7110. doi: 10.1002/anie.201502338. [DOI] [PMC free article] [PubMed] [Google Scholar]
- 27.Greene BL, Wu CH, McTernan PM, Adams MWW, Dyer RB. J Am Chem Soc. 2015;137:4558. doi: 10.1021/jacs.5b01791. [DOI] [PubMed] [Google Scholar]
- 28.Schilter D, Rauchfuss TB, Stein M. Inorg Chem. 2012;51:8931. doi: 10.1021/ic300910r. [DOI] [PMC free article] [PubMed] [Google Scholar]
- 29.Priego JL, Doerrer LH, Rees LH, Green MLH. Chem Commun. 2000:779. [Google Scholar]
- 30.Seiler P, Dunitz JD. Acta Crystallogr, Sect B: Struct Crystallogr Cryst Chem. 1980;36:2255. [Google Scholar]
- 31.Byers LR, Dahl LF. Inorg Chem. 1980;19:680. [Google Scholar]
- 32.Lubitz W, van Gastel M, Gärtner W. In: Nickel and Its Surprising Impact in Nature. Sigel A, Sigel H, Sigel RKO, editors. Wiley-VCH; Weinheim, Germany: 2007. p. 279. [Google Scholar]
- 33.Carroll ME, Chen JZ, Gray DE, Lansing JC, Rauchfuss TB, Schilter D, Volkers PI, Wilson SR. Organometallics. 2014;33:858. doi: 10.1021/om400752a. [DOI] [PMC free article] [PubMed] [Google Scholar]
- 34.Kellers P, Pandelia ME, Currell LJ, Görner H, Lubitz W. Phys Chem Chem Phys. 2009;11:8680. doi: 10.1039/b913635e. [DOI] [PubMed] [Google Scholar]
- 35.Pandelia ME, Infossi P, Stein M, Giudici-Orticoni MT, Lubitz W. Chem Commun. 2012;48:823. doi: 10.1039/c1cc16109a. [DOI] [PubMed] [Google Scholar]
- 36.Kampa M, Pandelia ME, Lubitz W, van Gastel M, Neese F. J Am Chem Soc. 2013;135:3915. doi: 10.1021/ja3115899. [DOI] [PubMed] [Google Scholar]
- 37.Gütlich P, Bill E, Trautwein AX. Mössbauer Spectroscopy and Transition Metal Chemistry. Fundamentals and Applications. Springer; Berlin: 2011. [Google Scholar]
- 38.Pandelia ME, Bykov D, Izsak R, Infossi P, Giudici-Orticoni MT, Bill E, Neese F, Lubitz W. Proc Natl Acad Sci U S A. 2013;110:483. doi: 10.1073/pnas.1202575110. [DOI] [PMC free article] [PubMed] [Google Scholar]
- 39.Surerus KK, Chen M, van der Zwaan JW, Rusnak FM, Kolk M, Duin EC, Albracht SPJ, Muenck E. Biochemistry. 1994;33:4980. doi: 10.1021/bi00182a029. [DOI] [PubMed] [Google Scholar]
- 40.Pereira AS, Tavares P, Moura I, Moura JJG, Huynh BH. J Am Chem Soc. 2001;123:2771. doi: 10.1021/ja003176+. [DOI] [PubMed] [Google Scholar]
- 41.Popescu CV, Münck E. J Am Chem Soc. 1999;121:7877. [Google Scholar]
- 42.Zhu W, Marr AC, Wang Q, Neese F, Spencer DJE, Blake AJ, Cooke PA, Wilson C, Schröder M. Proc Natl Acad Sci U S A. 2005;102:18280. doi: 10.1073/pnas.0505779102. [DOI] [PMC free article] [PubMed] [Google Scholar]
- 43.Schilter D, Pelmenschikov V, Wang H, Meier F, Gee LB, Yoda Y, Kaupp M, Rauchfuss TB, Cramer SP. Chem Commun. 2014;50:13469. doi: 10.1039/c4cc04572f. [DOI] [PMC free article] [PubMed] [Google Scholar]
- 44.Pipek J, Mezey PG. J Chem Phys. 1989;90:4916. [Google Scholar]
- 45.Glendening ED, Reed AE, Carpenter JE, Weinhold F. NBO. University of Wisconsin System; Madison, WI: 1996. version 3.1. [Google Scholar]
- 46.Pool DH, DuBois DL. J Organomet Chem. 2009;694:2858. [Google Scholar]
- 47.Wang W, Rauchfuss TB, Moore CE, Rheingold AL, De Gioia L, Zampella G. Chem - Eur J. 2013;19:15476. doi: 10.1002/chem.201303351. [DOI] [PubMed] [Google Scholar]
- 48.Li Z, Ohki Y, Tatsumi K. J Am Chem Soc. 2005;127:8950. doi: 10.1021/ja051590+. [DOI] [PubMed] [Google Scholar]
- 49.Pandelia ME, Ogata H, Currell LJ, Flores M, Lubitz W. Biochim Biophys Acta, Bioenerg. 2010;1797:304. doi: 10.1016/j.bbabio.2009.11.002. [DOI] [PubMed] [Google Scholar]
- 50.Weber K, Krämer T, Shafaat HS, Weyhermüller T, Bill E, van Gastel M, Neese F, Lubitz W. J Am Chem Soc. 2012;134:20745. doi: 10.1021/ja309563p. [DOI] [PubMed] [Google Scholar]
- 51.Chambers GM, Mitra J, Rauchfuss TB, Stein M. Inorg Chem. 2014;53:4243. doi: 10.1021/ic500389p. [DOI] [PubMed] [Google Scholar]
- 52.Tschierlei S, Ott S, Lomoth R. Energy Environ Sci. 2011;4:2340. [Google Scholar]
- 53.Gloaguen F, Rauchfuss TB. Chem Soc Rev. 2009;38:100. doi: 10.1039/b801796b. [DOI] [PMC free article] [PubMed] [Google Scholar]
- 54.Reijerse E, Lendzian F, Isaacson R, Lubitz W. J Magn Reson. 2012;214:237. doi: 10.1016/j.jmr.2011.11.011. [DOI] [PubMed] [Google Scholar]
- 55.Stoll S, Schweiger A. J Magn Reson. 2006;178:42. doi: 10.1016/j.jmr.2005.08.013. [DOI] [PubMed] [Google Scholar]
- 56.Salzer A, Werner H. Angew Chem, Int Ed Engl. 1972;11:930. [Google Scholar]
- 57.de Beer JA, Haines RJ. J Organomet Chem. 1972;36:297. [Google Scholar]
- 58.Perdew JP. Phys Rev B: Condens Matter Mater Phys. 1986;33:8822. doi: 10.1103/physrevb.33.8822. [DOI] [PubMed] [Google Scholar]
- 59.Becke AD. Phys Rev A: At, Mol, Opt Phys. 1988;38:3098. doi: 10.1103/physreva.38.3098. [DOI] [PubMed] [Google Scholar]
- 60.Becke AD. J Chem Phys. 1993;98:5648. [Google Scholar]
- 61.Grimme S. J Comput Chem. 2006;27:1787. doi: 10.1002/jcc.20495. [DOI] [PubMed] [Google Scholar]
- 62.Zhao Y, Truhlar DG. J Chem Phys. 2006;125:194101. doi: 10.1063/1.2370993. [DOI] [PubMed] [Google Scholar]
- 63.Becke AD. J Chem Phys. 1997;107:8554. [Google Scholar]
- 64.Kamiya M, Tsuneda T, Hirao K. J Chem Phys. 2002;117:6010. [Google Scholar]
- 65.Chai JD, Head-Gordon M. Phys Chem Chem Phys. 2008;10:6615. doi: 10.1039/b810189b. [DOI] [PubMed] [Google Scholar]
- 66.Dolg M, Wedig U, Stoll H, Preuss H. J Chem Phys. 1987;86:866. [Google Scholar]
- 67.Hariharan PC, Pople JA. Theoret Chim Acta. 1973;28:213. [Google Scholar]
- 68.Hehre WJ, Ditchfield R, Pople JA. J Chem Phys. 1972;56:2257. [Google Scholar]
- 69.Francl MM, Pietro WJ, Hehre WJ, Binkley JS, Gordon MS, DeFrees DJ, Pople JA. J Chem Phys. 1982;77:3654. [Google Scholar]
- 70.Barone V, Cossi M. J Phys Chem A. 1998;102:1995. [Google Scholar]
- 71.Cossi M, Rega N, Scalmani G, Barone V. J Comput Chem. 2003;24:669. doi: 10.1002/jcc.10189. [DOI] [PubMed] [Google Scholar]
- 72.Bondi A. J Phys Chem. 1964;68:441. [Google Scholar]
- 73.Floris F, Tomasi J. J Comput Chem. 1989;10:616. [Google Scholar]
- 74.Floris FM, Tomasi J, Ahuir JLP. J Comput Chem. 1991;12:784. [Google Scholar]
- 75.Pierotti RA. Chem Rev. 1976;76:717. [Google Scholar]
- 76.Alecu IM, Zheng J, Zhao Y, Truhlar DG. J Chem Theory Comput. 2010;6:2872. doi: 10.1021/ct100326h. [DOI] [PubMed] [Google Scholar]
- 77.Peng C, Bernhard Schlegel H. Isr J Chem. 1993;33:449. [Google Scholar]
- 78.Peng C, Ayala PY, Schlegel HB, Frisch MJ. J Comput Chem. 1996;17:49. [Google Scholar]
- 79.Page M, McIver JW. J Chem Phys. 1988;88:922. [Google Scholar]
- 80.Koseki S, Gordon MS. J Phys Chem. 1989;93:118. [Google Scholar]
- 81.Solis BH, Hammes-Schiffer S. Inorg Chem. 2011;50:11252. doi: 10.1021/ic201842v. [DOI] [PubMed] [Google Scholar]
- 82.Fernandez LE, Horvath S, Hammes-Schiffer S. J Phys Chem C. 2012;116:3171. [Google Scholar]
- 83.Solis BH, Hammes-Schiffer S. Inorg Chem. 2014;53:6427. doi: 10.1021/ic5002896. [DOI] [PubMed] [Google Scholar]
- 84.Qi XJ, Fu Y, Liu L, Guo QX. Organometallics. 2007;26:4197. [Google Scholar]
- 85.Frisch MJ, Trucks GW, Schlegel HB, Scuseria GE, Robb MA, Cheeseman JR, Scalmani G, Barone V, Mennucci B, Petersson GA, Nakatsuji H, Caricato M, Li X, Hratchian HP, Izmaylov AF, Bloino J, Zheng G, Sonnenberg JL, Hada M, Ehara M, Toyota K, Fukuda R, Hasegawa J, Ishida M, Nakajima T, Honda Y, Kitao O, Nakai H, Vreven T, Montgomery JA, Jr, Peralta JE, Ogliaro F, Bearpark M, Heyd JJ, Brothers E, Kudin KN, Staroverov VN, Kobayashi R, Normand J, Raghavachari K, Rendell A, Burant JC, Iyengar SS, Tomasi J, Cossi M, Rega N, Millam JM, Klene M, Knox JE, Cross JB, Bakken V, Adamo C, Jaramillo J, Gomperts R, Stratmann RE, Yazyev O, Austin AJ, Cammi R, Pomelli C, Ochterski JW, Martin RL, Morokuma K, Zakrzewski VG, Voth GA, Salvador P, Dannenberg JJ, Dapprich S, Daniels AD, Farkas, Foresman JB, Ortiz JV, Cioslowski J, Fox DJ. Gaussian 09. Gaussian, Inc; Wallingford, CT: 2010. revision D.01. [Google Scholar]
- 86.Roncaroli F, Bill E, Friedrich B, Lenz O, Lubitz W, Pandelia ME. Chem Sci. 2015;6:4495–4507. doi: 10.1039/c5sc01560j. [DOI] [PMC free article] [PubMed] [Google Scholar]
Associated Data
This section collects any data citations, data availability statements, or supplementary materials included in this article.


