

Abstract
Objective:
To investigate the top late-onset Alzheimer disease (LOAD) risk loci detected or confirmed by the International Genomics of Alzheimer's Project for association with brain gene expression levels to identify variants that influence Alzheimer disease (AD) risk through gene expression regulation.
Methods:
Expression levels from the cerebellum (CER) and temporal cortex (TCX) were obtained using Illumina whole-genome cDNA-mediated annealing, selection, extension, and ligation assay (WG-DASL) for ∼400 autopsied patients (∼200 with AD and ∼200 with non-AD pathologies). We tested 12 significant LOAD genome-wide association study (GWAS) index single nucleotide polymorphisms (SNPs) for cis association with levels of 34 genes within ±100 kb. We also evaluated brain levels of 14 LOAD GWAS candidate genes for association with 1,899 cis-SNPs. Significant associations were validated in a subset of TCX samples using next-generation RNA sequencing (RNAseq).
Results:
We identified strong associations of brain CR1, HLA-DRB1, and PILRB levels with LOAD GWAS index SNPs. We also detected other strong cis-SNPs for LOAD candidate genes MEF2C, ZCWPW1, and SLC24A4. MEF2C and SLC24A4, but not ZCWPW1 cis-SNPs, also associate with LOAD risk, independent of the index SNPs. The TCX expression associations could be validated with RNAseq for CR1, HLA-DRB1, ZCWPW1, and SLC24A4.
Conclusions:
Our results suggest that some LOAD GWAS variants mark brain regulatory loci, nominate genes under regulation by LOAD risk variants, and annotate these variants for their brain regulatory effects.
Genome-wide association studies (GWASs) of late-onset Alzheimer disease (LOAD) identified 9 risk loci and confirmed APOE.1–5 The International Genomics of Alzheimer's Project (IGAP) identified 11 additional loci and confirmed 8 of the 9 initial loci.5 The “disease GWAS” approach does not uncover the identities of the disease risk gene or functional risk variants. Furthermore, some index single nucleotide polymorphisms (SNPs) identified by this approach are near more than 1 gene. It is evident that alternative approaches are needed for the discovery of the disease genes/variants and for uncovering their mechanism of action.6
We hypothesize that many LOAD GWAS loci harbor functional variants that influence disease risk by their effects on brain gene expression. We previously determined that some of the most significant (index) LOAD GWAS SNPs and other variants at the top LOAD risk loci associate with brain levels of nearby genes.7 Others also identified strong cis-expression SNPs (cis-eSNPs) at LOAD risk loci.8–10 Collectively, these findings strongly suggest the presence of regulatory LOAD risk variants at these loci.
In this study, we comprehensively analyzed LOAD GWAS loci not previously assessed by (1) testing the influence of the index SNPs on brain expression levels of all nearby genes and (2) fine mapping cis-eSNPs that associate with brain levels of candidate genes nominated by LOAD GWAS. We annotate these variants for their effects on brain expression, Alzheimer disease (AD) risk, and regulatory potential. Our findings have implications in the search for functional variants and the identity of the AD genes at these loci.
METHODS
Patients and samples.
All patients were from the Mayo Clinic Brain Bank and underwent neuropathologic evaluation by Dr. Dennis Dickson. All patients with AD had a Braak score of ≥4.0 and patients without AD had a Braak score of ≤2.5. Many of the patients without AD had unrelated pathologies. All patients with AD had a definite diagnosis according to National Institute of Neurological and Communicative Disorders and Stroke and the Alzheimer's Disease and Related Disorders Association criteria.11 All patients were part of the published Mayo Clinic LOAD GWAS12 and expression GWAS.7,13 RNA samples were isolated from 2 brain regions: cerebellum (CER) (AD n = 197 and non-AD n = 177) and temporal cortex (TCX) (AD n = 202 and non-AD, n = 197), as described previously.7,13 Three-hundred forty patients had measurements in both CER and TCX. CER was chosen, as it is a relatively unaffected region in AD, whereas TCX is typically one of the first regions affected by AD neuropathology.14 Choice of both typically unaffected (CER) and affected (TCX) brain regions enables minimization of any confounds on gene expression from AD neuropathology as well as evaluation of disease-relevant brain region, respectively, within the same study. Additional details are provided in table e-1 at Neurology.org/ng.
Standard protocol approvals, registrations, and patient consents.
This study was approved by the appropriate institutional review board.
Gene expression measures.
Total RNA, used in both the array-based Illumina whole-genome cDNA-mediated annealing, selection, extension, and ligation assay (WG-DASL) and next-generation RNA sequencing (RNAseq) (Illumina, San Diego, CA), was isolated from frozen brain tissue using the Ambion RNAqueous kit (Life Technologies, Grand Island, NY) and assessed for RNA quality and quantity using the Agilent RNA 6000 Nano Chip and Agilent 2100 Bioanalyzer (Agilent Technologies, Santa Clara, CA). Gene expression levels were previously collected for all samples using WG-DASL as described elsewhere13 and in appendix e-1. We considered only those probes that were expressed in ≥50% of the patients in at least 1 tissue (detection p < 0.05). We subsequently collected TCX gene expression measures for a subset of the AD samples using next-generation RNAseq (n = 94, table e-1) on Illumina HiSeq, which were used for validation of significant WG-DASL TCX findings. Further details are provided in appendix e-1.
Genotyping.
Index SNPs.
We genotyped 11 novel LOAD risk SNPs (or their proxies) identified by the IGAP consortium5 and 2 SNPs at additional loci (CR1 and CD2AP) reported by the prior LOAD GWAS,3,4,15 as they were not assessed in our prior study7 (table e-2). Eleven SNPs were genotyped using Taqman SNP genotyping assays (Life Technologies), one (rs1476679) was genotyped using a KASP genotyping assay (LGC, Middlesex, UK), and one (rs3818361) was genotyped as part of the Mayo Clinic LOAD GWAS.12 These SNPs were assessed for association with expression levels of cis-genes (±100 kb) with probes that passed our quality control (QC) threshold.
LOAD candidate gene cis-eSNPs.
We extracted genotypes for a total of 1,899 SNPs from available Mayo Clinic GWAS12 and HapMap-imputed13 data that were within ±100 kb of 13 LOAD candidate genes nominated by GWAS,3–5,15 as well as PILRB, which was identified as a candidate LOAD gene in this study. Genotype data were extracted for only those SNPs in-cis with candidate genes that had WG-DASL probes that passed our QC thresholds (table e-3). These genotypes were used to test associations of brain levels of LOAD candidate genes with their cis-SNPs. Additional genotyping details are provided in appendix e-1.
Statistical analysis.
All analyses were run in PLINK16 using multivariable linear regression assuming an additive model, with the SNP minor allele dosage (0, 1, 2) as the independent variable and adjusting for the following covariates: age at death, sex, number of APOE ε4 alleles (0, 1, 2), RNA integrity number (RIN), adjusted RIN value (RINsample − MeanRIN)2, microarray PCR plate (WG-DASL only), Flowcell (RNAseq only), and diagnosis, when appropriate (AD = 1, non-AD = 0; WG-DASL only). A total of 2,873 tests were conducted, corresponding to a study-wide significant p value of 1.74E-05 after Bonferroni correction. This is a highly stringent correction given that multiple probes for the same gene and many tested SNPs in linkage disequilibrium (LD) are not truly independent tests.
For visualization of the top cis-SNP/expression associations, expression residuals obtained after adjustment of all covariates were plotted: kernel density plots were generated using the sm.density.compare function of the sm package in R, and box plots were generated using the ggplot package within R. LocusZoom17 was used to plot results for all HapMap2-imputed eSNPs in-cis with the top genes implicated in this study (cis-eSNPs).
RegulomeDB.
Regulome scores for all SNPs tested, when available, were obtained from the RegulomeDB (http://regulomedb.org/index), where lower numbers represent stronger levels of data supporting the regulatory annotation for an individual SNP.18
IGAP LOAD risk association results.
Publicly available results from IGAP5 stage I were used in this study; further details are provided in appendix e-1.
Comparison with other brain gene expression data.
We compared the significant cis-eSNP results in this study to published brain expression quantitative trait loci (eQTL) data from healthy controls (HCs)19 and patients with neurodegenerative disease.20 Results for the former are deposited in http://www.braineac.org/ (referred to as the Braineac data set hereforth) and are from 10 brain regions in 134 patients without prominent neuropathology; we compared their CER and TCX cis-eSNP data to ours. Results from the latter come from 3 brain regions (dorsolateral prefrontal cortex [PFC], visual cortex [VC], and CER) of 376 patients with LOAD, 194 patients with Huntington disease (HD), and 173 controls without dementia (referred to as LOAD/HD/HC). Details are provided in appendix e-1.
Differential gene expression.
We performed differential expression analyses for the 6 genes with significant cis-eSNP associations identified in this study (CR1, HLA-DRB1, PILRB, MEF2C, ZCWPW1, and SLC24A4). Expression levels were compared between patients with AD and patients without AD in multivariable linear regression analyses adjusting for age at death, sex, RIN, RIN2adjusted (RIN-RINmean)2, PCR plates as technical variables, and expression levels for 5 transcripts that are specific for 5 cell types in the CNS to account for neuronal loss, gliosis, and/or vascular tissue in the assessed brain regions. The following probes were used as covariates: ENO2 for neurons (ILMN_1765796), GFAP for astrocytes (ILMN_1697176), CD68 for microglia (ILMN_2267914), OLIG2 for oligodendrocytes (ILMN_1727567), and CD34 for endothelial cells (ILMN_1732799).
RESULTS
cis-Expression association analyses of LOAD GWAS index SNPs.
We evaluated 10 index SNPs reported by the IGAP consortium5 in addition to 2 other index SNPs at the CR1 and CD2AP loci. Using our WG-DASL brain expression data, we assessed 47 expression probes representing 34 unique genes for cis association with the 12 LOAD GWAS index SNPs (table e-2). After study-wide Bonferroni correction, 3 SNPs were significantly associated with cis-gene expression levels in TCX (CR1, HLA-DRB1, and PILRB). Of these, HLA-DRB1 and PILRB levels could also be reliably measured in CER and showed significant associations. The TCX associations for CR1 and HLA-DRB1 could be validated in the RNAseq data obtained from the smaller subset of AD samples (table 1).
Table 1.
Significant brain transcript level associations for the index LOAD GWAS SNPs

The CR1 locus LOAD risk allele4,21,22 for rs3818361 is significantly associated with increased CR1 messenger RNA levels in TCX when patients with and without AD are assessed together (table 1, figure 1A, figure e-1) and separately (table e-2); this finding is validated in the TCX RNAseq data (table 1). The CR1 probe did not meet our detection criteria of ≥50% in CER and was not assessed. Fine mapping of the cis-eQTL for CR1 (all cis-SNPs within ±100 kb of CR1) identified rs1408077 as the strongest cis-eSNP (tables e-3 and e-4). LocusZoom17 plots of the region (figure 2A) demonstrate that rs3818361 and rs1408077 are in strong LD. However, neither these nor other strong CR1 cis-eSNPs, which also associate with LOAD risk, have good Regulome scores, indicating that they are unlikely to be strong functional regulatory variants. This suggests the presence of a yet-undefined regulatory variant(s) in this region tagged by the CR1 LOAD index and strong cis-eSNPs (table e-4). As shown in the kernel density (figure 1A) and box plots (figure e-1), CR1 levels are lower in rs3818361 major homozygotes compared to heterozygotes but not minor homozygotes. This may be due to imperfect LD between the actual regulatory variant and this SNP. It is also possible that by chance there were more rs3818361 heterozygotes that also harbored the regulatory variant but not as many for the smaller group of minor homozygotes.
Figure 1. Kernel density plots.

(A) CR1 TCX, (B) HLA-DRB1 TCX and (C) CER, (D) PILRB (ILMN_1723984) TCX and (E) CER gene expression residuals by relevant index SNP. Distribution of brain gene expression level residuals from all patients obtained after adjustment for all covariates is shown. Green line indicates distribution of gene expression residuals for homozygous minor individuals (Min); blue line indicates the same for heterozygotes (Het); red line indicates the same for major homozygotes (Maj). The number of individuals with each genotype is indicated on the plot (#). CER = cerebellum; SNP = single nucleotide polymorphism; TCX = temporal cortex.
Figure 2. LocusZoom plots.
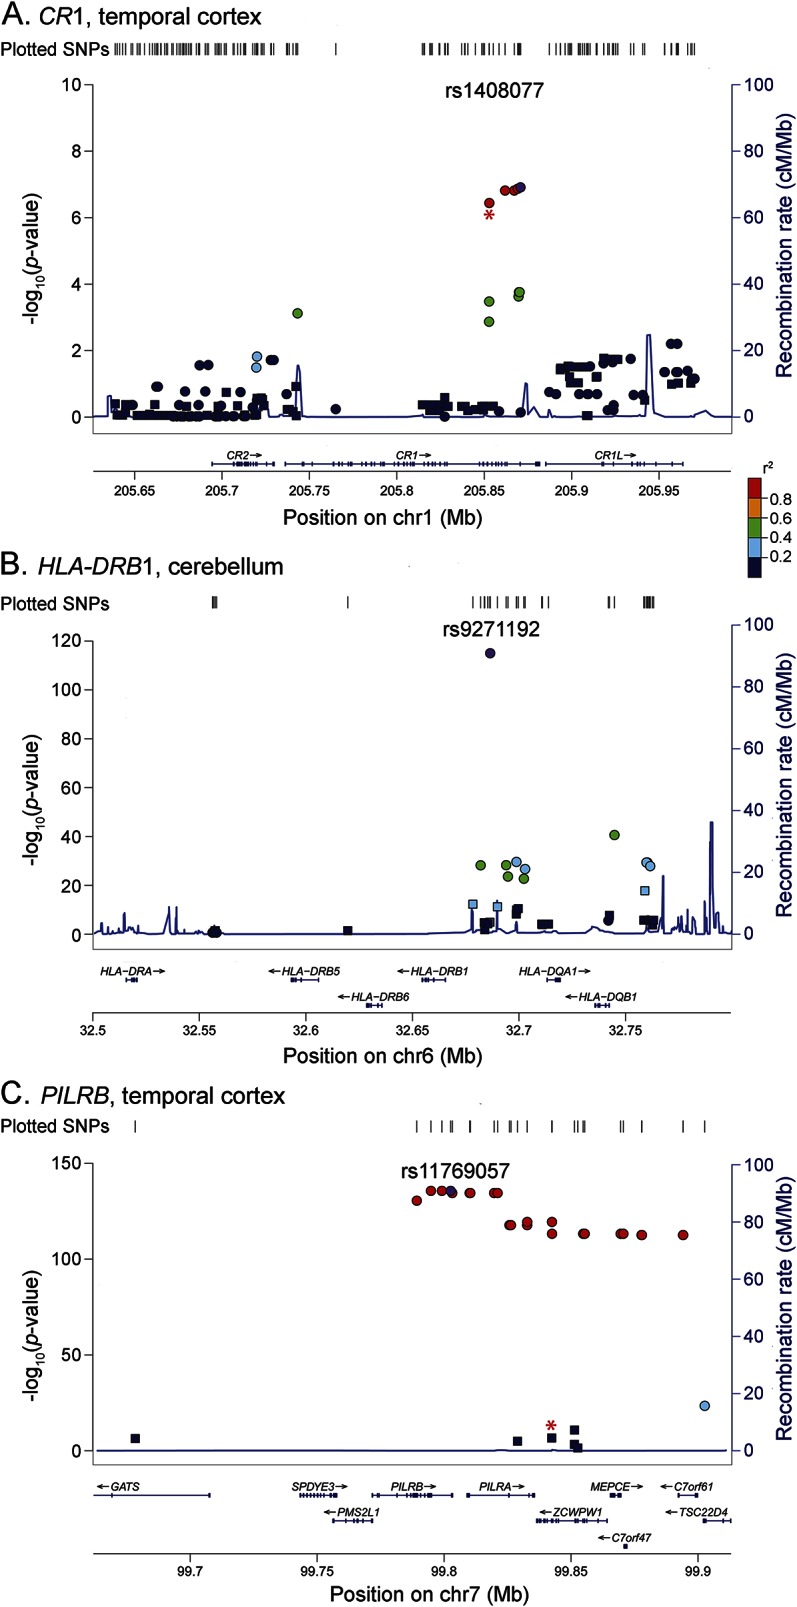
(A) CR1 TCX expression levels cis-SNP associations, (B) HLA-DRB1 CER expression levels cis-SNP associations, and (C) PILRB (ILMN_1723984) TCX expression levels cis-SNP associations. Square points indicate β <0 (i.e., minor allele associated with lower expression levels); circle points indicate β >0 (i.e., minor allele associated with higher expression levels). Relevant index LOAD GWAS SNP is indicated with a red asterisk below point on plot. LD based on HapMap2 build hg18. r2 values plotted relative to the most significant cis-SNP indicated by purple marker. HLA-DRB1 locus index LOAD GWAS SNP rs9271192 is the most significant cis-SNP. Region displayed = candidate gene ±110 kb. CER = cerebellum; GWAS = genome-wide association study; LOAD = late-onset Alzheimer disease; SNP = single nucleotide polymorphism; TCX = temporal cortex.
The LOAD risk allele for the IGAP index SNP rs9271192 is significantly associated with increased levels of HLA-DRB1 in both TCX and CER in all patients with AD and patients without AD (table 1; figure 1, B and C; figure e-2; table e-2). RNAseq TCX results validate the WG-DASL TCX findings with the same direction of effect (table 1). Both kernel density (figure 1, B and C) and box plots (figure e-2) depict the clear dissociation of HLA-DRB1 levels that are lower in major homozygotes compared to minor allele carriers. Fine mapping of the eQTL for HLA-DRB1 reveals rs9271192 to be the strongest cis-eSNP (tables e-3 and e-5, figure 2B), although this SNP has a high (poor) Regulome score. We identify 1 HLA-DRB1 cis-eSNP, rs2516049, with a low Regulome score, significant HLA-DRB1 brain expression association, and nominally significant association with LOAD risk (table e-5).
Finally, the LOAD protective allele of rs1476679 at the ZCWPW1 locus is significantly associated with decreased brain expression levels of the proximal gene PILRB in TCX when patients with and without AD are assessed together (table 1; figure 1, D and E; figure e-3). This SNP reaches nominal significance in all but AD CER but was not validated by RNAseq in the subset of TCX AD samples (table 1). Although rs1476679 is closest to ZCWPW1, it had no association with brain levels of this gene. It is interesting that this index SNP has a Regulome score of 1f,18 suggesting that this variant itself may be functional. Based on the multimodal distribution of PILRB expression (figure 1, D and E), it appears that a subset of major homozygotes and heterozygotes have higher brain PILRB levels. It is possible that the risky major allele of rs1476679 may have a regulatory role in increasing brain PILRB levels but that other genetic and/or nongenetic factors also influence levels of this gene, thus leading to this multimodal distribution. Indeed, fine mapping of this eQTL (tables e-6 to e-9, figure 2C) indicates 2 distinct groups of variants. One group is in strong LD with the index SNP rs1476679, the minor allele of which has significant associations with lower brain PILRB levels and reduced LOAD risk. The other group is in strong LD with the most significant PILRB cis-SNP rs11769057 (table e-3) and has more significant associations with higher PILRB levels but no association with LOAD risk. Both groups have variants with good Regulome scores and may represent 2 distinct haplotypes.
We also identified nominally significant cis associations of the ZCWPW1 locus SNP rs1476679 with reduced PILRA levels; the CELF1 locus SNP rs7933019 (proxy for rs10838725) with brain C1QTNF4, MTCH2, and RAPSN levels; the FERMT2 locus SNP rs17125944 with FERMT2 levels; and the CASS4 locus SNP rs7274581 with C20orf43 and CASS4 levels (table e-2).
LOAD GWAS candidate genes cis-expression analyses.
We fine mapped and annotated the SNPs within ±100 kb of the candidate LOAD GWAS genes that we had not previously assessed7 to identify strong cis-eSNPs with LOAD risk association and functional evidence of regulatory potential. The most significant cis-eSNPs for each gene are summarized in table e-3, with detailed findings depicted in tables e-4 to e-24. MEF2C, ZCWPW1, and SLC24A4 had cis-eSNPs that achieved study-wide significance in at least 1 tissue region. These variants were different than the LOAD GWAS index SNPs (table 2, table e-3).
Table 2.
Significant brain transcript level associations for the candidate genes at the LOAD GWAS loci

Seventeen cis-eSNPs were associated with MEF2C CER but not TCX levels (table e-10). The most significant, rs254776, associates with lower CER levels and has a suggestive association with lower LOAD risk (table 2). This variant is in poor LD with the index LOAD GWAS SNP at this locus, rs190982 (r2 = 0.047; D′ = 0.305) (figure 3A), and has a high Regulome score.
Figure 3. LocusZoom plots.

(A) MEF2C CER expression levels cis-SNP associations, (B) ZCWPW1 TCX expression levels cis-SNP associations, and (C) SLC24A4 cerebellum expression levels cis-SNP associations. See figure 2 legend for description of other features. CER = cerebellum; SNP = single nucleotide polymorphism; TCX = temporal cortex.
SLC24A4 cis-eSNPs achieved study-wide significant association with CER gene levels, many of which also had nominally significant TCX level associations (tables e-11 and e-12). The top SLC24A4 cis-eSNP rs7150592 is significantly associated with increased SLC24A4 CER levels and suggestively associated with higher TCX levels and increased LOAD risk.5 TCX RNAseq validation also reveals suggestive association with higher levels. This variant is not in LD with the LOAD index SNP at this locus, rs10498633 (r2 = 0.001; D′ = 0.053; figure 3C). None of the strong SLC24A4 cis-eSNPs have good Regulome scores.
ZCWPW1 cis-eSNP associations were strongest in TCX, with RNAseq validation and nominally significant CER associations (table e-13). Fine mapping of ZCWPW1 variants revealed many strong cis-eSNPs, of which rs10241492 was the most significant (table 2, table e-13). None of the strong ZCWPW1 cis-eSNPs have any LOAD risk association. The most significant ZCWPW1 cis-eSNP rs10241492 has weak LD with the LOAD index SNP rs1476679, as measured by r2 (r2 = 0.092; D′ = 1.0) (figure 3B). These ZCWPW1 cis-eSNPs associate with higher levels of this gene and belong to the same group of cis-eSNPs that also associate with higher levels of PILRB but not with LOAD risk.
Comparison with other brain gene expression data.
We compared the cis-eSNP associations identified in our study to HC brain gene expression data19 deposited in the Braineac Web site and data obtained in brains from patients with LOAD, patients with HD, and HCs.20 Of the significant cis-eSNP associations highlighted in tables 1 and 2 of our study, all but HLA-DRB1/rs9271192 were present in Braineac (table e-25), whereas only CR1/rs3818361 was present in the LOAD/HD/HC data set (table e-26). There were nominally significant (p < 0.05) associations with cis-eSNPs for CR1, PILRB, and SLCA24A4 and suggestive results (p < 0.2) for MEF2C and ZCWPW1 in Braineac (table e-25). It is important that the direction of association for the minor cis-eSNP allele is consistent with our findings. The CR1/rs3818361 association is highly significant in the VC data from the LOAD/HD/HC data set.
To compare cis-eSNPs for the other genes highlighted in our study with the LOAD/HD/HC data, we evaluated significant cis-eSNPs from this study20 that also existed in our data set (tables e-4 to e-13). We were able to make comparisons for all except SLC24A4 cis-eSNPs, as none existed in the LOAD/HD/HC study. Cis-eSNPs for CR1, HLA-DRB1, ZCWPW1, and PILRB were highly significant in both data sets (table e-26). The common MEF2C cis-eSNP rs770463 had nominal significance in our study and was highly significant in the LOAD/HD/HC study.20
Differential gene expression.
TCX CR1 levels were nominally significantly higher in patients with AD compared to patients without AD (table e-27). While this finding would not remain significant after Bonferroni corrections for the 6 genes evaluated, this trend is consistent with expectations based on the highlighted cis-eSNP results (table 1), i.e., rs3818361 minor allele is associated with both increased AD risk (higher frequency in patients with AD) and greater TCX CR1 levels. TCX SLC24A4 levels are significantly higher in patients with AD, again consistent with the direction of AD risk and SLC24A4 associations of rs7150592. The trends for higher HLA-DRB1 and PILRB in CER are consistent with the directions of associations of their respective cis-eSNPs, but these trends were not observed for TCX. None of the other differential gene expression analyses were significant or suggestive.
DISCUSSION
In this study, we identified strong brain gene expression associations for the index LOAD GWAS variants near CR1, HLA-DRB1, and PILRB. We also detected strong cis-eSNPs for MEF2C and SLC24A4, some of which also associate with LOAD risk, independent of the top LOAD risk SNPs at these loci. Finally, we determined that despite harboring very strong brain cis-eSNPs, ZCWPW1 is unlikely to be the affected LOAD risk gene at this locus, given the lack of any LOAD risk for the strong ZCWPW1 cis-eSNPs. These findings can have immediate mechanistic implications for each of the eQTL identified in this study.
The association of the index CR1 locus SNPs with both higher TCX levels of this gene and LOAD risk suggests that higher levels of complement receptor 1 in the brain may have adverse effects, although in reality the relationship of CR1 expression and LOAD risk is likely to be more complex.23–26 This SNP was also found to associate with PFC CR1 levels in a study of patients with neurodegenerative disease20 and also with higher TCX CR1 levels in a study of HCs,19 both data sets that are independent from this study. In addition to the LOAD GWAS index SNPs, a copy number variation resulting in a long CR1 isoform23 and a CR1 coding variant26 has also been implicated in LOAD risk at this locus. Given these and our results reported here, joint investigation of these coding variants and CR1 regulatory variants is warranted.
Previous eQTL studies also identified associations with expression levels of HLA-DRB1, HLA-DRB5, and other members of the human leukocyte antigen (HLA) family.5,19,27,28 Collectively, our findings and the published results highlight the role of strong regulatory variants in the HLA region for human disease. Given the highly polymorphic nature of this region, the identity of the functional regulatory variants may prove difficult to discern. The high sequence variability in this region may also pose technical problems with respect to artifactual associations of gene expression levels arising from probes that may harbor variants.29,30 Nevertheless, our validation of the findings in TCX using the alternative RNAseq approach and strong eQTL in this region identified by others20 effectively argues against a false-positive expression association secondary to a probe-binding artifact.
Our findings at the ZCWPW1/PILRB locus highlight the potential utility of the combined gene expression and disease risk association approaches in discerning the plausible risk gene at the disease locus. We detected strong cis associations of the protective index SNP rs1476679 with lower brain PILRB levels but not ZCWPW1 levels. PILRB association was also noted in other eQTL studies.5,19,20 Although this association did not validate in our smaller subset of AD TCX with RNAseq, this may be a reflection of the smaller sample size (n = 94) or the tissue and group analyzed. Notably, WG-DASL association was weakest in AD samples. This may also be due to the presence of multiple regulatory variants that influence brain levels of PILRB, where large enough sample sizes are required to discern the effects of each of these variants.
Indeed, further mapping of the ZCWPW1/PILRB locus identified 2 distinct sets of cis-eSNPs: one group that includes the protective LOAD index SNP rs1476679, which associates with lower brain levels of PILRB, and one group that consists of strong cis-eSNPs that associate with increased levels of PILRB but do not associate with LOAD risk. Although these findings require further investigations through mechanistic studies, they may imply that moderate reductions in PILRB may have implications for LOAD risk, whereas there may be a ceiling effect for increased levels of this gene that precludes any functional consequences on disease risk. These future studies need to incorporate investigations of both PILRA and PILRB, whose expression may be coregulated.
The cis-eSNPs that associate with higher brain PILRB levels but not LOAD risk also influence higher brain ZCWPW1 levels. It is possible that this locus harbors an enhancer element with effects on expression levels of nearby genes, including PILRB and ZCWPW1, without any effects on LOAD risk. These findings emphasize the importance of detailed fine mapping of disease loci that may enable dissection of the most plausible disease risk genes and location of the functional variants.
Finally, MEF2C and SLC24A4 were found to have strong cis-eSNPs, some of which also had nominally significant associations with LOAD risk.5 These results may imply the presence of regulatory LOAD risk variants that are distinct from the index SNPs, as we previously identified for CLU and ABCA7.7 For a detailed discussion for each of the genes see appendix e-2.
Consistent findings between our data and 2 other brain eQTL data sets19,20 highlight the authenticity of our results. Although a prior study failed to identify significant brain gene expression associations31 for some of the LOAD risk variants previously identified,3 including CR1 highlighted in our study, this may represent a false-negative in the context of findings reported here and by others. Many of the cis-eSNPs highlighted in our study appear to influence gene expression in patients with AD, patients with other neurologic diseases, and HCs. In addition, many but not all of the significant cis-eSNPs in our current and previous studies7,13 have effects on gene expression in tissue affected and unaffected by disease neuropathology. These findings suggest that many disease-associated common regulatory variants influence gene expression across disease phenotypes and tissue regions; however, they do not rule out disease- and tissue-specific effects for other cis-eSNPs.
Finally, the comparison of gene expression levels between patients with vs without AD in our study revealed significant differential gene expression for CR1 and SLC24A4 and suggestive trends for HLA-DRB1 and PILRB that are consistent with the direction of associations of their respective cis-eSNPs. Lack of significant differential expression for the other transcripts could be due to lack of significant differences in the frequency of functional regulatory variants between AD and non-AD groups in our study, especially given that our non-AD group includes patients with other neurodegenerative diseases; a low signal:noise ratio for differential expression given multiple potential confounders despite our best efforts for correction; or a combination of these factors.
The strengths of our study are the size of the cohort for the brain expression analyses, detailed fine mapping and annotation approaches, built-in replication with 2 different brain regions, 2 distinct study populations, additional validation through the alternative RNASeq approach, and comparison to 2 public eQTL results. Despite these strengths, it is possible that some of the convergent LOAD risk and expression associations are coincidental. Other weaknesses include gene expression measurements in tissue rather than specific cell types, focusing only on SNPs rather than copy number variants, and lack of a true control group without any neurodegenerative pathology. We tried to address these weaknesses by assessing public eQTL data from both HCs19 and patients with neurodegenerative disease20 and by investigating multiple brain regions from our data and others. In summary, the collective evidence from this and other studies7–10,13 implicates gene expression regulation as a key mechanism of function for some LOAD risk variants, which mark brain regulatory loci.
Supplementary Material
ACKNOWLEDGMENT
The authors thank the International Genomics of Alzheimer's Project (IGAP) for providing summary results data for these analyses. The investigators within IGAP contributed to the design and implementation of IGAP and/or provided data but did not participate in analysis or writing of this report. IGAP was made possible by the generous participation of the controls, the patients, and their families. The i-Select chips was funded by the French National Foundation on Alzheimer’s disease and related disorders. EADI was supported by the LABEX (laboratory of excellence program investment for the future) DISTALZ grant, Inserm, Institut Pasteur de Lille, Université de Lille 2, and the Lille University Hospital. GERAD was supported by the Medical Research Council (grant 503480), Alzheimer's Research UK (grant 503176), the Wellcome Trust (grant 082604/2/07/Z), and German Federal Ministry of Education and Research (BMBF): Competence Network Dementia (CND) grants 01GI0102, 01GI0711, and 01GI0420. CHARGE was partly supported by the NIH/NIA grant R01 AG033193 and the NIA AG081220 and AGES contract N01-AG-12100, the NHLBI grant R01 HL105756, the Icelandic Heart Association, and the Erasmus Medical Center and Erasmus University. ADGC was supported by the NIH/NIA grants U01 AG032984, U24 AG021886, and U01 AG016976 and the Alzheimer's Association grant ADGC-10-196728.
GLOSSARY
- AD
Alzheimer disease
- CER
cerebellum
- eQTL
expression quantitative trait loci
- eSNP
expression single nucleotide polymorphism
- GWAS
genome-wide association study
- HC
healthy control
- HD
Huntington disease
- HLA
human leukocyte antigen
- IGAP
International Genomics of Alzheimer's Project
- LD
linkage disequilibrium
- LOAD
late-onset Alzheimer disease
- PFC
prefrontal cortex
- QC
quality control
- RIN
RNA integrity number
- RNAseq
RNA sequencing
- SNP
single nucleotide polymorphism
- TCX
temporal cortex
- VC
visual cortex
- WG-DASL
whole-genome cDNA-mediated annealing, selection, extension, and ligation assay
Footnotes
Supplemental data at Neurology.org/ng
AUTHOR CONTRIBUTIONS
M.A. and N.E.-T.: drafting/revising the manuscript for content; study concept; data acquisition; and analysis or interpretation of data. M.K., M.M.C., A.K., L. Manly, J.D.B., C.W., D.S., X.W., J.S., F.Z., H.S.C., C.Y., J.C., C.M., T.N., L. Ma, K.M., and S.L.: data acquisition; analysis or interpretation of data. R.C.P., N.R.G.-R., Y.W.A., D.W.D., and S.G.Y.: drafting/revising the manuscript for content.
STUDY FUNDING
Support for this research was provided by the following grants: National Institute on Aging (R01 AG032990 to N.E.-T. and R01 AG018023 to N.R.G.-R. and S.G.Y.); National Institute of Neurological Diseases and Stroke (R01 NS080820 to N.E.-T.), Mayo Alzheimer's Disease Research Center: (P50 AG0016574 to R.C.P., D.W.D., N.R.G.-R., S.G.Y., and N.E.-T.); Mayo Alzheimer's Disease Patient Registry (U01 AG006576 to R.C.P.); and National Institute on Aging (AG025711, AG017216, and AG003949 to D.W.D.). The study is not industry sponsored.
DISCLOSURE
Dr. Allen has received travel funding from the Alzheimer's Association International Conference and has received research support from NIH and Mayo ADRC. Ms. Kachadoorian reports no disclosures. Dr. Carrasquillo has received research support from the Robert and Clarice Smith Postdoctoral Fellowship, the Alzheimer's Disease Research Center at the Mayo Clinic, the Marriott Specialized Workforce Development Awards in Individualized Medicine at the Mayo Clinic, the GHR Foundation, Award for Alzheimer's Disease Research, and the Alzheimer's Association-Mentored New Investigator Research Grant to Promote Diversity (MNIRGD). Ms. Karhade, Mr. Manly, Mr. Burgess, Dr. C. Wang, Mr. Serie, Dr. X. Wang, Dr. Siuda, Dr. Zou, and Dr. Chai report no disclosures. Mr. Younkin has been employed by Mayo Clinic Florida. Dr. Crook and Dr. Medway report no disclosures. Ms. Nguyen has been employed by Mayo Clinic Florida. Ms. Ma reports no disclosures. Ms. Malphrus has been employed by Mayo Clinic Florida. Ms. Lincoln holds patents regarding identification of mutations in PARK8, a locus for familial Parkinson's Disease; Non-Exclusive 2007-016 Transgenic Mouse Expressing P1 Artificial Chromosome (PAC) Containing the Entire Human Alpha-Synuclein (SNCA) Gene; Non-Exclusive 2007-027 LRRK2 BAC Transgenic Mice: A Model of Parkinsonism; LRRK2 Knock Out Mice; Nonlicensed 2007-330 iLRRK2 Wild-Type and Mutant (G2019S) Transgenic Mice; and Active Research Tool/Method Nonlicensed; and has received research support from Lundbeck. Dr. Petersen has been a consultant to Genentech, Inc., Merck, Inc., and Roche, Inc.; has served on a data safety monitoring committee for Pfizer and Janssen Alzheimer Immunotherapy; has received royalties from Oxford University Press; has received research support from the National Institute on Aging; and has served on the National Advisory Council on Aging for the National Institute on Aging. Dr. Graff-Radford has multicenter treatment study grants from Lilly and TauRx; has consulted for Cytox; has served on advisory boards for Codman and Baxter; has served on the editorial board for Alzheimer Disease and Therapy; has received royalties from UpToDate; and has received research support from TauRx, Lilly, and NIA. Dr. Asmann reports no disclosures. Dr. Dickson has served on the editorial boards of Acta Neuropathologica, Brain, Brain Pathology, Neurobiology of Aging, Annals of Neurology, Neuropathology, International Journal of Clinical and Experimental Pathology, and American Journal of Neurodegenerative Disease; has received research support from the following government entities: P50 NS072187, P50 AG016574, P01 AG003949, R01 AG037491, R01 NS077402, R01 AG040042, R01 NS080820, U01 AG046139, R21 NS084528, and R01 NS089544; and has received research support from the Society for PSP: Foundation for PSP|CBD and Related Disorders Mangurian Foundation. Dr. Younkin has received travel funding and an honorarium from Eisai Pharmaceuticals, has received research support from the NIH, and has received royalties from the Mayo Clinic. Dr. Ertekin-Taner has served on the editorial board of the American Journal of Neurodegenerative Disease; holds a patent (pending) regarding Human Monoclonal Antibodies Against Amyloid Beta Protein, and Their Use as Therapeutic Agents Application; and has received research support from the NIH, CurePSP, Bright Focus, Florida Health Ed, and Ethel Moore Alzheimer's Disease Research Program. Go to Neurology.org/ng for full disclosure forms.
REFERENCES
- 1.Harold D, Abraham R, Hollingworth P, et al. Genome-wide association study identifies variants at CLU and PICALM associated with Alzheimer's disease. Nat Genet 2009;41:1088–1093. [DOI] [PMC free article] [PubMed] [Google Scholar]
- 2.Seshadri S, Fitzpatrick AL, Ikram MA, et al. Genome-wide analysis of genetic loci associated with Alzheimer disease. JAMA 2010;303:1832–1840. [DOI] [PMC free article] [PubMed] [Google Scholar]
- 3.Naj AC, Jun G, Beecham GW, et al. Common variants at MS4A4/MS4A6E, CD2AP, CD33 and EPHA1 are associated with late-onset Alzheimer's disease. Nat Genet 2011;43:436–441. [DOI] [PMC free article] [PubMed] [Google Scholar]
- 4.Hollingworth P, Harold D, Sims R, et al. Common variants at ABCA7, MS4A6A/MS4A4E, EPHA1, CD33 and CD2AP are associated with Alzheimer's disease. Nat Genet 2011;43:429–435. [DOI] [PMC free article] [PubMed] [Google Scholar]
- 5.Lambert JC, Ibrahim-Verbaas CA, Harold D, et al. Meta-analysis of 74,046 individuals identifies 11 new susceptibility loci for Alzheimer's disease. Nat Genet 2013;45:1452–1458. [DOI] [PMC free article] [PubMed] [Google Scholar]
- 6.Ertekin-Taner N, De Jager PL, Yu L, Bennett DA. Alternative approaches in gene discovery and characterization in Alzheimer's disease. Curr Genet Med Rep 2013;1:39–51. [DOI] [PMC free article] [PubMed] [Google Scholar]
- 7.Allen M, Zou F, Chai HS, et al. Novel late-onset Alzheimer disease loci variants associate with brain gene expression. Neurology 2012;79:221–228. [DOI] [PMC free article] [PubMed] [Google Scholar]
- 8.Ling IF, Bhongsatiern J, Simpson JF, Fardo DW, Estus S. Genetics of clusterin isoform expression and Alzheimer's disease risk. PLoS One 2012;7:e33923. [DOI] [PMC free article] [PubMed] [Google Scholar]
- 9.Vasquez JB, Fardo DW, Estus S. ABCA7 expression is associated with Alzheimer's disease polymorphism and disease status. Neurosci Lett 2013;556:58–62. [DOI] [PMC free article] [PubMed] [Google Scholar]
- 10.Chapuis J, Hansmannel F, Gistelinck M, et al. Increased expression of BIN1 mediates Alzheimer genetic risk by modulating tau pathology. Mol Psychiatry 2013;18:1225–1234. [DOI] [PMC free article] [PubMed] [Google Scholar]
- 11.McKhann G, Drachman D, Folstein M, Katzman R, Price D, Stadlan EM. Clinical diagnosis of Alzheimer's disease: report of the NINCDS-ADRDA Work Group under the auspices of Department of Health and Human Services Task Force on Alzheimer's Disease. Neurology 1984;34:939–944. [DOI] [PubMed] [Google Scholar]
- 12.Carrasquillo MM, Zou F, Pankratz VS, et al. Genetic variation in PCDH11X is associated with susceptibility to late-onset Alzheimer's disease. Nat Genet 2009;41:192–198. [DOI] [PMC free article] [PubMed] [Google Scholar]
- 13.Zou F, Chai HS, Younkin CS, et al. Brain expression genome-wide association study (eGWAS) identifies human disease-associated variants. PLoS Genet 2012;8:e1002707. [DOI] [PMC free article] [PubMed] [Google Scholar]
- 14.Braak H, Braak E. Neuropathological stageing of Alzheimer-related changes. Acta Neuropathol 1991;82:239–259. [DOI] [PubMed] [Google Scholar]
- 15.Lambert JC, Heath S, Even G, et al. Genome-wide association study identifies variants at CLU and CR1 associated with Alzheimer's disease. Nat Genet 2009;41:1094–1099. [DOI] [PubMed] [Google Scholar]
- 16.Purcell S, Neale B, Todd-Brown K, et al. PLINK: a tool set for whole-genome association and population-based linkage analyses. Am J Hum Genet 2007;81:559–575. [DOI] [PMC free article] [PubMed] [Google Scholar]
- 17.Pruim RJ, Welch RP, Sanna S, et al. LocusZoom: regional visualization of genome-wide association scan results. Bioinformatics 2010;26:2336–2337. [DOI] [PMC free article] [PubMed] [Google Scholar]
- 18.Boyle AP, Hong EL, Hariharan M, et al. Annotation of functional variation in personal genomes using RegulomeDB. Genome Res 2012;22:1790–1797. [DOI] [PMC free article] [PubMed] [Google Scholar]
- 19.Ramasamy A, Trabzuni D, Guelfi S, et al. Genetic variability in the regulation of gene expression in ten regions of the human brain. Nat Neurosci 2014;17:1418–1428. [DOI] [PMC free article] [PubMed] [Google Scholar]
- 20.Zhang B, Gaiteri C, Bodea LG, et al. Integrated systems approach identifies genetic nodes and networks in late-onset Alzheimer's disease. Cell 2013;153:707–720. [DOI] [PMC free article] [PubMed] [Google Scholar]
- 21.Carrasquillo MM, Belbin O, Hunter TA, et al. Replication of CLU, CR1, and PICALM associations with Alzheimer disease. Arch Neurol 2010;67:961–964. [DOI] [PMC free article] [PubMed] [Google Scholar]
- 22.Jun G, Naj AC, Beecham GW, et al. Meta-analysis confirms CR1, CLU, and PICALM as Alzheimer disease risk loci and reveals interactions with APOE genotypes. Arch Neurol 2010;67:1473–1484. [DOI] [PMC free article] [PubMed] [Google Scholar]
- 23.Brouwers N, Van Cauwenberghe C, Engelborghs S, et al. Alzheimer risk associated with a copy number variation in the complement receptor 1 increasing C3b/C4b binding sites. Mol Psychiatry 2012;17:223–233. [DOI] [PMC free article] [PubMed] [Google Scholar]
- 24.Crehan H, Hardy J, Pocock J. Blockage of CR1 prevents activation of rodent microglia. Neurobiol Dis 2013;54:139–149. [DOI] [PubMed] [Google Scholar]
- 25.Crehan H, Holton P, Wray S, Pocock J, Guerreiro R, Hardy J. Complement receptor 1 (CR1) and Alzheimer's disease. Immunobiology 2012;217:244–250. [DOI] [PubMed] [Google Scholar]
- 26.Keenan BT, Shulman JM, Chibnik LB, et al. A coding variant in CR1 interacts with APOE-epsilon4 to influence cognitive decline. Hum Mol Genet 2012;21:2377–2388. [DOI] [PMC free article] [PubMed] [Google Scholar]
- 27.Apperson ML, Tian Y, Stamova B, et al. Genome wide differences of gene expression associated with HLA-DRB1 genotype in multiple sclerosis: a pilot study. J Neuroimmunol 2013;257:90–96. [DOI] [PubMed] [Google Scholar]
- 28.Wissemann WT, Hill-Burns EM, Zabetian CP, et al. Association of Parkinson disease with structural and regulatory variants in the HLA region. Am J Hum Genet 2013;93:984–993. [DOI] [PMC free article] [PubMed] [Google Scholar]
- 29.Stranger BE, Forrest MS, Clark AG, et al. Genome-wide associations of gene expression variation in humans. PLoS Genet 2005;1:e78. [DOI] [PMC free article] [PubMed] [Google Scholar]
- 30.Doss S, Schadt EE, Drake TA, Lusis AJ. Cis-acting expression quantitative trait loci in mice. Genome Res 2005;15:681–691. [DOI] [PMC free article] [PubMed] [Google Scholar]
- 31.Holton P, Ryten M, Nalls M, et al. Initial assessment of the pathogenic mechanisms of the recently identified Alzheimer risk loci. Ann Hum Genet 2013;77:85–105. [DOI] [PMC free article] [PubMed] [Google Scholar]
Associated Data
This section collects any data citations, data availability statements, or supplementary materials included in this article.