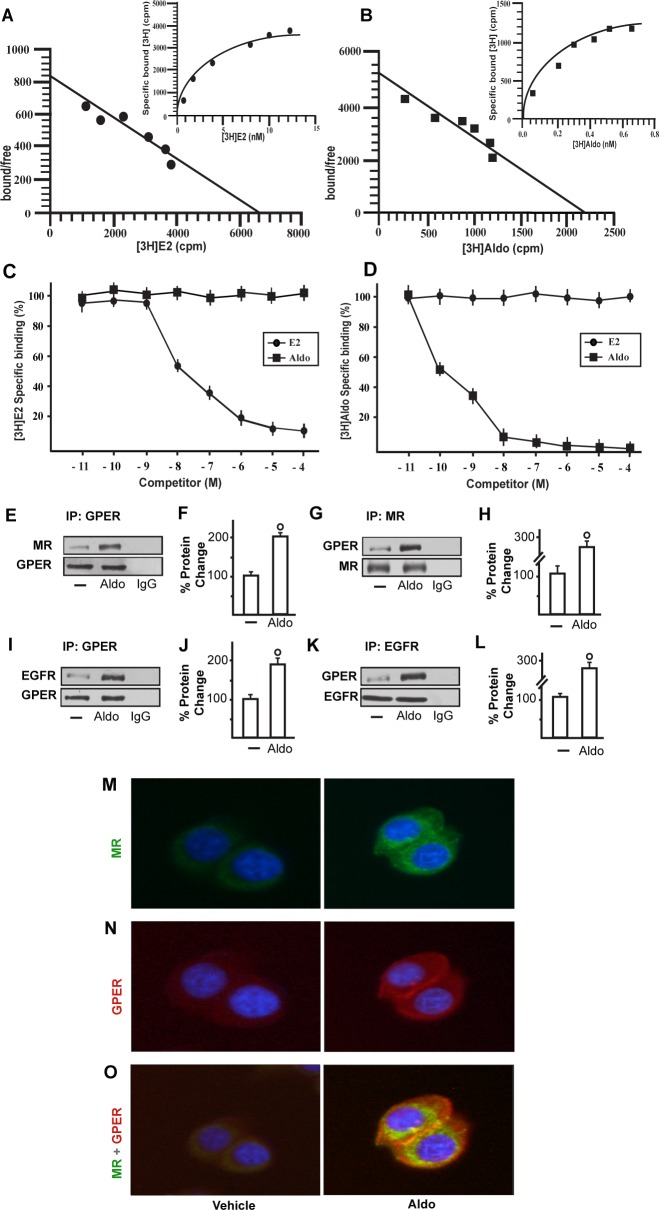
Figure 2. Representative saturation curve and Scatchard plot of [3H]17β-estradiol (E2) binding.
A. and [3H]Aldosterone (Aldo) binding B. in SkBr3 cells. Each value represents the mean ± SEM of three determinations. Ligand binding assay in SkBr3 cells incubated with [3H]E2 and exposed to increasing concentrations of E2 and Aldo for 2 hours C.. Ligand binding assay in SkBr3 cells incubated with [3H]Aldo and exposed to increasing concentrations of E2 and Aldo for 2 hours D.. Competition curves are expressed as a percentage of maximum specific [3H]E2 or [3H]Aldo binding. Each data point represents the mean ± SEM of three independent experiments performed in triplicate. The co-immunoprecipitation of MR with GPER increases upon treatment with 10 pM Aldo for 15 min in SkBr3 cells E.-H. The blots were normalized to GPER or MR, respectively. The interaction between GPER and EGFR increases upon treatment with 10 pM Aldo for 15 min in SkBr3 cells I.-L. The blots were normalized to GPER or EGFR, respectively. In control samples, nonspecific IgG was used instead of the primary antibody, as indicated. Each data point represents the mean ± SD of three independent experiments. (○) indicates p < 0.05 for cells receiving vehicle (−) versus Aldo treatment. Localization of MR M. and GPER N. alone or in combination O., as evaluated by immunofluorescence in SkBr3 cells treated with 10 pM Aldo for 15 min. Green signal: MR; Red signal: GPER; Blue signal: Nuclei. Images shown are representative of ten random fields from three independent experiments.

