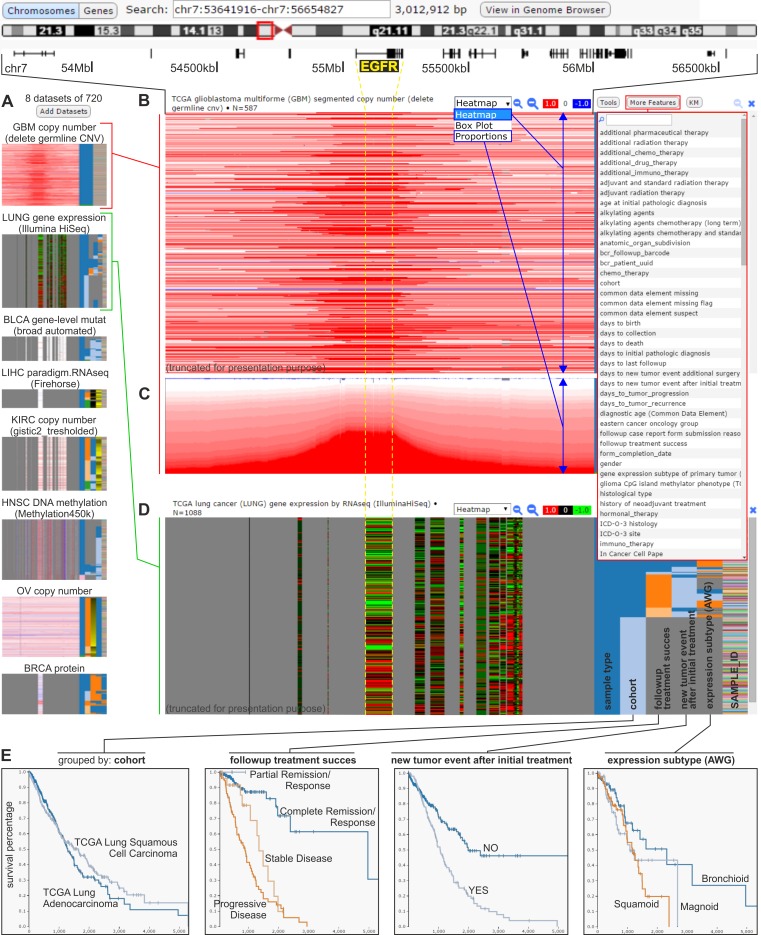
Figure 2. The UCSC Cancer Genomics Browser.
An example of analysis focused on the EGFR genomic region that is conducted concurrently on various oncogenomic data across different cancer types and subtypes. A. Small-scale images (icons) of selected datasets that are simultaneously visualized in the browser. Datasets represented by icons are displayed in a column, similar to the datasets from panels B-D. B. A heatmap panel that presents the results of the TCGA genome-wide copy number analysis of glioblastoma multiforme (GBM) samples. A screenshot of the GBM dataset was used for presentation, based on the presence of considerable amplification of the genomic region that spans the representative EGFR. Each horizontal line (track) represents a specific sample. The red or blue colors indicate, respectively, a gain or loss in the copy number. On the right side of panel B, there is a drop-down list with epidemiological, clinical, and molecular attributes that can be used to sort the presented data (as shown in panel D). C. The TCGA copy number data identified in patients with GBM visualized as a proportions plot. D. A heatmap panel showing the results of TCGA analysis of gene expression in lung cancer samples in the genes that are indicated above (e.g., EGFR). Red and green colors indicate, respectively, upregulation and downregulation of the relative gene expression. The samples are sorted by epidemiological, clinical, and molecular attributes (selected from a drop-down list of attributes), as in panels B and C, shown on the right side of the expression panel. The copy number and expression data presented in panels B-D correspond to the same genomic region indicated above panel B. E. Kaplan-Meier plots generated using the attributes of lung cancer samples (shown in the right side of panel D).

