

Abstract
As the major input to the basal ganglia, the striatum is innervated by a wide range of other areas. Overlapping input from these regions is speculated to influence temporal correlations among striatal ensembles. However, the network dynamics among behaviorally related neural populations in the striatum has not been extensively studied. We used large-scale neural recordings to monitor activity from striatal ensembles in mice undergoing Pavlovian reward conditioning. A subpopulation of putative medium spiny projection neurons (MSNs) was found to discriminate between cues that predicted the delivery of a reward and cues that predicted no specific outcome. These cells were preferentially located in lateral subregions of the striatum. Discriminating MSNs were more spontaneously active and more correlated than their nondiscriminating counterparts. Furthermore, discriminating fast spiking interneurons (FSIs) represented a highly prevalent group in the recordings, which formed a strongly correlated network with discriminating MSNs. Spike time cross-correlation analysis showed the existence of synchronized activity among FSIs and feedforward inhibitory modulation of MSN spiking by FSIs. These findings suggest that populations of functionally specialized (cue-discriminating) striatal neurons have distinct network dynamics that sets them apart from nondiscriminating cells, potentially to facilitate accurate behavioral responding during associative reward learning.
Keywords: associative learning, correlations, single-unit recordings, striatum
animals must rapidly learn to discriminate environmental cues associated with beneficial outcomes from irrelevant cues. In the vertebrate nervous system, the basal ganglia are a set of interconnected nuclei whose activity has been extensively linked to reward-guided learning and action selection (Graybiel 2000; Kravitz et al. 2012). Within these circuits, the striatum serves as the primary input structure to the basal ganglia as well as an important site of synaptic plasticity (Gerfen and Surmeier 2011; Kreitzer and Malenka 2008). Previous efforts to understand the role of striatal electrophysiological activity in guiding behavior revealed that this region is strongly modulated by primary rewards, stimuli that predict rewards, and action (Nicola et al. 2004; Roitman et al. 2005; Setlow et al. 2003; Tremblay et al. 1998). Furthermore, a number of studies have reported changes in striatal activity that accompany learning (Costa et al. 2004; Jog et al. 1999; Koralek et al. 2013; Tang et al. 2009; Thorn et al. 2010; Tremblay et al. 1998; Xiong et al. 2015; Yin et al. 2009). These effects are consistent with a neural circuit that can become tuned to select specific behavioral responses in anticipation of an appetitive outcome. Yet despite a substantial amount of work on neural dynamics in this area, relatively little is known about how striatal neurons are functionally organized at the network level.
In contrast to the organization of cortical microcircuits that contain strong local excitation (Ko et al. 2011), the striatum is a largely inhibitory structure consisting of GABAergic medium spiny projection neurons (MSNs) coupled with a small population of interneurons (Kreitzer and Berke 2011; Tepper et al. 2004, 2008). At millisecond timescales, striatal activity is likely to be strongly influenced by shared glutamatergic signaling from cortical, thalamic, and limbic inputs (Cowan and Wilson 1994; Kasanetz et al. 2006; Kincaid et al. 1998; Plenz and Kitai 1998; Reig and Silberberg 2014; Stern et al. 1998). It is believed that the striatum integrates these convergent streams of information, with the resulting activity acting on basal ganglia output nuclei connected to association and motor control areas in the cortex (Alexander et al. 1986). Computational and experimental studies suggest that the converging input to the striatum leads to the formation of functionally specialized subsets of MSNs with temporally correlated activity patterns (Adler et al. 2012; Carrillo-Reid et al. 2008; Humphries et al. 2009; Ponzi and Wickens 2010; Yim et al. 2011). These findings in the striatum, and a large body of work focusing on cortical circuits (Averbeck et al. 2006; Bair et al. 2001; Cohen and Maunsell 2009; Mitchell et al. 2009; Shadlen and Newsome 1998; Zohary et al. 1994), implicate correlated activity in neural computation and behavior. This evidence raises the possibility that temporal correlations preferentially occur among task-related groups of neurons in the striatum.
To study this relationship, we used multielectrode probe recordings to simultaneously monitor activity from over 100 units in head-fixed mice undergoing Pavlovian reward conditioning. The large scale of these measurements enabled systematic analysis of correlations among behaviorally and electrophysiologically identified groups of cells. The results of this study reveal a potential organizational principle for the dynamics of striatal neurons that encode similar features during the behavioral task.
MATERIALS AND METHODS
Animals and surgical procedures.
All procedures were approved by the University of California, Los Angeles Chancellor's Animal Research Committee. Singly housed male C57Bl/6J mice (n = 9, 12–16 wk old; The Jackson Laboratory) were used in the experiments. Animals underwent an initial surgery under isoflurane anesthesia in a stereotaxic apparatus to bilaterally fix stainless steel head restraint bars (10 × 7.5 mm, 0.6 g) on the skull. Animals were anesthetized with isoflurane for a second surgery on the recording session day to make a craniotomy for acute microprobe insertion. Rectangular craniotomies (0.5 mm AP × 2 mm ML) were centered on the following striatal coordinates relative to bregma: AP, 1.25–1.3 mm and ML, 0.95 mm. An additional craniotomy was made over the posterior cerebellum for placement of an electrical reference wire.
Behavioral task.
After recovery from the first surgery, animals were food restricted and fed daily after each training session to maintain ∼90% of their baseline weight. They received water ad libitum. During daily training sessions, animals were mounted on the head bar bracket on the recording rig and stood on a polystyrene spherical treadmill (200-mm diameter; Graham Sweet Studios) that rotated along a single axis during forward/backward ambulation. The treadmill velocity was monitored with an optical mouse. Delivery of the reward solution (5 μl, 10% sweetened condensed milk) was from a tube positioned between an infrared lick meter (Island Motion) and was controlled by an audible solenoid valve actuation (Neptune Research). We studied the behavioral and electrophysiological profiles of previously inexperienced mice trained with odors for the first time. Before conditioning, animals were habituated to head fixation by receiving rewards alone [maximum 100 rewards per daily session, 13–21 s intertrial interval (ITI)] and exposed to a constant flow of odorless air (1.5 l/min) through a tube. After animals successfully consumed 90% of delivered rewards for 2 consecutive days, they underwent surgery for recording and began conditioning with olfactory cues using an olfactometer. Odorants were introduced by bubbling air (0.15 l/min) through aromatic liquids diluted 1:10 in mineral oil (Sigma-Aldrich) and mixing this product with the 1.5 l/min stream of air. The task involved two stimulus conditions consisting of either a 1-s olfactory cue (CS+) followed by a temporal delay of 1.5 s and subsequent delivery of a reward solution or a different 1-s olfactory cue (CS−) that was not followed by reward (Fig. 1A). Odors were presented in pseudorandom order (1-s duration, 17–29 s ITI). The CS+ consisted of amyl acetate and the CS− consisted of citral. Correct CS+ hit trials were defined as those containing anticipatory licking activity detected between t = 0 and 2.5 s from the cue onset, i.e., before reward delivery. Correct CS− withholding trials were defined as the absence of any licking activity between t = 0 and 5 s from the cue onset. Mice underwent recording on the first day of odor conditioning. During the recording animals received 100 CS+ trials paired with reward delivered at 2.5 s after cue onset and 100 CS− trials with no reward.
Fig. 1.
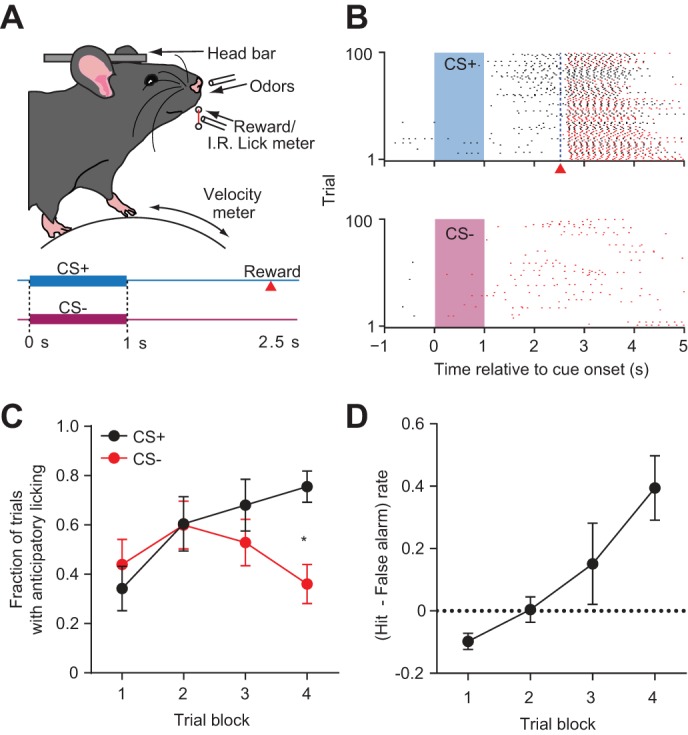
Head restrained mice demonstrate single-session discrimination learning. A: experimental setup and trial schematic. Head-fixed mice were placed on a spherical treadmill and were presented with olfactory cues and liquid rewards. Breaks in the infrared beam positioned in front of the lick tube were used to detect licking activity and treadmill velocity was monitored using an optical mouse (not shown). Trials consisted of either 1 s of odor (CS+) followed by a 1.5-s pause and a reward or a different 1-s odor (CS−) followed by no outcome. B: licking activity rasters during CS+ and CS− trials for 1 representative animal. Shaded rectangles represent the olfactory cue presentation period. Black and red tick marks indicate individual licks during trials with correct and incorrect responses, respectively. Red triangle indicates the time of reward delivery. C: learning curves for all animals (n = 9) showing the mean probability of licking after CS+ (black) and CS− (red) trials in blocks of 25 trials. A two-way ANOVA, repeated measures revealed a significant effect of trial block (P = 0.003) and a significant interaction between trial types (P = 0.0016, *P < 0.05, Sidak's test for multiple comparisons). D: evolution of the mean discriminatory behavior rate in blocks of 25 trials (P = 0.0021, one-way, repeated-measures ANOVA). Error bars represent SE.
Electrophysiological recordings.
Silicon microprobes (Shobe et al. 2015) were fabricated in a silicon microelectromechanical systems foundry (Innovative Micro Technology). Each silicon microprobe contained a total of 256 electrodes (10 × 10 μm electrode dimensions, ∼30-μm electrode spacing) distributed on multiple silicon prongs. Recordings were performed using one of two device designs. The prongs of each device type were arranged to provide high-density electrophysiological measurements across a large area of the striatum. Type I probes had 4 prongs positioned at fixed depths, with 64 electrodes per prong distributed along 1 mm at the tapered tip of each shaft. Type II probes had 5 prongs distributed at different depths, with 50 or 52 electrodes per prong. Recording and spike sorting procedures are described in Shobe et al. (2015).
Striatal unit classification.
All analysis was carried out with custom Matlab scripts. We used spike waveform trough-to-peak (ttr-pk) duration and coefficient of variation (CV) of baseline firing rate to classify units into putative MSNs, fast spiking interneurons (FSIs), and tonically active interneurons (TANs) (Aosaki et al. 1994; Bennett and Wilson 1999; Gage et al. 2010; Mallet et al. 2005). FSIs were separated from non-FSIs by their narrow waveform (maximum FSI ttr-pk = 0.475 ms, minimum non-FSI ttr-pk = 0.55 ms, and maximum non-FSI ttr-pk = 1.25 ms). TANs were separated from other non-FSI units by the regularity of their baseline firing (maximum TAN CV = 1.5), leaving units that exceeded this CV as putative MSNs. Around 9% of all units were not classified in any of these three categories and were excluded from further analysis.
Histology.
After the recordings, animals were overdosed with sodium pentobarbital and perfused with 10% formalin solution. Brains were extracted and fixed overnight at 4°C. To confirm the correct targeting of the microprobe, tissue was stained for tyrosine hydroxylase (TH) using sheep anti-TH primary (1:500; Millipore) and TRITC-conjugated donkey anti-sheep secondary antibodies (1;100; Jackson ImmunoResearch). Microprobe tracks were determined by locations of DiD fluorescence in images of TH-stained sections. We confirmed that recordings were located at approximately the same coronal section of the striatum (range of AP positions relative to bregma: 1.1 to 1.4 mm). We could subsequently determine the approximate mediolateral and dorsoventral silicon prong positions and thus cell position.
Discriminating cell identification.
Cue-triggered firing rate, R(t), was calculated from the average firing rate of CS+ trials with anticipatory responding (correct hits) and CS− trials without licking (correct withholding). The time bin size was 50 ms. The baseline period was defined as the 5-s interval preceding cue presentation, and the average firing in this period was used to calculate the baseline-subtracted change in firing, ΔR(t). The mean baseline subtracted and normalized firing rate was obtained with the expression ΔR(t)/ΔRmax. Discriminating units were determined by comparing the distributions of firing rate during correct CS+ hit, RCS+(t), and correct CS− withholding, RCS−(t), trials using a permutation test on individual time bins (10,000 iterations). For each time bin, we shuffled the labels of firing activity for each trial to create two distributions of firing rates, RCS+,shuffled(t) and RCS−,shuffled(t) shuffled, that could be expected by chance for each trial type. We defined a unit as being discriminating if the absolute value of the difference between RCS+(t) and RCS−(t) for at least two consecutive time bins was higher than the 99th percentile of the distribution of differences between RCS+,shuffled(t) and RCS−,shuffled(t).
Behavior correlations.
Pearson correlations between spiking activity of individual units and lick rate or treadmill velocity were calculated over the entire recording, in time bins of 50 ms.
Signal and resting state correlations.
For signal correlations, we calculated the Pearson correlation coefficient on the RCS+(t) signal of simultaneously recorded units, using 50 ms time bins from t = 0 to 2.5 s after cue onset on correct CS+ hit trials. We defined resting periods as intervals of at least 2 s during which animals did not make any detected movements (running, licking) and were not presented with any external stimuli (cues and reward). To find the resting state spike count correlations, we serially concatenated spiking activity occurring within these epochs to create a continuous time series vector (500 s, 10-ms bins) representing the resting state firing rate, Rrest(t). We calculated resting state activity for each individual unit and then obtained the Pearson correlation coefficient using these vectors. To detect significant correlations, we used the permutation test for correlations on each unit pair containing spiking activity in the resting state. This test involved shuffling Rrest(t) for one unit in the pair and recalculating the correlation coefficient (1,000 iterations). This resulted in a distribution of possible correlation coefficients that could be expected by chance. We determined significance if the absolute value of the observed correlation exceeded the 99% confidence interval of the absolute value of shuffled values. The correlation probability is the fraction of significant pairs detected out of all possible simultaneously recorded pairs separated by 0.025 to 1 mm. We excluded pairs of units closer than 0.025 mm from all temporal correlation analysis to minimize any effect of possible spike sorting errors.
Spike time cross correlations.
We calculated the spike time cross correlogram between pairs of units using 1-ms time bins and a lag of ±25 ms. We used spike trains from the entire recording session for this analysis. To identify significant cross correlations we recalculated the cross correlogram after adding a random 0- to 5-ms jitter to the spike train (500 iterations) and determining the confidence interval from this distribution (Fujisawa et al. 2008).
Statistical tests.
We performed nonparametric permutation tests to determine the significance of linear correlation analysis (Shobe et al. 2015). We used 1,000 to 10,000 shuffles per test. Paired t-test analysis was performed using standard Matlab functions. ANOVAs were performed using GraphPad Prism software.
RESULTS
Mice learn a stimulus discrimination task.
To combine large-scale neural recordings with a behavioral assay of stimulus discrimination, we implemented a Pavlovian reward-based odor discrimination task in head-restrained mice (Shobe et al. 2015). Animals typically learned the association between odor presentation and reward delivery within one recording session (Figs. 1B). To examine how responding to the 2 trial types changed over time, we divided the training session into blocks of 25 trials (Fig. 1C). On average, hit rate increased relative to false alarm rate during training. A two-way repeated-measures ANOVA revealed a significant interaction between time and trial type (P = 0.002, F3,48 = 5.94). Moreover, mice were more likely to respond to CS+ trials than CS− trials in the last block (P < 0.05, Sidak's test for multiple comparisons). The difference between hit rate and false alarm rate was used to quantify discriminatory performance on the task. This measure steadily increased across blocked trials (P = 0.005, F3,24 = 8.4, one-way, repeated-measures ANOVA; Fig. 1D). Together, these results indicate that on average mice were able to develop selective anticipatory responding to CS+ and withholding of licking to CS− in a single training session.
Large-scale recordings reveal a population of discriminating MSNs.
To examine the dynamics of large populations of striatal neurons during the stimulus discrimination task, we employed silicon microprobes with 256 recording sites. We used two customized designs that allowed recordings from either dorsal or ventral (nucleus accumbens) striatal subregions or simultaneously from both. In all cases the recording sites spanned a large extent of the striatum along the mediolateral axis (Fig. 2, A and B). Recordings captured spiking activity distributed across the microprobe (Fig. 2C), with each session yielding an average of 115 (range: 51–188) simultaneously measured units. The spike waveforms had a median signal-to-noise ratio of 9 (Fig. 2D). We used spike waveform width and the CV of baseline firing rate to classify units as putative MSNs, FSIs, and TANs (Fig. 2, E and F). We found that 52% of TANs showed burst/pause responses to rewards (Fig. 2F, bottom), which are characteristic firing properties of this cell type (Aosaki et al. 1994). MSNs and TANs displayed wider spike waveforms than FSIs, and MSNs showed lower firing rates (mean ± SD: 1.1 ± 1.4 Hz) than both FSIs (mean ± SD: 8.7 ± 12.4 Hz) and TANs (mean ± SD: 4.0 ± 1.8 Hz, P < 0.05, unpaired t-test, Bonferroni corrected; Fig. 2G). MSNs and FSIs represented the highest proportion of recorded units (Fig. 2H), and we therefore focused the majority of our analysis on these two subpopulations.
Fig. 2.

Large-scale striatal recordings with silicon microprobes. A: illustration of the two 256 electrode silicon microprobe designs used to record in the striatum. Each silicon prong contains a high-density electrode array, with the geometry shown in magnified images of the tips. Short scale bars = 10 μm. B: fluorescence image of silicon microprobe tracks (white) embedded in a tyrosine hydroxylase (TH)-labeled section of the striatum (orange). White outline represents the perimeter of the striatum. Scale bar = 0.5 mm. C: samples of measured signals from 10 representative recording sites, filtered offline from 600 to 6,500 Hz. Columns show simultaneously recorded data from 2 sets of adjacent recording sites. D: distribution of signal-to-noise ratios for all recorded units used in the study. E: scatterplot of the log of baseline firing rate vs. spike waveform trough-to-peak time with color representing putative cell identity. Gray circles denote unclassified units. F, left: representative waveforms of three putative cell types, medium spiny neurons (MSNs), fast spiking interneurons (FSIs), and tonically active neurons (TANs) identified in this study. F, right: corresponding mean firing rate during CS+ trials for each representative unit depicted at left aligned to the cue onset. Shaded rectangle represents CS+ odor cue delivery time. Red triangles indicate reward delivery. Rates are averaged over all correctly performed trials. G: mean baseline firing rate across all recorded MSNs, FSIs, and TANs in the study (*P < 0.05, ***P < 0.001, Bonferroni-corrected t-test). H: percentage of each cell class that comprised the combined dataset.
When visualized at the population level, striatal MSNs exhibited distinct activity patterns during correct CS+ hit and correct CS− withholding trials (pooled data from 9 animals, n = 841 MSNs; Fig. 3A). Since the network appeared to distinguish between the two stimulus conditions, we quantified the fractions of MSNs whose firing rate significantly differed between correct CS+ hit trials and correct CS− withholding trials between the cue onset (t = 0 s) and reward delivery time (t = 2.5 s; Fig. 3B). These units are referred to as discriminating cells. On average, 23% of MSNs were found to have firing rates that discriminated between these trial types (Fig. 3C). All discriminating MSNs showed higher firing to CS+ relative to CS− cues. In addition to showing different firing rates to the two cues, discriminating MSNs showed overall higher firing rate responses during correct CS+ hit trials compared with their nondiscriminating MSN counterparts (P = 0.0004, paired t-test; Fig. 3D). This indicates that nondiscriminating MSNs tend to be a less active population during CS+ trials. We next inquired whether these populations differentially respond to movements that were concurrently measured in the experiment (licking and running). We correlated spiking activity of discriminating and nondiscriminating MSNs with lick rate and treadmill velocity. We found that discriminating MSN firing rate was more correlated to lick rate than nondiscriminating MSNs (P = 0.0002, paired t-test; Fig. 3E). On the other hand, discriminating and nondiscriminating MSNs were equally correlated to treadmill velocity (P = 0.9, paired t-test). These observations show that discriminating MSNs were more selective for licking and were equally selective for running speed relative to nondiscriminating MSNs. Thus it appears that some discriminating MSNs are modulated by both licking and running, which is consistent with a study showing that MSNs can multiplex multiple aspects of behavior (Rueda-Orozco and Robbe 2015). Furthermore, our definition of discriminating cells does not preclude that these neurons encode other behaviors, including nonmotor aspects of the task.
Fig. 3.

Identification of a cue-discriminating subpopulation of striatal MSNs. A: mean baseline subtracted and normalized firing rates for 841 MSNs obtained from 9 animals during correct CS+ trials (top) and correctly withheld CS− trials (middle). Units in both plots are sorted by latency to peak firing during CS+ trials (top). Cues are presented between 0 and 1 s, indicated by colored rectangles. Reward delivery during CS+ trials is indicated with the red triangle. A, bottom: mean baseline subtracted firing rate for all neurons depicted in the heat plots. The orange rectangle represents the odor delivery time. B: mean baseline subtracted firing rate for two MSNs during correct CS+ trials (blue) and correctly withheld CS− trials (magenta). Top: a representative discriminating MSN defined by differential firing between the CS+ and CS− trial conditions. B, bottom: a representative nondiscriminating MSN. Discrimination was determined on the interval from 0 to 2.5 s following cue onset. C: pie chart showing the mean fraction of cue-discriminating MSNs. D: mean value per animal of baseline subtracted firing rate between 0 and 2.5 s during correct CS+ trials for discriminating (Discrim) and nondiscriminating MSNs (P = 0.0004, paired t-test). E: mean Pearson correlation coefficient between spiking activity of discriminating and nondiscriminating MSNs, and lick rate (P = 0.0002, paired t-test) or treadmill velocity (P = 0.9, paired t-test). **P < 0.001; n.s., not significant. Each point represents 1 animal. Lines between points represent paired data from individual animals. All error bars represent SE.
Taking advantage of the high throughput recording capabilities of silicon microprobes, we mapped neural activity across a large extent of one section of the anterior striatum. With the use of their estimated position, neurons were assigned to one of twelve subregions forming a 4 × 3 compartment grid (Fig. 4A). The activity of the pooled population in each compartment was then averaged. Mean cue-triggered firing was found to be heterogeneous across the different grid compartments (Fig. 4B). Most strikingly, the responses to CS+ and CS− trials were most segregated in the lateral portions of the striatum. We also found that discriminating MSNs were more likely to be found on laterally positioned electrodes (discriminating MSN mediolateral position: 1.74 mm, 1 SD = 0.15 mm, nondiscriminating MSN mediolateral position: 1.5 mm, 1 SD = 0.15 mm, P = 0.02, n = 9, paired t-test; Fig. 4C). In agreement with these two observations, the mediolateral position of individual MSNs was correlated with greater differences between correct CS+ and CS− firing (r = 0.2, P < 0.0001, permutation test for correlations; Fig. 4D, left). We did not detect a corresponding correlation between CS+ and CS− firing and dorsoventral unit position (r = −0.05, P = 0.18, permutation test for correlations; Fig. 4D, right). Altogether, MSN population firing activity in the lateral striatum was more likely to show discriminatory firing, and that discriminating MSNs are more selective for licking than nondiscriminating MSNs.
Fig. 4.
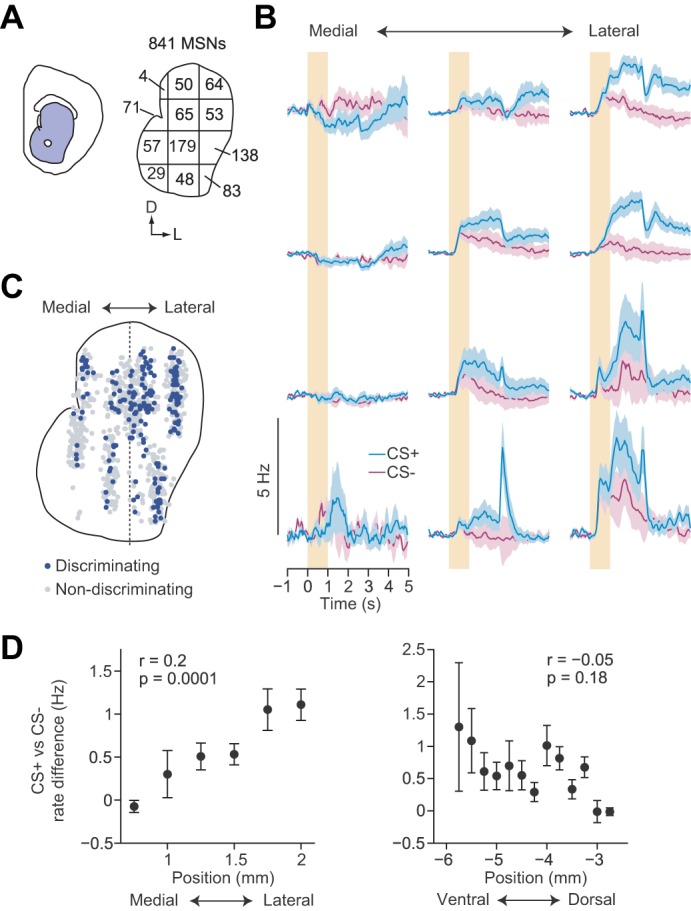
Mapping discriminatory activity across the striatal cross section. A: outline of the cross section of the striatum spatially divided into a 4 × 3 compartment grid. Values represent the total number of recorded MSNs allocated into each of the grid's compartments based on the estimated recording position of each unit. B: mean baseline subtracted firing rates for all MSNs positioned in each of the 12 boxes illustrated in A. Color conventions are identical to Fig. 3A. C: combined map of the location of discriminating (blue) and nondiscriminating (gray) MSNs recorded in all mice. Centers of all recordings were all aligned along the dotted line. D, left: Difference between the mean correct CS+ and CS− firing rates for all neurons binned by their mediolateral recording position. D, right: difference between the mean correct CS+ and CS− firing rates for all neurons binned by their dorsoventral recording position. Correlations were performed between position and difference in rate for MSNs pooled from all recordings (n = 841).
Previous work has shown that striatal neuron firing is altered as training progresses (Tremblay et al. 1998), suggesting that similar effects may be present in our recordings. We therefore investigated how discriminating and nondiscriminating MSN firing changed over time by measuring the difference between mean CS+ and CS− evoked firing in blocks of 25 trials (Fig. 5, A and B). We observed a steady change in discriminating MSN firing activity across trial blocks but did not see this pattern in nondiscriminating MSNs. A two-way, repeated-measures ANOVA revealed a significant effect of trial block (P < 0.0001, F3,48 = 11.3) and MSN population (P = 0.0003, F3,48 = 21.83) and showed an interaction between trial block and MSN population (P < 0.0001, F3,48 = 10.76). These results suggest that discriminating MSNs underwent a significant divergence from the remaining MSN population in encoding correct hit and withholding trials over time (Fig. 5C).
Fig. 5.

Evolution of activity in discriminatory MSNs during training. A: mean baseline subtracted firing rate for all discriminating MSNs during the period starting 1 s before cue onset until reward delivery for all CS+ trials (blue) and all CS− trials (magenta). Each panel depicts firing activity for each trial type in blocks of 25 trials. Color conventions are identical to Fig. 3A. B: same as A for nondiscriminating MSNs. C: mean firing rate difference between CS+ trials and CS− trials for discriminating and nondiscriminating MSNs in blocks of 25 trials. A two-way, repeated-measures ANOVA revealed a significant effect of trial block (P < 0.0001) and population (P = 0.0003) and a significant interaction between the 2 factors (P < 0.0001). Averages were computed across individual animals; n = 9. Error bars represent SE.
Discriminating MSNs form a temporally correlated ensemble.
The large scale of our silicon microprobe measurements provided a unique opportunity to analyze correlated dynamics among hundreds of simultaneously recorded striatal cell pairs to study how these populations interact at the network level. Numerous studies suggest that correlated spontaneous neural activity reflects the underlying connectivity of the network (Ko et al. 2011; Ringach 2009; Stern et al. 1998). As such, the resting state has become an important measurement modality in neuroscience (Cole et al. 2014; Raichle 2010; Reimer et al. 2014). To focus on spontaneous activity we calculated pairwise spike count Pearson correlations of units recorded in the same session during intermittent periods when animals were at rest. This corresponded to times when mice were neither moving on the treadmill nor licking or receiving explicit olfactory or reward stimuli (Fig. 6A).
Fig. 6.

Correlated resting state activity in the striatum. A: sample data depicting resting state identification. The black circles and magenta traces represent individual licks and running speed on the treadmill, respectively. Blue shaded regions label a 5-s window following cue onset. Gray shaded regions depict resting periods that would be concatenated with other resting periods for resting state analysis. B: mean resting correlation coefficient for all MSN pairs plotted as a function of pairwise distance (P < 0.0001, one-way ANOVA). Data are binned in 0.1-mm increments. C: Mean resting correlation coefficient for all MSN pairs plotted as a function of the pair's signal correlation during correct CS+ trials. Binned data show a strong relationship between these parameters, and unbinned data are also correlated (n = 23,758 pairs, permutation test for correlations). Removing the outlier point in the left-most bin did not change the significance of the correlation (P < 0.0001, r = 0.104, permutation test for correlations). D: mean signal correlation coefficient for significantly correlated (Sig) and noncorrelated MSN pairs during spontaneous activity in the resting state. Points represent mean values of individual animals (***P = 0.0008, paired t-test, n = 9). E: probability of finding significant resting correlations among discriminating MSN pairs, and between discriminating to nondiscriminating MSN pairs (**P = 0.0096, paired t-test). Points represent the fraction of pairs spaced within 0.025 to 1 mm recorded from individual animals. F: mean resting state firing rate of discriminating MSNs and nondiscriminating MSNs (*P = 0.011, paired t-test). Points represent the mean rate in individual animals. G: resting state correlation probabilities among discriminating MSN pairs and between discriminating to nondiscriminating MSN pairs calculated during resting times that occurred in different blocks of the recording. Each trial block represents resting periods detected within blocks of 25 CS+ trials. H: resting firing rates for discriminating and nondiscriminating MSNs calculated during blocked resting periods. I: mean probability of finding significant pairwise resting correlations, as a function of the firing rate of each cell in the pair. Color scale represents significant resting correlation probability. J: resting state correlation probabilities among pairs of discriminating and between pairs of discriminating to nondiscriminating MSNs that had firing rates ≤1 Hz (*P = 0.042, paired t-test). K: mean resting state firing rate of discriminating MSNs and nondiscriminating MSNs having firing rates < 1 Hz (P = 0.3, paired t-test). Lines between points represent paired data from individual animals. All error bars are SE.
We found that the strength of resting correlations decreased as a function of MSN pair separation (P < 0.0001, F9,24695 = 63.75, one-way ANOVA; Fig. 6B). This spatial clustering suggests that neighboring cells are more likely to share information, possibly via overlapping input. We next tested whether correlated resting state dynamics show any resemblance to correlated activity during the behavioral task. Indeed, we identified a significant relationship between resting and task-evoked signal correlations during correct CS+ hit trials (P < 0.0001, r = 0.104, permutation test for correlations; Fig. 6C). Since the small magnitudes of resting state correlation coefficients are difficult to interpret (Cohen and Kohn 2011), we identified correlations that could not occur by chance (P < 0.01, permutation test for correlations, see materials and methods). We found that MSNs with significant resting correlations had a higher signal correlation coefficient than uncorrelated MSNs (P = 0.0008, paired t-test; Fig. 6D). Together, these results demonstrate that the resting state of the striatal network contains an intrinsic organization that is related to behaviorally modulated dynamics. This relationship is consistent with a model in which common input drives correlated spontaneous as well as task-evoked striatal activity.
Using resting state correlation analysis, we asked if discriminating cells were distinct from the remaining population in terms of their likelihood of showing significant resting correlations. Indeed, we found that discriminating MSNs were more likely to exhibit significant correlations with one another than to nondiscriminating MSNs (P = 0.0096, paired t-test; Fig. 6E). In addition to being more correlated in their spontaneous activity, discriminating MSNs were more excitable as revealed by their higher spontaneous firing rate (P = 0.0109, paired t-test; Fig. 6F). We next investigated whether discriminating MSNs changed their correlation strengths over time during the course of the recording session. The recording was divided into four blocks corresponding to 25 CS+ trials, and network connectivity was analyzed separately during resting periods occurring within each block of trials. We found that there was no effect of time in either the probability of significant correlation among discriminating MSNs or between discriminating and nondiscriminating MSNs (P = 0.143, F3,48 = 1.85, two-way, repeated measures ANOVA; Fig. 6G). Similarly, there was no significant effect of time in the resting state firing rates (P = 0.8, F3,48 = 0.34, two-way, repeated measures ANOVA; Fig. 6H). These findings suggest that resting state correlations among discriminating MSNs remain relatively stable over the course of the first training session. However, we cannot rule out the possibility that resting correlations or firing change over more extended periods of training.
Firing rate is known to influence neural correlations between cells (Cohen and Kohn 2011; de la Rocha et al. 2007). On one hand, there may be a biological basis for this relationship: for example, experiments in cortical circuits show that highly active cells are more likely to be coupled (Yassin et al. 2010). However, to examine whether temporal correlations are purely explained by higher firing, we looked at the relationship between resting firing rate and correlation probability. As expected, the probability of finding significant resting state correlations was greatest when both MSNs had relatively high (>1 Hz) firing rate (Fig. 6I). Next, to account for the effects of firing rate we examined the correlation probability for pairs of cells whose resting rate did not exceed 1 Hz. Discriminating MSNs remained more likely to be correlated to one another than to nondiscriminating MSNs (P = 0.042, paired t-test; Fig. 6J) despite their no longer having significantly higher resting state firing (P = 0.3, paired t-test; Fig. 6K). Together, these results show that with respect to nondiscriminating MSNs, discriminating neurons represent a functionally specialized network in the striatum that is more tightly correlated during both spontaneous and task-evoked activity.
FSIs contribute to striatal microcircuit synchrony.
The striatal microcircuit contains a population of fast spiking interneurons that are thought to be involved in regulating striatal output signals (Berke 2011; Koos and Tepper 1999). As observed for MSNs, FSIs activity was modulated during the task, forming trajectories that qualitatively resembled the MSN population in their responses to CS+ and CS− trials (Figs. 7A). We found that FSIs were even more likely to be classified as discriminating than MSNs (P = 0.011, paired t-test; Fig. 7B) and were more correlated to licking rate (P = 0.016, paired t-test; Fig. 7C) and running velocity (P = 0.012, paired t-test) than MSNs. Approximately 15% of the recorded units were putative FSIs, providing a sufficiently large population for resting state correlation analysis. Resting state firing between FSIs was also more likely to be correlated than between MSNs (P < 0.0001, paired t-test; Fig. 7D). We found that discriminating FSIs were more likely to be correlated in their resting state activity to discriminating MSNs than to nondiscriminating MSNs (P = 0.04, paired t-test, Fig. 7E). We also compared the distributions of resting correlations among discriminating MSN pairs and pairs of discriminating MSNs and FSIs as a function of pairwise distance. We found that there were significant effects of both population (P < 0.0001, F9,4446 = 31.66, two-way ANOVA; Fig. 7F) and pairwise distance (P < 0.0001, F9,4446 = 4.96), suggesting that discriminating FSIs are more likely to be coupled with discriminating MSNs at greater distances than discriminating MSNs are coupled to each other. Together, these results show that discriminating FSIs and MSNs form a temporally correlated ensemble.
Fig. 7.

Discriminating FSIs and MSNs form correlated ensembles. A: Mean baseline subtracted and normalized firing rates for all 178 FSIs recorded from 9 animals during correct CS+ trials (top) and correctly withheld CS− trials (middle). Units in both plots are sorted by latency to peak firing in the top plot. Cues are presented between 0 and 1 s, indicated by colored rectangles. Reward delivery during CS+ trials is indicated with the red triangle. Bottom: mean baseline subtracted firing rate for all FSIs depicted in the heat plots. Orange rectangle represents odor delivery time. B: mean fraction of cue-discriminating MSNs and FSIs (*P = 0.011, paired t-test). C: mean Pearson correlation coefficient between spiking activity of all MSNs or FSIs, and lick rate (P = 0.016, paired t-test) or treadmill velocity (*P = 0.012, paired t-test) behavior. D: Probability of finding significant resting correlations among pairs of MSNs and FSIs (***P < 0.0001, paired t-test). E: probability of finding significant resting correlations among pairs of discriminating FSIs and MSNs and between pairs of discriminating FSIs and nondiscriminating MSNs (*P = 0.0395, paired t-test). F: Mean resting correlation coefficient for all discriminating FSI and MSN pairs and all discriminating MSN pairs plotted as a function of pairwise distance. A two-way ANOVA revealed a significant effect of population (P < 0.0001) and pairwise distance (P < 0.0001). Data pooled from all animals are binned in 0.1-mm increments. Lines between points represent paired data from individual animals. Error bars are all SE.
We next searched for potential microcircuit mechanisms for how striatal cell types might interact locally. We analyzed spike time cross correlations to assess the temporal relationship between cells on a millisecond timescale. We used a spike time jitter test (Fujisawa et al. 2008) to identify pairs with significant low latency cross correlations, consistent with the occurrence of direct synaptic coupling between these cells. To characterize average significant cross-correlation trends we performed an analysis on the entire recording session and pooled results from all animals in the study (n = 9 mice). Only 0.1% (38/28452 pairs) of MSN pairs showed evidence of low latency cross correlations typical of monosynaptic coupling (Fig. 8A). FSIs may also contribute to MSN activity through local interactions. Because of gap junction coupling, FSIs form a highly interconnected network (Hjorth et al. 2009; Koos and Tepper 1999; Lau et al. 2010; Russo et al. 2013). In agreement with their predicted synchrony, we found that FSIs had a higher interaction rate than MSNs (5.2%, 63/1221 pairs; Fig. 8B), and their cross correlation showed positive and symmetric coupling. Furthermore, we found that a subset of FSIs are coupled with MSNs (0.75%, 77/10323 pairs; Fig. 8C) in a manner consistent with feedforward inhibition (Koos and Tepper 1999). Our results show that the likelihood of finding significant FSI-MSN interactions with this analysis is relatively small, and another study failed to find these interactions altogether (Gage et al. 2010). We also detected a small population (∼4%) of tonically active neurons in our recordings and found that some FSIs were coupled to TANs (2.4%, 9/381 pairs; Fig. 8D). We detected very sparse TAN-MSN (0.05%, 1/2085 pairs) and zero TAN-TAN connections (0/88 pairs). Taken together the cross-correlation analysis suggests that FSIs form a highly synchronized subnetwork of cells that can alter the timing of MSN activity, although the impact of these interactions on circuit activity during behavior is not yet fully understood.
Fig. 8.

A, top: spike time cross correlogram between one pair of MSNs exhibiting significant cross correlation. Blue lines represent upper and lower 99% confidence intervals of the time-jittered cross correlation. A, bottom: mean jitter subtracted and normalized cross correlogram for all MSN pairs exhibiting significant cross correlation. The fraction (0.1%) indicates the proportion of MSN pairs recorded within 0.025 to 1 mm that exhibited significant cross correlation according to the jitter test. Dotted red lines are aligned to a time lag of 0 s. B: same as A but for FSI pairs. C: same as A but for MSN-FSI pairs. D: same as A but for TAN-FSI pairs. Error bars represent SE.
DISCUSSION
This study used large-scale neural recordings to characterize striatal network activity in mice learning to associate specific odor cues with rewards. We initially focused our analysis on single-unit activity during the task and identified a subpopulation of putative MSNs whose firing responses discriminated between correctly performed CS+ and CS− trials. Similar responses in individual striatal units have been previously reported during cue discrimination tasks (Nicola et al. 2004; Setlow et al. 2003; Tremblay et al. 1998). Compared with nondiscriminating units, discriminating MSNs displayed higher firing rate change during CS+ trials. The entire population of discriminating MSNs also responded with higher activity to CS+ trials than to CS− trials. These discriminatory responses were not uniformly distributed in the striatum. By mapping the recorded neural activity, we showed that discriminating MSNs were more likely to be found in the lateral side of the striatum. This appears to be consistent with the known anatomical organization of this structure; specifically, that the dorsolateral striatum receives significant input from the sensorimotor areas of the overlying cortex (Alexander et al. 1986; McGeorge and Faull 1989). Furthermore, single-unit measurements in the lateral striatum of rodents have been previously found to represent sensory and motor activity of different body parts, including those of the orofacial area and forelimbs (Cho and West 1997). In our study, discriminating MSNs were significantly more correlated with lick rate than nondiscriminating MSNs. Hence, this discriminating population could be involved in generating striatal output signals that mediate stimulus-specific anticipatory licking. We also showed that discriminating MSNs were modulated by running speed. However, running speed was equally correlated to both discriminating and nondiscriminating neuron firing. This may also be evidence that some discriminatory neurons are modulated by both types of behaviors, supporting a report on the multiplexed coding properties of striatal neurons (Rueda-Orozco and Robbe 2015). These results do not rule out that other aspects of the task also contribute to discriminating MSN coding.
Since there have been reports that the dorsomedial striatum is engaged during early stages of procedural learning (Thorn et al. 2010; Yin et al. 2005, 2009), it was slightly unexpected that we observed little change in activity in the medial striatal subregions (Fig. 4B). This might reflect differences in learning or behavioral strategies between our study and other work. The dorsolateral striatum has been implicated in mediating stimulus-response associations that appear in well-trained animals (Corbit and Janak 2007). However, some studies have reported that lesions to the dorsolateral striatum also impair acquisition of stimulus-response associations as well (Featherstone and McDonald 2004). Our results show that at least in the case of the Pavlovian reward association task employed here, the lateral striatum appears to be more active than the medial regions in the early stage of training. Further work needs to elucidate the role of specific microcircuits in the lateral striatum in acquiring and expressing this behavior. In addition to evidence that the medial and lateral striatal subregions have different functional contributions to behavior, the ventral striatum (nucleus accumbens) is also known to have unique reward processing functions compared with the dorsal striatum. This is thought to be partially based on the limbic inputs that this area receives (Voorn et al. 2004). We did not detect a strong relationship between MSN position along the dorsoventral axis and the degree of differential coding between CS+ and CS− trials. This was evidence that the dorsolateral and ventrolateral striatum both contained discriminating units. Thus as an approximation, we assumed no difference in temporal correlation properties among pairs of discriminating neurons throughout the striatum. Although this is likely to be an oversimplification, our recordings lacked the single-unit throughput to reliably examine differences in correlations between the dorsal and ventral striatum. Furthermore, our assumption does not imply that these subregions encode identical information, and indeed, the ability to map activity across a section of the striatum revealed marked differences in cue-evoked neural dynamics.
We took our analysis of discriminating units in a new direction by investigating temporal correlations among this population. To avoid the potentially confounding effects of behavior and stimuli on neural activity and correlations, we examined spontaneous activity, which coincided with periods when animals were at rest. An extensive body of literature has shown that spontaneous neural activity is related to behaviorally evoked activity (Arieli et al. 1996; Raichle 2010; Ringach 2009). We extended this principle to striatal microcircuits by demonstrating that resting state MSN correlations are correlated to signal correlations. We speculate that experience-dependent plasticity in the striatum may establish neural ensembles whose synaptic connectivity predisposes them to fire together both during behavior (leading to high signal correlation) and thus also during rest (leading to high resting correlation) (Fregnac 2003). A novel finding of this study was that discriminating units are more likely to be exhibit significant resting state correlations to each other than to nondiscriminating units. Correlated activity among neurons is attributed to common sources of input (Cohen and Kohn 2011). We therefore postulate that an important factor that mediates the observed pattern of correlations between discriminating MSNs is shared glutamatergic connections (Stern et al. 1998; Wilson 2013). Glutamateric axons that innervate the striatum are widely distributed (Kincaid and Wilson 1996), which may enable multiple MSNs to receive the same excitatory signals. However, since individual axons form only a few synapses with any individual MSN, eliciting action potentials may require coordinated glutamatergic activity from many axon terminals representing a diverse range of input (Kincaid et al. 1998). This may explain why the activity of the recorded MSNs was correlated with more than one type of behavior (e.g., licking and running).
We did not find that discriminating neurons became more correlated in their spontaneous activity during learning nor did they show a change in their excitability. This observation could be explained either because our analysis methods did not have the temporal resolution to observe the changes or that the discriminating MSN ensemble was already established before the experiment. In the latter scenario, discriminating neurons may already have been established by an animal's past experiences in its home cage before training, which would have involved some form of licking and running behaviors.
In addition to shared glutamatergic inputs, temporal correlations among MSNs are likely to be mediated by striatal interneurons such as FSIs, which are thought to control MSN firing on millisecond timescales (Damodaran et al. 2015). FSIs receive input from many of the same external sources as MSNs (Fino and Venance 2011) and are thus able to encode behaviorally relevant information. Indeed, we found that FSI firing rate was correlated to licking and running to an even greater degree than MSNs and FSIs were more likely to be classified as discriminating units than MSNs. Discriminating FSIs were also more likely to be correlated with discriminating MSNs over nondiscriminating MSNs. Many studies have shown that FSIs provide feedforward GABAergic inhibition of MSN spiking activity (Gittis et al. 2010; Koos and Tepper 1999; Mallet et al. 2005; Taverna et al. 2007). We found 0.75% of FSI-MSN pairs exhibited significant cross correlations in vivo, providing evidence for direct interactions between these two subpopulations of striatal neurons. It is interesting to note that another study did not find any significant cross correlations between these cell types in vivo (Gage et al. 2010). This suggests that FSI-MSN interactions may also occur over long timescales relative to single action potentials because of polysynaptic network effects in the striatum. FSI-FSI connectivity is complex as it involves both chemical and electrical synapses (Berke 2011; Fukuda 2009; Kita et al. 1990; Russo et al. 2013), whose collective influence on network activity in the intact brain or behavior is not well understood.
Another possible mechanism by which MSN activity can be correlated is through direct MSN-MSN connections. Despite a well-known effect of lateral inhibition among MSNs (Czubayko and Plenz 2002; Taverna et al. 2004; Tunstall et al. 2002), the role of this inhibitory coupling in striatal computation is still unclear (Tepper et al. 2008). Our cross-correlation analysis found very few significant low latency interactions among nearly 30,000 MSN pairs (only 0.1%), suggesting that individual MSN-MSN interactions are weak compared with other factors that influence MSN activity (Jaeger et al. 1994). Furthermore, inhibitory postsynaptic potentials (IPSPs) between MSNs have been found to be weak (Tunstall et al. 2002) relative to IPSPs evoked by FSIs on neighboring MSNs (Koos and Tepper 1999). Interestingly, the ratio of these IPSPs is in the same order of magnitude as the ratio of significant FSI-MSN to MSN-MSN cross-correlation pairs in our study, suggesting that cross correlations are sensitive to synaptic strength between two neurons. Thus our work appears to show that MSN-MSN interactions are sparsely detected using cross-correlation analysis, and that FSI-MSN coupling is 7.5 times more prevalent at the level of individual cell pairs. However, because of the abundance of MSNs in the striatum compared with FSIs, which only represent ∼1% of the total population (Berke 2011), the cumulative effect of lateral inhibition may have a significant impact on striatal microcircuit dynamics, particularly during periods when large groups of MSNs are synchronized (Carrillo-Reid et al. 2009).
Finally, temporal correlations in striatal microcircuits are believed to strongly depend on neuromodulatory signals such dopamine and acetylcholine. Dopamine has a well-known role in modulating MSN activity and plasticity (Gerfen and Surmeier 2011). Abnormally low levels of dopamine found in Parkinson's disease have been linked to excessive synchrony of striatal ensembles (Jaidar et al. 2010), as well as altered FSI-MSN connectivity (Gittis et al. 2011), both of which could also significantly impact temporal correlations. Cholinergic interneurons are sparsely distributed in the striatum but have been shown to significantly impact striatal activity (English et al. 2012). In addition to modulating the release of dopamine (Cachope et al. 2012; Threlfell et al. 2012) and GABA (Nelson et al. 2014) from midbrain dopaminergic terminals, cholinergic signaling has also been shown to regulate the efficacy of corticostriatal input in eliciting action potentials in MSNs (Perez-Ramirez et al. 2015; Shen et al. 2005). Cholinergic interneurons are thought to correspond to putative TAN units (Aosaki et al. 1994). We found only 1 significant MSN-TAN cross correlation out of over 2,000 pairs (<0.05%), which appears consistent with TANs influencing MSN activity on long timescales relative to single action potentials. On the other hand, significant FSI-TAN cross-correlation events were relatively common (9/381, 2.4%). Coupling between these cells (Koos and Tepper 2002) may indirectly influence MSN correlations as well. However, the role of interactions between TANs and other interneurons in coordinating MSN dynamics remains unclear.
In conclusion, large-scale neural recordings enabled an examination of temporal correlations among hundreds of electrophysiologically defined striatal neurons in animals undergoing reward conditioning. We identified a population of cue discriminating striatal neurons that were more highly correlated to each other than to nondiscriminating units. These results suggest that discriminating units represent a functionally specialized ensemble with a higher occurrence of shared connections from both external as well local sources. Thus temporal correlations among specialized neurons may help to pattern a strong output signal that is sent to downstream basal ganglia nuclei to facilitate behavior.
GRANTS
K. I. Bakhurin is supported by a Ruth L. Kirschstein National Research Service Award (T32-NS058280). P. Golshani acknowledges support by National Institute of Mental Health Grant R01-MH-101198 and Veterans Affairs Merit Award BX001524. S. C. Masmanidis acknowledges support by the Alfred P. Sloan Foundation, McKnight Foundation, a Harvey L. Karp Discovery Award, National Institute on Drug Abuse Grant R01-DA-034178, and National Science Foundation Grant CBET 1263785.
DISCLOSURES
No conflicts of interest, financial or otherwise, are declared by the author(s).
AUTHOR CONTRIBUTIONS
Author contributions: K.I.B., P.G., and S.C.M. conception and design of research; K.I.B. and V.M. performed experiments; K.I.B., V.M., and S.C.M. analyzed data; K.I.B. and S.C.M. interpreted results of experiments; K.I.B. prepared figures; K.I.B. and S.C.M. drafted manuscript; K.I.B., V.M., P.G., and S.C.M. approved final version of manuscript.
ACKNOWLEDGMENTS
We thank M. Einstein, B. Huang, T. Shuman, and J. Taxidis for discussions on the manuscript, A. Howe for assistance with cross-correlation analysis, S. Sampath for microprobe fabrication, W. Lee for microprobe wire bonding and head stage assembly, T. Heitzman and M. Walsh for olfactometer development, and R. Harrison for integrated circuit development.
REFERENCES
- Adler A, Katabi S, Finkes I, Israel Z, Prut Y, Bergman H. Temporal convergence of dynamic cell assemblies in the striato-pallidal network. J Neurosci 32: 2473–2484, 2012. [DOI] [PMC free article] [PubMed] [Google Scholar]
- Alexander GE, DeLong MR, Strick PL. Parallel organization of functionally segregated circuits linking basal ganglia and cortex. Annu Rev Neurosci 9: 357–381, 1986. [DOI] [PubMed] [Google Scholar]
- Aosaki T, Tsubokawa H, Ishida A, Watanabe K, Graybiel AM, Kimura M. Responses of tonically active neurons in the primate's striatum undergo systematic changes during behavioral sensorimotor conditioning. J Neurosci 14: 3969–3984, 1994. [DOI] [PMC free article] [PubMed] [Google Scholar]
- Arieli A, Sterkin A, Grinvald A, Aertsen A. Dynamics of ongoing activity: explanation of the large variability in evoked cortical responses. Science 273: 1868–1871, 1996. [DOI] [PubMed] [Google Scholar]
- Averbeck BB, Latham PE, Pouget A. Neural correlations, population coding and computation. Nat Rev Neurosci 7: 358–366, 2006. [DOI] [PubMed] [Google Scholar]
- Bair W, Zohary E, Newsome WT. Correlated firing in macaque visual area MT: time scales and relationship to behavior. J Neurosci 21: 1676–1697, 2001. [DOI] [PMC free article] [PubMed] [Google Scholar]
- Bennett BD, Wilson CJ. Spontaneous activity of neostriatal cholinergic interneurons in vitro. J Neurosci 19: 5586–5596, 1999. [DOI] [PMC free article] [PubMed] [Google Scholar]
- Berke JD. Functional properties of striatal fast-spiking interneurons. Front Syst Neurosci 5: 45, 2011. [DOI] [PMC free article] [PubMed] [Google Scholar]
- Cachope R, Mateo Y, Mathur BN, Irving J, Wang HL, Morales M, Lovinger DM, Cheer JF. Selective activation of cholinergic interneurons enhances accumbal phasic dopamine release: setting the tone for reward processing. Cell Rep 2: 33–41, 2012. [DOI] [PMC free article] [PubMed] [Google Scholar]
- Carrillo-Reid L, Tecuapetla F, Ibanez-Sandoval O, Hernandez-Cruz A, Galarraga E, Bargas J. Activation of the cholinergic system endows compositional properties to striatal cell assemblies. J Neurophysiol 101: 737–749, 2009. [DOI] [PubMed] [Google Scholar]
- Carrillo-Reid L, Tecuapetla F, Tapia D, Hernandez-Cruz A, Galarraga E, Drucker-Colin R, Bargas J. Encoding network states by striatal cell assemblies. J Neurophysiol 99: 1435–1450, 2008. [DOI] [PubMed] [Google Scholar]
- Cho J, West MO. Distributions of single neurons related to body parts in the lateral striatum of the rat. Brain Res 756: 241–246, 1997. [DOI] [PubMed] [Google Scholar]
- Cohen MR, Kohn A. Measuring and interpreting neuronal correlations. Nat Neurosci 14: 811–819, 2011. [DOI] [PMC free article] [PubMed] [Google Scholar]
- Cohen MR, Maunsell JH. Attention improves performance primarily by reducing interneuronal correlations. Nat Neurosci 12: 1594–1600, 2009. [DOI] [PMC free article] [PubMed] [Google Scholar]
- Cole MW, Bassett DS, Power JD, Braver TS, Petersen SE. Intrinsic and task-evoked network architectures of the human brain. Neuron 83: 238–251, 2014. [DOI] [PMC free article] [PubMed] [Google Scholar]
- Corbit LH, Janak PH. Inactivation of the lateral but not medial dorsal striatum eliminates the excitatory impact of Pavlovian stimuli on instrumental responding. J Neurosci 27: 13977–13981, 2007. [DOI] [PMC free article] [PubMed] [Google Scholar]
- Costa RM, Cohen D, Nicolelis MA. Differential corticostriatal plasticity during fast and slow motor skill learning in mice. Curr Biol 14: 1124–1134, 2004. [DOI] [PubMed] [Google Scholar]
- Cowan RL, Wilson CJ. Spontaneous firing patterns and axonal projections of single corticostriatal neurons in the rat medial agranular cortex. J Neurophysiol 71: 17–32, 1994. [DOI] [PubMed] [Google Scholar]
- Czubayko U, Plenz D. Fast synaptic transmission between striatal spiny projection neurons. Proc Natl Acad Sci USA 99: 15764–15769, 2002. [DOI] [PMC free article] [PubMed] [Google Scholar]
- Damodaran S, Cressman JR, Jedrzejewski-Szmek Z, Blackwell KT. Desynchronization of fast-spiking interneurons reduces beta-band oscillations and imbalance in firing in the dopamine-depleted striatum. J Neurosci 35: 1149–1159, 2015. [DOI] [PMC free article] [PubMed] [Google Scholar]
- de la Rocha J, Doiron B, Shea-Brown E, Josic K, Reyes A. Correlation between neural spike trains increases with firing rate. Nature 448: 802–806, 2007. [DOI] [PubMed] [Google Scholar]
- English DF, Ibanez-Sandoval O, Stark E, Tecuapetla F, Buzsaki G, Deisseroth K, Tepper JM, Koos T. GABAergic circuits mediate the reinforcement-related signals of striatal cholinergic interneurons. Nat Neurosci 15: 123–130, 2012. [DOI] [PMC free article] [PubMed] [Google Scholar]
- Featherstone RE, McDonald RJ. Dorsal striatum and stimulus-response learning: lesions of the dorsolateral, but not dorsomedial, striatum impair acquisition of a simple discrimination task. Behav Brain Res 150: 15–23, 2004. [DOI] [PubMed] [Google Scholar]
- Fino E, Venance L. Spike-timing dependent plasticity in striatal interneurons. Neuropharmacology 60: 780–788, 2011. [DOI] [PubMed] [Google Scholar]
- Fregnac Y. Hebbian synaptic plasticity. In: The Handbook of Brain Theory and Neural Networks, edited by Arbib MA. Cambridge, MA: MIT Press, 2003. [Google Scholar]
- Fujisawa S, Amarasingham A, Harrison MT, Buzsaki G. Behavior-dependent short-term assembly dynamics in the medial prefrontal cortex. Nat Neurosci 11: 823–833, 2008. [DOI] [PMC free article] [PubMed] [Google Scholar]
- Fukuda T. Network architecture of gap junction-coupled neuronal linkage in the striatum. J Neurosci 29: 1235–1243, 2009. [DOI] [PMC free article] [PubMed] [Google Scholar]
- Gage GJ, Stoetzner CR, Wiltschko AB, Berke JD. Selective activation of striatal fast-spiking interneurons during choice execution. Neuron 67: 466–479, 2010. [DOI] [PMC free article] [PubMed] [Google Scholar]
- Gerfen CR, Surmeier DJ. Modulation of striatal projection systems by dopamine. Annu Rev Neurosci 34: 441–466, 2011. [DOI] [PMC free article] [PubMed] [Google Scholar]
- Gittis AH, Hang GB, LaDow ES, Shoenfeld LR, Atallah BV, Finkbeiner S, Kreitzer AC. Rapid target-specific remodeling of fast-spiking inhibitory circuits after loss of dopamine. Neuron 71: 858–868, 2011. [DOI] [PMC free article] [PubMed] [Google Scholar]
- Gittis AH, Nelson AB, Thwin MT, Palop JJ, Kreitzer AC. Distinct roles of GABAergic interneurons in the regulation of striatal output pathways. J Neurosci 30: 2223–2234, 2010. [DOI] [PMC free article] [PubMed] [Google Scholar]
- Graybiel AM. The basal ganglia. Curr Biol 10: R509–R511, 2000. [DOI] [PubMed] [Google Scholar]
- Hjorth J, Blackwell KT, Kotaleski JH. Gap junctions between striatal fast-spiking interneurons regulate spiking activity and synchronization as a function of cortical activity. J Neurosci 29: 5276–5286, 2009. [DOI] [PMC free article] [PubMed] [Google Scholar]
- Humphries MD, Wood R, Gurney K. Dopamine-modulated dynamic cell assemblies generated by the GABAergic striatal microcircuit. Neural Netw 22: 1174–1188, 2009. [DOI] [PubMed] [Google Scholar]
- Jaeger D, Kita H, Wilson CJ. Surround inhibition among projection neurons is weak or nonexistent in the rat neostriatum. J Neurophysiol 72: 2555–2558, 1994. [DOI] [PubMed] [Google Scholar]
- Jaidar O, Carrillo-Reid L, Hernandez A, Drucker-Colin R, Bargas J, Hernandez-Cruz A. Dynamics of the Parkinsonian striatal microcircuit: entrainment into a dominant network state. J Neurosci 30: 11326–11336, 2010. [DOI] [PMC free article] [PubMed] [Google Scholar]
- Jog MS, Kubota Y, Connolly CI, Hillegaart V, Graybiel AM. Building neural representations of habits. Science 286: 1745–1749, 1999. [DOI] [PubMed] [Google Scholar]
- Kasanetz F, Riquelme LA, O'Donnell P, Murer MG. Turning off cortical ensembles stops striatal Up states and elicits phase perturbations in cortical and striatal slow oscillations in rat in vivo. J Physiol 577: 97–113, 2006. [DOI] [PMC free article] [PubMed] [Google Scholar]
- Kincaid AE, Wilson CJ. Corticostriatal innervation of the patch and matrix in the rat neostriatum. J Comp Neurol 374: 578–592, 1996. [DOI] [PubMed] [Google Scholar]
- Kincaid AE, Zheng T, Wilson CJ. Connectivity and convergence of single corticostriatal axons. J Neurosci 18: 4722–4731, 1998. [DOI] [PMC free article] [PubMed] [Google Scholar]
- Kita H, Kosaka T, Heizmann CW. Parvalbumin-immunoreactive neurons in the rat neostriatum: a light and electron microscopic study. Brain Res 536: 1–15, 1990. [DOI] [PubMed] [Google Scholar]
- Ko H, Hofer SB, Pichler B, Buchanan KA, Sjostrom PJ, Mrsic-Flogel TD. Functional specificity of local synaptic connections in neocortical networks. Nature 473: 87–91, 2011. [DOI] [PMC free article] [PubMed] [Google Scholar]
- Koos T, Tepper JM. Dual cholinergic control of fast-spiking interneurons in the neostriatum. J Neurosci 22: 529–535, 2002. [DOI] [PMC free article] [PubMed] [Google Scholar]
- Koos T, Tepper JM. Inhibitory control of neostriatal projection neurons by GABAergic interneurons. Nat Neurosci 2: 467–472, 1999. [DOI] [PubMed] [Google Scholar]
- Koralek AC, Costa RM, Carmena JM. Temporally precise cell-specific coherence develops in corticostriatal networks during learning. Neuron 79: 865–872, 2013. [DOI] [PubMed] [Google Scholar]
- Kravitz AV, Tye LD, Kreitzer AC. Distinct roles for direct and indirect pathway striatal neurons in reinforcement. Nat Neurosci 15: 816–818, 2012. [DOI] [PMC free article] [PubMed] [Google Scholar]
- Kreitzer AC, Berke JD. Investigating striatal function through cell-type-specific manipulations. Neuroscience 198: 19–26, 2011. [DOI] [PMC free article] [PubMed] [Google Scholar]
- Kreitzer AC, Malenka RC. Striatal plasticity and basal ganglia circuit function. Neuron 60: 543–554, 2008. [DOI] [PMC free article] [PubMed] [Google Scholar]
- Lau T, Gage GJ, Berke JD, Zochowski M. Local dynamics of gap-junction-coupled interneuron networks. Phys Biol 7: 16015, 2010. [DOI] [PMC free article] [PubMed] [Google Scholar]
- Mallet N, Le Moine C, Charpier S, Gonon F. Feedforward inhibition of projection neurons by fast-spiking GABA interneurons in the rat striatum in vivo. J Neurosci 25: 3857–3869, 2005. [DOI] [PMC free article] [PubMed] [Google Scholar]
- McGeorge AJ, Faull RL. The organization of the projection from the cerebral cortex to the striatum in the rat. Neuroscience 29: 503–537, 1989. [DOI] [PubMed] [Google Scholar]
- Mitchell JF, Sundberg KA, Reynolds JH. Spatial attention decorrelates intrinsic activity fluctuations in macaque area V4. Neuron 63: 879–888, 2009. [DOI] [PMC free article] [PubMed] [Google Scholar]
- Nelson AB, Hammack N, Yang CF, Shah NM, Seal RP, Kreitzer AC. Striatal cholinergic interneurons Ddive GABA release from dopamine terminals. Neuron 82: 63–70, 2014. [DOI] [PMC free article] [PubMed] [Google Scholar]
- Nicola SM, Yun IA, Wakabayashi KT, Fields HL. Cue-evoked firing of nucleus accumbens neurons encodes motivational significance during a discriminative stimulus task. J Neurophysiol 91: 1840–1865, 2004. [DOI] [PubMed] [Google Scholar]
- Perez-Ramirez MB, Laville A, Tapia D, Duhne M, Lara-Gonzalez E, Bargas J, Galarraga E. KV7 channels regulate firing during synaptic integration in GABAergic striatal neurons. Neural Plast 2015: 472676, 2015. [DOI] [PMC free article] [PubMed] [Google Scholar]
- Plenz D, Kitai ST. Up and down states in striatal medium spiny neurons simultaneously recorded with spontaneous activity in fast-spiking interneurons studied in cortex-striatum-substantia nigra organotypic cultures. J Neurosci 18: 266–283, 1998. [DOI] [PMC free article] [PubMed] [Google Scholar]
- Ponzi A, Wickens J. Sequentially switching cell assemblies in random inhibitory networks of spiking neurons in the striatum. J Neurosci 30: 5894–5911, 2010. [DOI] [PMC free article] [PubMed] [Google Scholar]
- Raichle ME. Two views of brain function. Trends Cogn Sci 14: 180–190, 2010. [DOI] [PubMed] [Google Scholar]
- Reig R, Silberberg G. Multisensory integration in the mouse striatum. Neuron 83: 1200–1212, 2014. [DOI] [PMC free article] [PubMed] [Google Scholar]
- Reimer J, Froudarakis E, Cadwell CR, Yatsenko D, Denfield GH, Tolias AS. Pupil fluctuations track fast switching of cortical states during quiet wakefulness. Neuron 84: 355–362, 2014. [DOI] [PMC free article] [PubMed] [Google Scholar]
- Ringach DL. Spontaneous and driven cortical activity: implications for computation. Curr Opin Neurobiol 19: 439–444, 2009. [DOI] [PMC free article] [PubMed] [Google Scholar]
- Roitman MF, Wheeler RA, Carelli RM. Nucleus accumbens neurons are innately tuned for rewarding and aversive taste stimuli, encode their predictors, and are linked to motor output. Neuron 45: 587–597, 2005. [DOI] [PubMed] [Google Scholar]
- Rueda-Orozco PE, Robbe D. The striatum multiplexes contextual and kinematic information to constrain motor habits execution. Nat Neurosci 18: 453–460, 2015. [DOI] [PMC free article] [PubMed] [Google Scholar]
- Russo G, Nieus TR, Maggi S, Taverna S. Dynamics of action potential firing in electrically connected striatal fast-spiking interneurons. Front Cell Neurosci 7: 209, 2013. [DOI] [PMC free article] [PubMed] [Google Scholar]
- Setlow B, Schoenbaum G, Gallagher M. Neural encoding in ventral striatum during olfactory discrimination learning. Neuron 38: 625–636, 2003. [DOI] [PubMed] [Google Scholar]
- Shadlen MN, Newsome WT. The variable discharge of cortical neurons: implications for connectivity, computation, and information coding. J Neurosci 18: 3870–3896, 1998. [DOI] [PMC free article] [PubMed] [Google Scholar]
- Shen W, Hamilton SE, Nathanson NM, Surmeier DJ. Cholinergic suppression of KCNQ channel currents enhances excitability of striatal medium spiny neurons. J Neurosci 25: 7449–7458, 2005. [DOI] [PMC free article] [PubMed] [Google Scholar]
- Shobe JL, Claar LD, Parhami S, Bakhurin KI, Masmanidis SC. Brain activity mapping at multiple scales with silicon microprobes containing 1,024 electrodes. J Neurophysiol 114: 2043–2052, 2015. [DOI] [PMC free article] [PubMed] [Google Scholar]
- Stern EA, Jaeger D, Wilson CJ. Membrane potential synchrony of simultaneously recorded striatal spiny neurons in vivo. Nature 394: 475–478, 1998. [DOI] [PubMed] [Google Scholar]
- Tang CC, Root DH, Duke DC, Zhu Y, Teixeria K, Ma S, Barker DJ, West MO. Decreased firing of striatal neurons related to licking during acquisition and overtraining of a licking task. J Neurosci 29: 13952–13961, 2009. [DOI] [PMC free article] [PubMed] [Google Scholar]
- Taverna S, Canciani B, Pennartz CM. Membrane properties and synaptic connectivity of fast-spiking interneurons in rat ventral striatum. Brain Res 1152: 49–56, 2007. [DOI] [PubMed] [Google Scholar]
- Taverna S, van Dongen YC, Groenewegen HJ, Pennartz CM. Direct physiological evidence for synaptic connectivity between medium-sized spiny neurons in rat nucleus accumbens in situ. J Neurophysiol 91: 1111–1121, 2004. [DOI] [PubMed] [Google Scholar]
- Tepper JM, Koos T, Wilson CJ. GABAergic microcircuits in the neostriatum. Trends Neurosci 27: 662–669, 2004. [DOI] [PubMed] [Google Scholar]
- Tepper JM, Wilson CJ, Koos T. Feedforward and feedback inhibition in neostriatal GABAergic spiny neurons. Brain Res Rev 58: 272–281, 2008. [DOI] [PMC free article] [PubMed] [Google Scholar]
- Thorn CA, Atallah H, Howe M, Graybiel AM. Differential dynamics of activity changes in dorsolateral and dorsomedial striatal loops during learning. Neuron 66: 781–795, 2010. [DOI] [PMC free article] [PubMed] [Google Scholar]
- Threlfell S, Lalic T, Platt NJ, Jennings KA, Deisseroth K, Cragg SJ. Striatal dopamine release is triggered by synchronized activity in cholinergic interneurons. Neuron 75: 58–64, 2012. [DOI] [PubMed] [Google Scholar]
- Tremblay L, Hollerman JR, Schultz W. Modifications of reward expectation-related neuronal activity during learning in primate striatum. J Neurophysiol 80: 964–977, 1998. [DOI] [PubMed] [Google Scholar]
- Tunstall MJ, Oorschot DE, Kean A, Wickens JR. Inhibitory interactions between spiny projection neurons in the rat striatum. J Neurophysiol 88: 1263–1269, 2002. [DOI] [PubMed] [Google Scholar]
- Voorn P, Vanderschuren LJ, Groenewegen HJ, Robbins TW, Pennartz CM. Putting a spin on the dorsal-ventral divide of the striatum. Trends Neurosci 27: 468–474, 2004. [DOI] [PubMed] [Google Scholar]
- Wilson CJ. Active decorrelation in the basal ganglia. Neuroscience 250: 467–482, 2013. [DOI] [PMC free article] [PubMed] [Google Scholar]
- Xiong Q, Znamenskiy P, Zador AM. Selective corticostriatal plasticity during acquisition of an auditory discrimination task. Nature 521: 348–351, 2015. [DOI] [PMC free article] [PubMed] [Google Scholar]
- Yassin L, Benedetti BL, Jouhanneau JS, Wen JA, Poulet JF, Barth AL. An embedded subnetwork of highly active neurons in the neocortex. Neuron 68: 1043–1050, 2010. [DOI] [PMC free article] [PubMed] [Google Scholar]
- Yim MY, Aertsen A, Kumar A. Significance of input correlations in striatal function. PLoS Comput Biol 7: e1002254, 2011. [DOI] [PMC free article] [PubMed] [Google Scholar]
- Yin HH, Mulcare SP, Hilario MR, Clouse E, Holloway T, Davis MI, Hansson AC, Lovinger DM, Costa RM. Dynamic reorganization of striatal circuits during the acquisition and consolidation of a skill. Nat Neurosci 12: 333–341, 2009. [DOI] [PMC free article] [PubMed] [Google Scholar]
- Yin HH, Ostlund SB, Knowlton BJ, Balleine BW. The role of the dorsomedial striatum in instrumental conditioning. Eur J Neurosci 22: 513–523, 2005. [DOI] [PubMed] [Google Scholar]
- Zohary E, Shadlen MN, Newsome WT. Correlated neuronal discharge rate and its implications for psychophysical performance. Nature 370: 140–143, 1994. [DOI] [PubMed] [Google Scholar]