

Abstract
When we evaluate an option, how is the neural representation of its value linked to information that identifies it, such as its position in space? We hypothesized that value information and identity cues are not bound together at a particular point but are represented together at the single unit level throughout the entirety of the choice process. We examined neuronal responses in two-option gambling tasks with lateralized and asynchronous presentation of offers in five reward regions: orbitofrontal cortex (OFC, area 13), ventromedial prefrontal cortex (vmPFC, area 14), ventral striatum (VS), dorsal anterior cingulate cortex (dACC), and subgenual anterior cingulate cortex (sgACC, area 25). Neuronal responses in all areas are sensitive to the positions of both offers and of choices. This selectivity is strongest in reward-sensitive neurons, indicating that it is not a property of a specialized subpopulation of cells. We did not find consistent contralateral or any other organization to these responses, indicating that they may be difficult to detect with aggregate measures like neuroimaging or studies of lesion effects. These results suggest that value coding is wed to factors that identify the object throughout the reward system and suggest a possible solution to the binding problem raised by abstract value encoding schemes.
Keywords: decision making, value comparison, prefrontal cortex, spatial tuning, binding
according to many neuroeconomic models, value comparison is anatomically and computationally distinct from the preceding evaluation and succeeding selection stages (Montague and Berns 2002; Padoa-Schioppa and Assad 2006; Lim et al. 2011; Padoa-Schioppa 2011; Hunt et al. 2012; Strait and Hayden 2013). In other words, we compare values in an abstract space that is independent of factors that do not influence value. Such factors include each option's spatial position and the action required to choose it (Padoa-Schioppa and Assad 2006; Padoa-Schioppa 2011). While a representation of the features of an option beyond its value, its identity, is not essential for comparing values, it is necessary for attending to options, for selecting them, and for learning and monitoring processes. Consequently, abstract choice models face a nontrivial binding problem: how is value information recombined to select an option and to monitor the outcome of that selection?
One possibility is that value-sensitive neurons carry information that identifies, even if noisily, the option they describe. Even though neural firing rates are unidimensional, they can still easily multiplex information (Rigotti et al. 2013). Such information can nonetheless be decoded in ensemble activity, thus mitigating the problem of neural noise. There is some evidence that reward-sensitive neurons carry information sufficient to identify options. In particular, in computerized choice tasks, the spatial position of choice options serves as an indicator of its identity. Selectivity for spatial position has been observed in neurons in frontopolar area 10, areas 11 and 13 of the orbitofrontal cortex (OFC), rodent OFC, dorsomedial prefrontal cortex, and amygdala, and anterior and posterior cingulate cortexes show sensitivity to the spatial position of the chosen option after the choice is made (Dean et al. 2004; Roesch et al. 2006; Seo and Lee 2009; Tsujimoto et al. 2009, 2010; Abe and Lee 2011; Heilbronner and Platt 2013; Peck et al. 2013; Hayden and Platt 2010; Cai and Padoa-Schioppa 2012; Bryden and Roesch 2015; Luk and Wallis 2013). These results raise the possibility that information about choice is maintained ubiquitously throughout the reward system.
Here we investigated and compared neuronal response selectivity to the spatial positions of offers and choices in five reward areas, ventromedial prefrontal cortex (vmPFC), ventral striatum (VS), area 13 of OFC, dorsal anterior cingulate cortex (dACC), and subgenual anterior cingulate cortex (sgACC). These five regions have all been identified as central sites for value comparison (Kable and Glimcher 2009; Hare et al. 2011; Padoa-Schioppa 2011; Rushworth et al. 2011; Amemori and Graybiel 2012; Levy and Glimcher 2012; Bartra et al. 2013; Monosov and Hikosaka 2012; Strait et al. 2015; Stott and Redish 2014). We made use of datasets collected for other studies; in each dataset, monkeys performed one of three similar gambling tasks. In all three tasks, options (gambles in all cases) appeared asynchronously on either side of a central fixation point and monkeys used a direct gaze shift to choose.
In all five brain regions, we found modest selectivity for offer position during presentation and stronger selectivity for the chosen position after choice. This coding was reliably observed in the same set of neurons that coded for value, indicating that there were not two separate populations of cells. We found extremely weak and inconsistent contralateral/contraversive bias in selectivity, suggesting that these effects would be invisible to methods that rely on aggregate neural measures like functional (f)MRI and lesion studies. These responses were sufficient to identify options and thus inconsistent with the assumption that coding of reward amount in these areas is independent of identity. This information may serve to “tag” the option (to use a term coined by Shadlen and Movshon 1999), thus solving the binding problem of reward-based choice.
METHODS
Surgical procedures.
All animal procedures were approved by the University Committee on Animal Resources at the University of Rochester and were designed and conducted in compliance with the Public Health Service's Guide for the Care and Use of Animals. Four male rhesus macaques (Macaca mulatta) served as subjects for each of three tasks. A small prosthesis for holding the head was used. Animals were habituated to laboratory conditions and then trained to perform oculomotor tasks for liquid reward. A Cilux recording chamber (Crist Instruments & NAN Instruments) was placed over the area of interest (see Behavioral tasks for breakdown). Position was verified by magnetic resonance imaging with the aid of a Brainsight system (Rogue Research). Animals received appropriate analgesics and antibiotics after all procedures. Throughout both behavioral and physiological recording sessions, the chamber was kept sterile with regular antibiotic washes and sealed with sterile caps.
Recording sites.
We approached vmPFC, VS, OFC, dACC, and sgACC through standard recording grids (Crist Instruments). We defined vmPFC as lying within the coronal planes situated between 29 and 44 mm rostral to the interaural plane, the horizontal planes situated between 0 and 9 mm from the brain's ventral surface, and the sagittal planes between 0 and 8 mm from the medial wall (Fig. 1B). These coordinates correspond to area 14 (Ongur and Price 2000). We defined VS as lying within the coronal planes situated between 28.02 and 20.66 mm rostral to interaural plane, the horizontal planes situated between 0 to 8.01 mm from ventral surface of striatum, and the sagittal planes between 0 to 8.69 mm from medial wall (Fig. 1C). We defined OFC as lying within the coronal planes situated between 29.50 and 35.50 mm rostral to interaural plane, the horizontal planes situated between 0 to 6.00 mm from the brain's ventral surface, and the sagittal planes between 6.54 and 13.14 mm from medial wall (Fig. 1D). We defined dACC as lying within the coronal planes situated between 29.50 and 34.50 mm rostral to interaural plane, the horizontal planes situated between 4.12 to 7.52 mm from the brain's dorsal surface, and the sagittal planes between 0 and 5.24 mm from medial wall (Fig. 1E). We defined sgACC as lying within the coronal planes situated between 24 and 36 mm rostral to interaural plane, the horizontal planes situated between 17.33 and 25.12 mm from the brain's dorsal surface, and the sagittal planes between 0 and 5.38 mm from medial wall (Fig. 1F). Our recordings were made from central regions within these zones. We confirmed recording location before each recording session using our Brainsight system with structural magnetic resonance images taken before the experiment. Neuroimaging was performed at the Rochester Center for Brain Imaging on a Siemens 3T MAGNETOM Trio Tim using 0.5 mm voxels. We confirmed recording locations by listening for characteristic sounds of white and gray matter during recording, which in all cases matched the loci indicated by the Brainsight system with an error of <1 mm in the horizontal plane and <2 mm in the z-direction.
Fig. 1.

General task structure and anatomy. A: general timeline of the 3 tasks. Two options were presented, each offering a gamble for water reward. Offers appeared in sequence, offset by 1 s and in a random order for 400 ms each. Then, after fixation, both offers reappeared during a decision phase (see Fig. 4 for more detail). B: magnetic resonance image of monkey B ventromedial prefrontal cortex (vmPFC; highlighted in red). C: magnetic resonance image of monkey B ventral striatum (VS). Recordings were made in the nucleus accumbens region of the striatum (highlighted in orange). D: magnetic resonance image of monkey B orbitofrontal cortex (OFC; highlighted in blue). E: magnetic resonance image of monkey B dorsal anterior cingulate cortex (dACC; highlighted in green). F: magnetic resonance image of monkey B subgenual anterior cingulate cortex (sgACC; highlighted in pink).
Electrophysiological techniques.
Single electrodes (Frederick Haer; impedance range 0.8 to 4 MΩ) were lowered using a microdrive (NAN Instruments) until waveforms between one and three neuron(s) were isolated. Individual action potentials were isolated on a Plexon system (Plexon, Dallas, TX). Neurons were selected for study solely on the basis of the quality of isolation; we never preselected based on task-related response properties. All collected neurons for which we managed to obtain at least 300 trials were analyzed; no neurons that surpassed our isolation criteria were excluded from analysis.
Eye-tracking and reward delivery.
Eye position was sampled at 1,000 Hz by an infrared eye-monitoring camera system (SR Research). Stimuli were controlled by a computer running Matlab (Mathworks) with Psychtoolbox and Eyelink Toolbox. Visual stimuli were colored rectangles on a computer monitor placed 57 cm from the animal and centered on its eyes (Fig. 1A). A standard solenoid valve controlled the duration of juice delivery. The relationship between solenoid open time and juice volume was established and confirmed before, during, and after recording.
Behavioral tasks.
Four monkeys performed in three different tasks with the same basic structure. For the neuronal recordings in vmPFC, subjects B and H performed the risky choice task; for VS, subjects B and C performed the risky choice task (Fig. 2A); for OFC, subjects B and J performed the curiosity gambling task (Fig. 2B); and for dACC and sgACC, subjects B and J performed the token risky choice task (Fig. 2C). All tasks made use of vertical rectangles indicating reward amount and probability. This method produces reliable communication of abstract concepts such as reward, probability, and (in other paradigms) delay to monkeys (Pearson et al. 2010; Blanchard et al. 2013; Blanchard and Hayden 2014).
Fig. 2.

Timeline of behavioral tasks. A: risky choice task. Two options were presented, each offering a gamble for water reward. Each gamble was represented by a rectangle, some proportion of which was grey, blue, or green, signifying a small, medium, or large reward respectively. The size of this colored region indicated the probability that choosing that offer would yield the corresponding reward. B: curiosity gambling task. Two offers appeared in sequence, each followed by a blank period. The monkey then had to fixate a central target. The 2 options then reappeared and the monkey chose 1 by shifting gaze to it. Then a cue appeared indicating either gamble win, loss, or uncertainty. Following a 2.25-s delay, the monkey obtained the outcome. Magenta and cyan bars indicated uninformative and informative outcomes, respectively. Inscribed white rectangle indicated gamble stakes. Inscribed red and green circles indicated cue. C: token risky choice task. Two options were presented, each offering a gamble for tokens. The size of each colored region within each offer indicated the probability that choosing that offer would yield the corresponding outcome. A small reward was administered for each completed trial. When at least 6 tokens were earned, a large “jackpot” reward was administered and the earned token count was reset to 0.
Risky choice task.
All tasks were based on a standardized general structure for gambling tasks (Heilbronner and Hayden 2013). Two offers were presented on each trial. Each offer was represented by a rectangle 300 pixels tall and 80 pixels wide (11.35° of visual angle tall and 4.08° of visual angle wide; Fig. 2A). Options offered either a gamble or a safe (100% probability) bet for liquid reward. Gamble offers were defined by two parameters, reward size and probability. Each gamble rectangle was divided into two portions, one red and the other either blue or green. The size of the blue or green portions signified the probability of winning a medium (mean 165 μl) or large reward (mean 240 μl), respectively. These probabilities were drawn from a uniform distribution between 0 and 100%. The rest of the bar was colored red; the size of the red portion indicated the probability of no reward. Safe offers were entirely gray and always carried a 100% probability of a small reward (125 μl). Offer types were selected at random with a 43.75% probability of blue (medium stakes) gamble, a 43.75% probability of green (high stakes) gambles, and a 12.5% probability of gray options (safe offers).
On each trial, one offer appeared on the left side of the screen and the other appeared on the right. The sides of the first and second offer (left and right) were randomized by trial. Each offer appeared for 400 ms and was followed by a 600-ms blank period. After the offers were presented separately, a central fixation spot appeared and the monkey fixated on it for 100 ms. Following this, both offers appeared simultaneously and the animal indicated its choice by shifting gaze to its preferred offer and maintaining fixation on it for 200 ms. Failure to maintain gaze for 200 ms did not lead to the end of the trial but instead returned the monkey to a choice state; thus monkeys were free to change their mind if they did so within 200 ms (although in our observations, they seldom did so). Following a successful 200-ms fixation, the gamble was immediately resolved and reward delivered. Trials that took >7 s were considered inattentive trials and were not included in analysis (this removed <1% of trials). Outcomes that yielded rewards were accompanied by a visual cue: a white circle in the center of the chosen offer. All trials were followed by an 800-ms intertrial interval with a blank screen.
Curiosity gambling task.
A similarly structured gambling task, where gambles always carried a reward probability of 50% and the size of a white bar in the center of each offer indicated reward size at 21 levels: from 75 to 375 μl in increments of 15 μl. Each trial, the monkey chose between an informative gamble (cyan; if chosen a cue 2.25 s before the potential reward would indicate if the monkey was about to win) and an uninformative gamble (magenta; if chosen the cue was replaced with an uninformative decoy; Fig. 2B). The stakes of both options and the order and side on which the informative option appeared were all randomized on all trials. Critically, the information was not revealed during the presentation of the cues, but only after the choice was made. Thus neural responses to the offers were not themselves reflective of the information.
Token risky choice task.
Another similarly structured gambling task, where gambles each had two potential outcomes, wins or losses in terms of “tokens” displayed onscreen as cyan circles. A small reward (100 μl) was administered concurrently with gamble feedback on each trial, regardless of gamble outcome. Trials in which the monkey accumulated six or more tokens triggered an extra “jackpot” epoch in which a very large reward (300 μl) was administered (Fig. 2C).
Reuse of data.
Some of these data were previously published (vmPFC dataset in Strait et al. 2014; VS dataset in Strait et al. 2015; OFC dataset in Blanchard et al. 2015; the others have not previously been published). All analyses presented here are new.
Statistical methods.
Peristimulus time histograms were constructed by aligning spike rasters to the presentation of the first offer and averaging firing rates across multiple trials. Firing rates were calculated in 20-ms bins but were generally analyzed in longer (500 ms) epochs. For display, peristimulus time histograms were smoothed using a 200-ms running boxcar. Some statistical tests of neuron activity were only appropriate when applied to single neurons because of variations in response properties across the population. In such cases, a χ2-test was used to determine if a significant portion of single neurons reached significance on their own, thereby allowing conclusions about the neural population as a whole.
Decoding analysis.
For our decoding analysis, we first separated trials by stimulus side (right or left) for the epoch of interest. We required the same number of trials both across neurons and across conditions (stimulus on right and stimulus on left). Therefore, for each analysis, we first found the lowest number of trials in either of the two conditions across all of the neurons and used this as the number of trials we would give to our classifier. Although neurons were not recorded simultaneously, we treated them as if they were (Quian Quiroga et al. 2006). This means we grouped trials together across neurons as if they were a single trial. Thus each of these pseudotrials was paired with values from each neuron, giving us an n by m matrix (where m is the minimum number of trials in each condition across neurons and n is the number of neurons). The only criterion for grouping trials together was that they fell in the same condition (left or right), and thus the trials used differed in terms of other task variables (reward size and risk of the stimulus presented). We took the mean firing rate of each neuron in each of these trials as input into the classifier algorithm.
We used a Euclidean nearest-neighbor classifier with fivefold cross validation. This means we treated each trial as a point in n-dimensional space (where n is the number of neurons, and the position in a given dimension was the mean firing rate of 1 neuron). We divided the data into five groups. On each of the five rounds of cross-validation, one group would be chosen as the validation set. To classify each trial, we took the mean position of the two groups (stimulus on left and stimulus on right) from the validation set. We then took the Euclidean distance between the current trial and the mean position of the two groups, whichever distance was smaller was the group the trial was classified as. One round was completed when all trials outside of the validation set had been classified. Each of the five groups formed the validation set on exactly one of the cross-validation rounds.
To determine if the performance of our classifier was significant, we performed a permutation test. This involved taking the same trials and firing rates, stripping their labels (left or right), and randomly assigning them one of two arbitrary labels. We then ran the classifier on the trials with their new, randomly assigned labels. We ran this 10,000 times to generate a distribution of correctly classified trials for uninformative labels. The proportion of random labels that had more correct trials than the classifier with the actual labels was then fed to a standard permutation test to give our P value.
Vector analysis to test for separate populations.
In one analysis, we sought to understand whether the same neurons were involved in coding spatial variables and reward variables. To investigate this question, we generated a coding vector for each of the five neural populations (vmPFC, VS, OFC, dACC, and sgACC). We performed the following analysis on each dataset separately.
We first mean and variance normalized the firing rate of all neurons by computing the average mean and variance of firing in 20-ms bins across the recording session; we subtracted the mean and divided by the variance. This provides what is essentially a matrix of z-scored event-aligned neural responses. We then regressed normalized firing rates in epoch 1 against the expected value of the gamble in the same epoch and obtained reward tuning regression coefficients and regressed normalized firing rates in the same epoch against the position of the first offer and obtained position tuning regression coefficients. Because we were interested in knowing whether the same neurons were involved in coding these two types of information, and information is not dependent on sign of tuning, we next took the absolute values of these coefficients. We repeated this process for all neurons in our sample and generated a two population coding strength vectors, one for reward and one for position. We then compared these two vectors with a standard correlation test. In our second analysis, we next repeated this process using epoch 3 for firing rates, the obtained reward amount for the reward analysis, and the chosen side for the position analysis. We again took the absolute values of the regression vectors and compared the reward and position vectors using a correlation test.
RESULTS
Spatial biases in choice and adjustment are weak.
The results described here come from data collected in four monkeys in three different tasks with the same basic structure (see methods; Figs. 1A and 2, A–C). As the monkeys performed each task, the activity of single neurons was recorded in one of five reward regions in the brain: area 14 of vmPFC, VS, area 13 of OFC, dACC, or area 25 of sgACC (which is part of the ventromedial network of Ongur and Price 2000). Our recording sites are shown in Fig. 1, B–F, respectively. For the neuronal recordings in vmPFC, subjects B and H performed the risky choice task; for VS, subjects B and C performed the risky choice task; for OFC, subjects B and J performed the curiosity gambling task; and for dACC and sgACC, subjects B and J performed the token risky choice task. Behavioral and physiological data for the vmPFC, VS, and OFC experiment have been reported previously (Strait et al. 2014, 2015; Blanchard et al. 2015). In all tasks, monkeys saw two asynchronously presented gambles that appeared on the left and right of fixation in random order. Gaze was not constrained and monkeys almost always fixated on the options when they appeared. After both options were presented, fixation was reacquired and the options reappeared in the same positions. The subject then chose one option by shifting gaze toward the selected option and obtained a reward.
Comparison across multiple similar, yet distinct tasks can be useful to test the flexibility of theories such as ours. However, these comparisons come with the caveat that decision task variable representation and choice mechanisms may differ as a function of task difficulty, which no doubt varies to some degree across these tasks. Indeed, evidence from the prefrontal cortex suggests that during easier trials task-relevant information shows up faster in single neurons (Kim and Shadlen 1999) and stronger in blood oxygen level-dependent (BOLD) fMRI (Heekeren et al. 2004, 2008; Rolls et al. 2010).
Choice behavior was consistent across the four monkeys and three tasks. Monkeys showed very weak side biases (Table 1). Monkeys also showed weak trial-to-trial biases in regard to the likelihood of repeating a side. These results indicate that monkeys' choices are made primarily based on the values of options. We also found that monkeys only very weakly adjusted their side as a function of win vs. loss. Thus, although monkeys switch sides more often following losses than wins, the effect is very small, inconsistent across subjects, and is not a major determinant of choices. This observation is important because previous studies showing spatial selectivity in these areas have involved a strong outcome-dependent effect on choices, an effect that may have promoted artifactual spatial selectivity (Padoa-Schioppa and Cai 2011).
Table 1.
Behavioral results
| Area | Subject | %Choosing Left | P Value | %Repeating Side | P Value | %Side Switch Following Loss | P Value |
|---|---|---|---|---|---|---|---|
| vmPFC | B | 50.1900 | 0.0038 | 49.8700 | 0.0042 | 49.8800 | 0.0079 |
| vmPFC | H | 50.5600 | 0.0007 | 51.2200 | <0.0001 | 49.4800 | 0.0041 |
| VS | B | 46.0400 | <0.0001 | 49.2700 | 0.0024 | 51.8400 | 0.0010 |
| VS | C | 54.1100 | <0.0001 | 51.2400 | 0.0002 | 51.5900 | 0.0019 |
| OFC | B | 46.6600 | <0.0001 | 51.0300 | <0.0001 | 50.7600 | 0.0017 |
| OFC | H | 47.9600 | <0.0001 | 51.3300 | 0.0001 | 51.3700 | 0.0010 |
| dACC | B | 49.7300 | 0.0059 | 52.4700 | <0.0001 | 52.4400 | <0.0001 |
| dACC | J | 51.0400 | 0.0001 | 54.0100 | <0.0001 | 54.1000 | <0.0001 |
| sgACC | B | 45.8872 | <0.0001 | 51.8566 | 0.0006 | 49.3517 | 0.4254 |
| sgACC | J | 54.6069 | <0.0001 | 56.9829 | <0.0001 | 41.6913 | <0.0001 |
All 4 monkeys showed small biases in side chosen (left vs. right). All 4 monkeys also showed small biases from the side chosen on the previous trial (repeat side vs. switch side). Finally, all 4 monkeys also showed extremely small biases towards or away from switching sides following a loss (repeat side vs. switch side). These effects are nonetheless significant given the large number of trials used. vmPFC, ventromedial prefrontal cortex; VS, ventral striatum; OFC, orbitofrontal cortex; dACC, dorsal anterior cingulate cortex; sgACC, subgenual anterior cingulate cortex.
Neural selectivity for positions of offers.
In all three of our gambling tasks, subjects chose an option after a presentation phase in which the two options appeared asynchronously (Figs. 1A and 2, A–C). Because spatial position and reward value (i.e., the mathematical expected value of the gamble) were randomized and fully crossed in the design of all three tasks, we could easily characterize selectivity for position of offers by comparing neural activity on trials with the left option presented first and trials with the right option presented first (and averaging across all other aspects of the gamble). Some analyses below refer to three numbered task epochs. Epochs 1 and 2 were 500-ms periods after presentation of offers 1 and 2, respectively. Epoch 3 was the 500-ms period immediately following the reward.
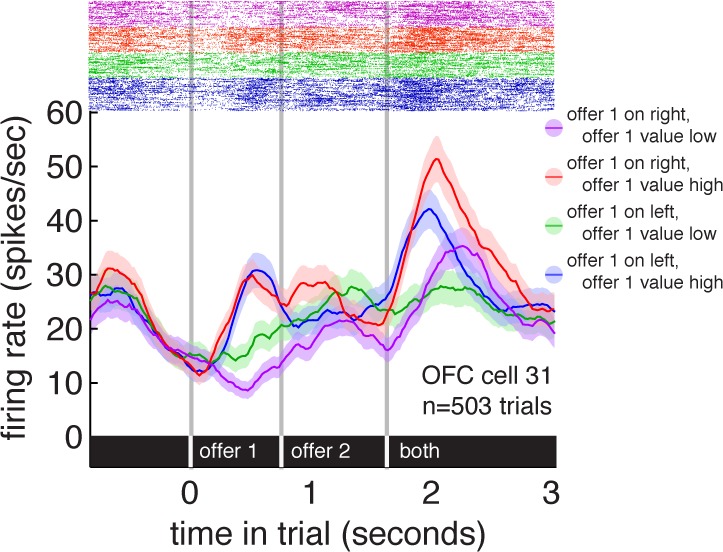
Figure 3A shows responses of one vmPFC neuron on left side first trials and right side first trials. This neuron shows consistently greater firing when the left option appears, regardless of whether it occurs first or second. Examples of similarly selective neurons for OFC, VS, dACC, and sgACC are shown in Fig. 3, C, E, G, and I, respectively. Note that our task designs did not require monkeys to fixate during the offer epochs, so the selectivity we observe in these and other cells may reflect motoric or gaze-direction-dependent responses associated with an overt saccade; it may also reflect attentional processes or motor planning processes. We do not consider this to be a limitation of these studies given that our interest is in identification of options (see discussion).
Fig. 3.

Tuning for offer side. A: raster plot and average responses of an example vmPFC neuron to task events, separated by offer side. This neuron showed consistently greater firing when the contralateral offer appeared, regardless of its order. B: plot of proportion of vmPFC neurons that show a significant difference in responses to offer 1 depending on its position (500 ms sliding boxcar). C: raster plot and average responses of an example VS neuron to task events, separated by offer side. This neuron also showed greater firing when the contralateral offer appeared. D: plot of proportion of VS neurons that show a significant difference in responses to offer 1 depending on its position (500-ms sliding boxcar). E: raster plot and average responses of an example OFC neuron to task events, separated by offer side. This neuron also showed greater firing when the contralateral offer appeared. F: plot of proportion of OFC neurons that show a significant difference in responses to offer 1 depending on its position (500-ms sliding boxcar). G: raster plot and average responses of an example dACC neuron to task events, separated by offer side. This neuron also showed greater firing when the contralateral offer appeared. H: plot of proportion of dACC neurons that show a significant difference in responses to offer 1 depending on its position (500-ms sliding boxcar). I: raster plot and average responses of an example sgACC neuron to task events, separated by offer side. This neuron also showed greater firing when the contralateral offer appeared. J: plot of proportion of sgACC neurons that show a significant difference in responses to offer 1 depending on its position (500-ms sliding boxcar).
Across the population of vmPFC neurons, we found evidence for weak spatial selectivity in responses to the order of offers. During epoch 1, 10.26% of vmPFC neurons (n = 16/156, significant at α = 0.05, χ2 = 9.74, P = 0.0026) showed a significant difference in responses to offer 1 depending on its position (Fig. 3B). In epoch 2, the same proportion, 10.26% of cells (n = 16/156) showed such a difference (χ2 = 9.074, P = 0.0026). Of the individual vmPFC neurons that showed spatial selectivity for offer side in epochs 1 and 2, 69% (n = 11/16) in epoch 1 and 50% (n = 8/16) in epoch 2 showed greater activity when the offer appeared on the contralateral side (these biases are not significant, χ2 = 2.250, P = 0.1336 and χ2 = 0, P = 1). Of the larger population of all the neurons in vmPFC, including those with nonsignificant modulation, 51.3% (in epoch 1, n = 80/156) and 53.21% (in epoch 2, n = 83/156) showed significantly greater firing for contralateral presentations (these biases are also not significant, χ2 = 0.103, P = 0.748 and χ2 = 0.641, P = 0.4233). This lack of a significant bias for offers suggests that aggregate measures of neuronal activity, such as neuroimaging and lesion studies, may not detect any evidence of spatial selectivity in vmPFC.
Similar results were observed in VS neurons. During epoch 1, 8.87% of neurons (n = 11/124, just barely statistically significant, χ2 = 3.912, P = 0.0480) showed a significant difference in responses to offer 1 depending on its position (Fig. 3D). In epoch 2, 12.1% (n = 15/124) showed such a difference (χ2=13.148, P = 0.0003). Of the VS neurons that showed spatial selectivity for offer side in epochs 1 and 2, 54.5% (n = 6/11) and 46.7% (n = 7/15) showed greater activity when the offer appeared on the contralateral side (these biases are not significant, χ2 = 0.067, P = 0.7963). Of all the neurons in VS, including those with nonsignificant modulation, 46.0% (in epoch 1, n = 57/124) and 50.81% (in epoch 2, n = 63/124) showed significantly greater firing for contralateral presentations (these biases are not significant, χ2 = 0.806 and 0.032, P = 0.3692 and 0.8575, respectively).
Similar results were observed in OFC neurons. During epoch 1, 10.62% of neurons (n = 12/113, χ2 = 7.512, P < 0.0061) showed a significant difference in responses to offer 1 depending on its position (Fig. 3F). In epoch 2, 19.47% of cells (n = 22/113) showed such a difference (χ2 = 49.804, P < 0.0001). Of the OFC neurons that showed spatial selectivity for offer side in epochs 1 and 2, 83.3% (n = 10/12) and 50.0% (n = 11/22) showed greater activity when the offer appeared on the contralateral side (the first bias is significant, χ2 = 5.33, P = 0.0209, and the other is not, χ2 = 0, P = 1). Of all the neurons in OFC, including those with nonsignificant modulation, 65.5% (in epoch 1, n = 74/113) and 48.6% (in epoch 2, n = 55/113) showed significantly greater firing for contralateral presentations (the first bias is significant, χ2 = 10.841 and 0.080, P = 0.001 and 0.7778, respectively).
Similar results were observed in dACC neurons. During epoch 1, 17.97% of neurons (n = 23/128, χ2 = 45.322, P < 0.001) showed a significant difference in responses to offer 1 depending on its position (Fig. 3H). In epoch 2, 17.19% of cells (n = 22/128) showed such a difference (χ2 = 40.026, P < 0.0001). Of the dACC neurons that showed spatial selectivity for offer side in epochs 1 and 2, 56.52% in epoch 1 (n = 13/23) and 59.09% in epoch 2 (n = 13/22) showed greater activity when the offer appeared on the contralateral side (these biases are not significant, χ2 = 0.391, P = 0.5316 and χ2 = 0.727, P = 0.3938). Of all the neurons in dACC, including those with nonsignificant modulation, 46.88% in epoch 1 (n = 60/128) and 53.91% in epoch 2 (n = 69/128) showed significantly greater firing for contralateral presentations (these biases are not significant, χ2 = 0.5 and 0.781, P = 0.4795 and 0.3768, respectively).
Similar, albeit weaker, results were observed in sgACC neurons. During epoch 1, 7.14% of neurons (n = 8/112, χ2 = 1.083, P = 0.2981) showed a significant difference in responses to offer 1 depending on its position (Fig. 3J). In epoch 2, 14.29% of cells (n = 16/112) showed such a difference (χ2 = 20.331, P < 0.0001). Of the sgACC neurons that show spatial selectivity for offer side in epochs 1 and 2, 37.5% in epoch 1 (n = 3/8) and 43.75% in epoch 2 (n = 7/16) showed greater activity when the offer appeared on the contralateral side (these biases are not significant, χ2 = 0.5, P = 0.4795 and χ2 = 0.250, P = 0.6171). Of all the neurons in sgACC, including those with nonsignificant modulation, 50.89% in epoch 1 (n = 57/112) and 48.21% in epoch 2 (n = 54/112) showed greater firing for contralateral presentations (these biases are not significant χ2 = 0.036, P = 0.8501 and χ2 = 0.143, P = 0.7055, respectively).
We used the false discovery rate approach to control for multiple comparisons across the χ2 tests used to investigate the proportion of neurons that showing significant coding for offer position (Benjamini and Hochberg 1995). This method thresholds significance so as to control the number of mistaken null rejections relative to the total number of null rejections within a particular set of analyses. In the offer period (with 2 epochs and 5 brain areas, number of tests = 10), all five regions showed position-dependent responses for at least one of the two tested epochs (vmPFC: epochs 1 and 2; VS: epoch 2; dACC: epochs 1 and 2; sgACC: epoch 2; OFC: epochs 1 and 2; all f < 0.05).
Decoding spatial selectivity for offers in our five reward areas.
The statistical tests provided so far serve as a measure of the preponderance of spatial selectivity effects in the population but only indirectly answer the key question: whether information about spatial position is available to downstream regions. If such information is available, neurons can overcome the need to bind the value information to its associated stimulus. To measure decodability, we made use of a Euclidean nearest-neighbor classifier with fivefold cross-validation (see methods). We found statistically significant decodability of offer side in all five regions (P < 0.05, permutation test). These results are summarized in the offer 1 and offer 2 columns of Table 2.
Table 2.
Results summary of decoding analysis with fivefold cross validation (see methods)
| Offer 1 | Offer 2 | Prechoice | Choice | Postchoice | Reward | |
|---|---|---|---|---|---|---|
| vmPFC | ||||||
| %Correctly classified | 744/1400 (53.1429%) | 778/1400 (55.5714%) | 857/1400 (61.2143%) | 864/1360 (63.5294%) | 884/1400 (63.1429%) | 894/1400 (63.8571%) |
| P value | 0.049 | 0.004 | < 0.001 | < 0.001 | < 0.001 | < 0.001 |
| VS | ||||||
| %Correctly classified | 750/1400 (53.5714%) | 813/1400 (58.0714%) | 845/1360 (62.1324%) | 839/1320 (63.5606%) | 822/1320 (62.2727%) | 822/1360 (60.4412%) |
| P value | 0.028 | < 0.001 | < 0.001 | < 0.001 | < 0.001 | < 0.001 |
| dACC | ||||||
| %Correctly classified | 731/1320 (55.3788%) | 716/1320 (54.2424%) | 638/960 (66.4583%) | 582/960 (60.625%) | 725/960 (75.5208%) | 655/960 (68.2292%) |
| P value | 0.004 | 0.011 | < 0.001 | < 0.001 | < 0.001 | < 0.001 |
| sgACC | ||||||
| %Correctly classified | 722/1360 (53.0882%) | 724/1360 (53.2353%) | 409/760 (53.8158%) | 444/760 (58.4211%) | 481/76 (63.2895%) | 423/760 (55.6579%) |
| P value | 0.048 | 0.001 | 0.063 | < 0.001 | < 0.001 | 0.013 |
| OFC | ||||||
| %Correctly classified | 800/1440 (55.5556%) | 834/1440 (57.9167%) | 844/1440 (58.6111%) | 790/1440 (54.8611%) | 758/1440 (52.6389%) | 739/1440 (51.3194%) |
| P value | 0.005 | < 0.001 | < 0.001 | 0.002 | 0.011 | 0.214 |
Offer 1 and offer 2 columns: decodability of offer position. Prechoice, choice, postchoice, and reward columns: decodability of chosen side. P values calculated by permutation test.
Selectivity for the side chosen after the choice is made.
We next examined neuronal selectivity for the side of monkeys' choices (i.e., saccade direction) by comparing trials with leftward and rightward saccades. Because the side on which offers appeared was fully randomized in all three tasks, this variable was uncorrelated with the offer side variable discussed above. Furthermore, these trials were matched for reward size, probability, surprise, and reward prediction error, meaning that simple comparison of left vs. right gaze shift provides a measure of side selectivity.
Figure 4A shows the responses of a single vmPFC neuron separated by leftward and rightward choice trials. In this neuron, we observed greater responses on trials with leftward saccades than on those with rightward saccades. This pattern began before the gaze shift and continued after the choice was made. Note that the small differences seen before the choice were not significant and are almost certainly spurious. Examples of similarly selective neurons for OFC, VS, dACC, and sgACC are shown in Fig. 4, C, E, G, and I, respectively.
Fig. 4.

Tuning for choice side. A: raster plot and average responses of an example vmPFC neuron to task events, separated by leftward and rightward choice trials. This neuron showed significantly greater responses on trials with contralateral saccades than on those with ipsilateral saccades. B: plot of proportion of vmPFC neurons that show a significant difference in responses to the side of the chosen offer (500-ms sliding boxcar). C: raster plot and average responses of an example VS neuron to task events, separated by leftward and rightward choice trials. This neuron showed significantly greater responses on trials with ipsilateral saccades than on those with contralateral saccades. D: plot of proportion of VS neurons that show a significant difference in responses to the side of the chosen offer (500-ms sliding boxcar). E: raster plot and average responses of an example OFC neuron to task events, separated by leftward and rightward choice trials. This neuron showed significantly greater responses on trials with ipsilateral saccades than on those with contralateral saccades. F: plot of proportion of OFC neurons that show a significant difference in responses to the side of the chosen offer (500-ms sliding boxcar). G: raster plot and average responses of an example dACC neuron to task events, separated by leftward and rightward choice trials. This neuron showed significantly greater responses on trials with contralateral saccades than on those with ipsilateral saccades. H: plot of proportion of dACC neurons that show a significant difference in responses to the side of the chosen offer (500-ms sliding boxcar). I: raster plot and average responses of an example sgACC neuron to task events, separated by leftward and rightward choice trials. This neuron showed significantly greater responses on trials with contralateral saccades than those with ipsilateral saccades. J: plot of proportion of sgACC neurons that show a significant difference in responses to the side of the chosen offer (500-ms sliding boxcar).
Across the population of vmPFC neurons, we found evidence of selectivity for the side chosen (Fig. 4B). Specifically, in the 500-ms prechoice epoch, activity in 5.12% of neurons (n = 8/156) predicted the side the monkey chose, a proportion that is no different from chance (χ2 = 0.005, P = 0.9414). In an epoch beginning immediately after the saccade, 12.18% of neurons (n = 20/156) encoded side chosen (χ2 = 20.086, P < 0.0001). By an epoch beginning 500 ms later still, 17.31% of neurons did so (n = 27/156, χ2 = 49.75, P < 0.0001), and during the first 500 ms of the next trial 10.9% did so (n = 17/156, χ2 = 11.42, P = 0.0007). This persistent coding of side chosen is similar to the persistent coding of reward size observed in vmPFC and of both reward size and side chosen in the posterior cingulate cortex (Hayden et al. 2008; Heilbronner and Hayden 2013; Strait et al. 2014). During the peak encoding epoch (late epoch), 48.14% of significantly modulated neurons (n = 13/27) showed higher firing for contraversive saccades (no significant bias, χ2 = 0.037, P = 0.8474); of the whole population, 49.35% of all neurons did (also not significant, n = 77/156; χ2 = 0.026, P = 0.8728). As above, we also used a classifier to ascertain whether the population as a whole encoded chosen side. We found chosen side was significantly decodable (P < 0.05, permutation tests) in vmPFC neurons during all choice period epochs (see “prechoice,” “choice,” “postchoice,” and “reward” columns in Table 2).
We found similar results in VS neurons (Fig. 4D). During the prechoice epoch, activity in 7.26% of neurons (n = 9/124) predicted the side the monkey would choose, a value that does not achieve significance (χ2 = 1.331, P = 0.2486). In the 500 ms immediately following choice, however, we observed a significant spatial tuning in 16.93% of neurons (n = 22/124, χ2 = 42.384, P < 0.0001). In a later epoch, one beginning 500 ms later, 8.87% of neurons showed coding, a proportion that is just barely significant (n = 11/124, χ2 = 3.912, P = 0.0480); in the first 500 ms of the next trial, a nonsignificant fraction, 8.06% did so (10/124, χ2 = 2.452, P = 0.1174). During the period of peak encoding (the early postreward period), 50% of significantly modulated neurons (n = 11/22) showed a significant contralateral enhancement (χ2 = 0, P = 1), and 52.42% of all neurons did so (n = 65/124, χ2 = 0.290, P = 0.5900). Our classifier revealed that chosen side was significantly decodable (P < 0.05, permutation tests) in VS neurons during all choice period epochs (see “prechoice,” “choice,” “postchoice,” and “reward” columns in Table 2).
We found similar results in OFC neurons (Fig. 4F). During the prechoice epoch, activity in 9.735% of neurons (n = 11/113) predicted the side the monkey would choose, meaning there was weak predictive effect (χ2 = 5.333, P = 0.0209). In the 500 ms immediately following choice, we observed a significant spatial selectivity in 23.01% of neurons (n = 26/124, χ2 = 77.154, P < 0.0001). During the late epoch, we observed significant selectivity for chosen side in 19.46% (n = 22/113, χ2 = 49.804, P < 0.0001) and during the beginning of the next trial, we observed the effect in 12.39% (n = 14/113, χ2 = 12.990, P = 0.0003). During the period of peak modulation (the immediate postchoice period), 65.39% of modulated cells showed enhanced firing for contraversive saccades (n = 17/26, χ2 = 2.462, P = 0.1167) and 54.86% of all cells did so (n = 62/113, χ2 = 1.071, P = 0.3008). Our classifier showed that chosen side was significantly decodable (P < 0.05, permutation tests) in OFC neurons during the prechoice, choice, and postchoice epochs but not in the reward epoch (see Table 2).
We found similar results in dACC neurons (Fig. 4H). During the prechoice epoch, activity in 21.09% of neurons (n = 27/128) predicted the side the monkey would choose at significantly more than chance (χ2 = 69.796, P < 0.0001). In the 500 ms immediately following choice, this proportion fell slightly to 20.31% of neurons (n = 26/128; χ2 = 63.184, P < 0.0001). In a late postchoice epoch, beginning 500 ms later, this number rose again, to 24.22% of neurons (n = 31/128; χ2=99.533, P < 0.0001); this proportion fell during the presentation of the first option in the next trial, although it remained significant (11.72% of neurons, n = 15/128; χ2 = 12.164, P = 0.0005). During the period of peak modulation (the late postchoice period), 64.52% of modulated cells showed enhanced firing for contraversive saccades (n = 20/31, χ2 = 2.613, P = 0.1060) and 53.91% of all cells did so (n = 69/128, χ2 = 0.781, P = 0.3768). Our classifier showed that chosen side was significantly decodable (P < 0.05, permutation tests) in dACC neurons during all choice period epochs (see “prechoice,” “choice,” “postchoice,” and “reward” columns in Table 2).
We found similar results in sgACC neurons (Fig. 4J). During the prechoice epoch, activity in 8.04% of neurons (n = 9/112) predicted the side the monkey would choose. This proportion did not reach significance (χ2 = 2.173, P = 0.1405). In the 500 ms immediately following choice, this proportion fell to 6.25% of neurons (n = 7/112; χ2 = 0.369, P = 0.5439). In a late postchoice epoch, beginning 500 ms later, this number rose to 16.96% of neurons (n = 19/112; χ2 = 33.752, P < 0.0001); it then dropped off, remaining significant, during the presentation of the first option in the next trial (10.71% of neurons, n = 12/112; χ2 = 7.699, P = 0.0055). Note that these later epoch findings are significant even when correcting for multiple comparisons because four epochs were tested. During the period of peak modulation (the late postchoice epoch), 73.68% of modulated cells showed enhanced firing for contraversive saccades (n = 14/19; χ2 = 4.263, P = 0.0389), and 62.50% of all cells did so (n = 70/112, χ2 = 7.000, P = 0.0082). Our classifier showed that chosen side was significantly decodable (P < 0.05, permutation tests) in sgACC neurons during the choice, postchoice, and reward epochs but only marginally so in the prechoice epoch (see Table 2).
Again, we used the false discovery rate approach to control for multiple comparisons across the above χ2 tests. In the choice period (with 4 epochs and 5 brain areas, number of tests = 20), all five regions showed position-dependent responses for at least one of the four tested epochs (i.e., prechoice, choice, postchoice, and reward; vmPFC: choice, postchoice, and reward; VS: choice; dACC: all 4 epochs; sgACC: postchoice, and reward; OFC: all 4 epochs; all f < 0.05).
Broadly uncorrelated coding formats for offered and chosen side.
Neurons in five reward areas identify offered and chosen options. Do they use the same neural codes to represent these variables? Is a neuron that shows, say, contralateral tuning for offer side is more likely to show contralateral tuning for chosen side (even if, as we report, the population as a whole generally shows no bias either way)? To investigate this question, we compared regression coefficients for offer side vs. firing rate to regression coefficients generated from chosen side vs. firing rates in the same epochs. For the chosen side regression, we used the choice epoch with strongest tuning (late postchoice for vmPFC, dACC, and sgACC, immediate postchoice for OFC and VS). To reduce bias introduced by difference in firing rates across neurons and areas, we used mean and variance normalized firing rate. For offer side we considered both epochs 1 and 2.
Across the full vmPFC population, we found no significant correlation between these coefficients in epoch 1 (R = −0.1211, P = 0.1320) or in epoch 2 (R = 0.1390, P = 0.0834). (This second number approaches but does not achieve significance, and is further from significance if we use Bonferonni correction, as we ought to, because we tested two epochs, α = 0.025.) In the VS population, we likewise observed no significant correlation between these coefficients during epoch 1 (R = 0.0185, P = 0.8388) or during epoch 2 (R = −0.1257, P = 0.1641). In the OFC population, we observed a significant positive correlation between these coefficients during epoch 1 (R = 0.2415, P = 0.0099) and no correlation for epoch 2 (R = −0.1051, P = 0.2677), indicating that the shared format may be present but is inconsistent across epochs. (Note that the effect in epoch 1 survives Bonferroni correction needed because we examined two epochs, α = 0.025). In the dACC population, we observed no correlation between these coefficients during epoch 1 (R = 0.2140, P = 0.1526). For coefficients during epoch 2, we observed a positive correlation between coefficients (R = 0.2410, P = 0.0061). The effect in epoch 2 survives Bonferroni correction. In the sgACC population, we observed no significant correlation between coefficients during epoch 1 (R = 0.1753, P = 0.0645) or epoch 2 (R = −0.0672, P = 0.4813).
These results suggest that neurons in general, neurons in the reward areas do not robustly use a common coding scheme to represent offered and chosen sides. Nonetheless, there is some weak evidence that OFC and dACC may use a common scheme, although the fact that we only observed it in one of two ostensibly equivalent epochs provides further evidence that the shared frameworks are not a robust feature of coding. We conclude that coding in the reward system is not particularly consistent and that choice and monitoring may be implemented with somewhat distinct neural processes. Note that, by the design of the task, offered and chosen sides are uncorrelated with each other; thus our observations are consistent with the idea that reward areas encode multiple variables important for choice because of their relevance for choice and not because they have a native spatial tuning (cf. Wilson et al. 2014).
No evidence for separate populations of value and spatial neurons.
If reward areas simultaneously encode reward and spatial information, it is natural to wonder whether it is the same set of neurons doing both jobs. Figure 5 shows the responses of an example OFC neuron, separated by both offer value and offer side. This neuron's firing rate was significantly affected by both offer 1 value and its side of presentation during both offer 1 presentation and the choice epoch (P < 0.05, linear regression; see Table 3 for summary statistics of offer/side conjunctive coding). One straightforward way to test if neurons in these areas tend to be sensitive to both value and spatial information rather than one or the other is to determine whether there is a positive correlation between the regression coefficients for spatial position and those for reward value (gamble expected value in juice or tokens). Because the sign of spatial selectivity is not meaningfully related to the sign of reward tuning, we used the absolute value of all coefficients, thereby focusing on the strength of encoding. We used mean and variance normalized firing rates in all cases to reduce the chance of spurious positive correlations due to variance in firing rates across neurons.
Fig. 5.
Raster plot and average responses (±1 SE in firing rate) of an example OFC neuron to task events, separated by offer 1 side and offer 1 expected value. This neuron responded to both the value of offer 1 and its side of presentation.
Table 3.
The number of cells encoding offer value and offer position in vmPFC, VS, dACC, sgACC, and OFC
|
Epoch 1 |
Epoch 2 |
Epoch 3 |
|||||||
|---|---|---|---|---|---|---|---|---|---|
| Area | Side | Value | Both | Side | Value | Both | Side | Value | Both |
| Value of offer 1 and side of offer 1 | |||||||||
| vmPFC | 5 | 5 | 0 | 3 | 9 | 0 | 5 | 27 | 3 |
| VS | 2 | 3 | 0 | 6 | 3 | 0 | 7 | 23 | 2 |
| dACC | 21 | 12 | 0 | 20 | 7 | 1 | 12 | 3 | 0 |
| sgACC | 9 | 6 | 0 | 17 | 5 | 0 | 7 | 9 | 0 |
| OFC | 12 | 24 | 3 | 16 | 19 | 2 | 10 | 15 | 0 |
| Value of chosen offer and side of chosen offer | |||||||||
| vmPFC | 8 | 6 | 0 | 11 | 10 | 0 | 6 | 14 | 1 |
| VS | 7 | 5 | 0 | 6 | 6 | 0 | 8 | 16 | 1 |
| dACC | 12 | 10 | 1 | 21 | 6 | 0 | 11 | 9 | 1 |
| sgACC | 12 | 6 | 0 | 11 | 3 | 0 | 11 | 8 | 1 |
| OFC | 12 | 16 | 1 | 10 | 16 | 1 | 18 | 17 | 3 |
Number of cells encoding offer value and offer position in vmPFC (156 cells), VS (124 cells), dACC (128 cells), sgACC (112 cells), and OFC (113 cells).
A negative correlation between regression coefficients for offer and choice position and coefficients for reward would suggest separate value and space coding subpopulations. However, these coefficients tended to be either positively correlated or uncorrelated but never significantly negatively correlated in these five brain areas. Across the full vmPFC population, these correlation coefficients were 0.1783, −0.0595, and 0.1128 in epochs 1, 2, and 3, respectively (P = 0.0260 for epoch 1, P = 0.4604 for epoch 2, and P = 0.1610 in epoch 3). In the VS population, these correlation coefficients were 0.1574, 0.1409, and 0.0203 (P = 0.0809, P = 0.1186, and P = 0.8226, respectively). In the OFC population, the correlation coefficients were 0.2631, 0.1077, and 0.0230, respectively (P = 0.0049 for epoch 1, P = 0.2562 for epoch 2, and P = 0.8091 in epoch 3). In the dACC population, the correlation coefficients were 0.0117, 0.1933, and −0.1058, respectively (P = 0.8960 for epoch 1, P = 0.0288 for epoch 2, and P = 0.2345 in epoch 3). In the sgACC population, the correlation coefficients were −0.0730, 0.1068, and −0.0142 (P = 0.4443 for epoch 1, P = 0.2622 for epoch 2, and P = 0.8815 in epoch 3). Together, these results show that neurons with stronger selectivity for reward amount (for offered and received) were no less likely to be those with stronger selectivity for spatial position (for both offer and choice). In other words, it does not appear to be the case that spatially selective neurons are distinct populations from reward-sensitive neurons. Instead, reward-sensitive neurons are more likely than others to carry information about identities of the stimuli that produced those rewards.
Strength of effect.
We next asked how strong neurons' identity selectivity is relative to their reward selectivity. Because identity and reward dimensions are incommensurate, it is impossible to perform a strict quantitative comparison; however, we can get a rough qualitative sense by comparing the linear term of regressions of reward size and position against the same firing rates. For purposes of comparison across the three tasks, we normalized reward amount to the maximum available on that task.
In vmPFC, the coefficient for position of the first offer (β = 0.0040) was a bit less than half of the coefficient for its expected value (β = 0.0089, ratio of the two is 0.4494.) Note that we use medians instead of means for this and subsequent comparisons because the distribution of coefficients was strongly skewed. A similar pattern, spatial selectivity a bit less than half that of reward selectivity, was observed when using the corresponding variables in epoch 2 (spatial coefficient: β = 0.0047; reward coefficient: β = 0.0108; ratio of these coefficients: 0.4352). During the postreward epoch, the size of the spatial coefficient (β = 0.0037) was almost the same as the size of the reward coefficient (β = 0.0045, ratio = 0.8222).
The pattern was similar in VS. In epochs 1 and 2, strength of selectivity for position of the first and second offers (β = 0.0037 and β = 0.0039, respectively) was a bit less than a third the selectivity for reward amount (β = 0.0091 and β = 0.0088, respectively; ratios are 0.4060 for epoch 1 and 0.4432 for epoch 2). As in vmPFC, the corresponding values in epoch 3 were more similar (β = 0.0040 for chosen side and β = 0.0046 for obtained reward, ratio = 0.8696).
In OFC, strength of selectivity for position in epoch 1 (β = 0.0053) was about two-thirds the reward selectivity strength (β = 0.0080; ratio: 0.6625). For epoch 2, these strengths (β = 0.0073 and β = 0.0129, respectively) were similar albeit a bit lower (ratio: 0.5659). In epoch 3, selectivity for spatial position (β = 0.0083) was a bit greater than strength of selectivity for reward value (β = 0.0069; ratio: 1.2029).
In dACC, strength of the regression coefficient for offer position (β=0.024053) was about half of that observed for reward amount (β = 0.045336; ratio: 0.5305) in epoch 1. A higher ratio was observed in epoch 2 (β = 0.021699 and β = 0.029674, respectively; ratio: 0.7312). The corresponding value for chosen side (β = 0.024199) was almost the same as that observed for reward obtained (β = 0.024998; ratio: 0.9680).
Finally, in sgACC, strength of the regression coefficient for offer position in epoch 1 (β = 0.019585) was over half of that observed for reward amount (β = 0.03431; ratio = 0.5708). A higher ratio between position and reward coefficients was observed for epoch 2 (β = 0.019031 and β = 0.03351, respectively; ratio: 0.5679). The position coefficient in epoch 3 was even higher than the reward coefficient (β = 0.025563 and β = 0.018203, respectively; ratio: 1.4043).
Little evidence of differences in position signal latency and strength between regions.
We next compared the latency after offer presentation of value and position signals across these areas. For each area we calculated the first 500-ms bin (calculated in a sliding fashion across the whole trial every 20 ms; n bins = 575) during which a significant proportion of the population encoded side or value information. VS, OFC, dACC, and sgACC cells began signaling the side of offer 1 almost immediately after offer 1 presentation (the first bin where P < 0.05 for the χ2 on the %cells with P < 0.05 for the correlation between spikes and the side of offer 1, coded left = 1, right = 0). Significant coding in these areas began showing up in bins starting 220 ms (VS), 320 ms (OFC), 180 ms (dACC), and 140 ms (sgACC) before offer 1 presentation (note that this is not evidence of a prepotent response, rather a side effect of forward-facing bins). vmPFC cells soon followed, reaching a significant proportion of cells 420 ms after offer 1 presentation.
We then tested each brain area pair for a significant difference in the latencies calculated above with a permutation test. That is, we shuffled the percentage of cells modulated numbers across all bins 1,000 separate times, calculating a latency difference as above in each case. We asked for which area pairings the true latency difference in offer 1 side coding was above the 95th percentile of the shuffled latency differences, which would imply that the true latency difference was significant at P < 0.05. Even without correction for multiple comparisons, none of the 10 tested brain area pairings showed a significant difference in offer 1 side coding latency.
To compare the strength of offer 1 side signals, we considered each area's maximum proportion of modulated cells (the maximum proportion across all 500-ms bins calculated above). Calculated within 500-ms bins across the whole trial, as many as 10.26% (16/156) of vmPFC cells, 12.90% (16/124) of VS cells, 23.89% (27/113) of OFC cells, 23.44% (30/128) of dACC cells, and 16.96% (19/112) of sgACC cells signaled the side of offer 1. We used pairwise χ2 tests to investigate whether any pair of areas showed a significant difference between these maximum proportions. Only the difference between vmPFC maximum involvement (10.26%) and OFC maximum involvement (23.89%) was significant at the Bonferroni-corrected threshold of P < 0.005 (χ2 = 9.57, P < 0.001).
We then reran the analyses from the prior three paragraphs to look at the latency and strength of chosen offer side signals in these brain areas. Cells from all five areas began signaling the side of the chosen offer almost immediately after offer 1 presentation. Significant coding began showing up in bins starting 60 ms (vmPFC), 220 ms (VS), 0 ms (OFC), 260 ms (dACC), and 60 ms (sgACC) before offer 1 presentation. Note that this is not evidence of a prepotent response, rather a consequence of our forward-facing binning procedure. Nonetheless, this result indicates that there is some information about the decision in all these areas within 500 ms of offer 1 presentation and before offer 2 presentation.
Again, we tested each brain area pair for a significant difference in the chosen offer side signal latencies calculated above with a permutation test. With each area's signal latency within 260 ms of that of the other areas, we again found no significant differences in signal latency between any area pairing (all P > 0.05).
As many as 21.15% (33/156) of vmPFC cells, 16.13% (20/124) of VS cells, 26.55% (30/113) of OFC cells, 19.53% (25/128) of dACC cells, and 15.18% (17/112) of sgACC cells signaled the side of the chosen offer. We again used pairwise χ2 tests to investigate whether any pair of areas showed a significant difference between these maximum proportions. We found no pairwise differences in maximum proportion of cells modulated significant at the Bonferroni-corrected threshold of P < 0.005.
DISCUSSION
We found that neuronal activity in five reward regions (vmPFC, VS, OFC, dACC, and sgACC) is selective for the spatial position in which an offer appeared and for the direction of the saccade used to select it. This information is sufficient to identify options and suggests that identity information is maintained throughout the computations that constitute reward-based choice. Indeed, information about rewards and identity was not mediated by separate populations of neurons but was instead a property of a single group of task-responsive cells. Some accounts of the neural mechanisms of reward-based choice hold that values are represented and compared in an abstract format, meaning they are anatomically distinct from identifying information (Montague and Berns 2002; Platt and Padoa-Schioppa 2008; Padoa-Schioppa 2011; Levy and Glimcher 2012; Rangel and Clithero 2014). Such a scheme introduces an unavoidable binding problem: the brain must somehow link value to item identity (Walton et al. 2010; Lee et al. 2012). Maintaining information about identity throughout the reward system may circumvent this problem.
Why has previous work not detected these patterns? We suspect four distinct factors are at play. First, signals are intermixed at the neuron level, so they may be difficult to detect using aggregate measures like fMRI, PET, and lesion studies. Second, choice tasks almost exclusively present offers simultaneously, and thus could not, even in theory, detect spatial selectivity for offer positions. Third, neuronal selectivity for choice has been widely observed, but is often strongest after the trial, so that it is not observed in studies that focus on choice-time activity. Finally, our task was more difficult than those used in many other studies, which likely increases representation. Specifically, stimuli differed along multiple dimensions and their values had to be computed, rather than simply retrieved from memory.
Given our methods, we were unable to determine why neurons in these brain areas show selectivity for spatial position. For example, we could not ascertain whether the signals serve to represent spatial position abstractly or whether they reflected covert attention, overt gaze position, motor intention or planning, or any of the other factors that are often linked to spatial selectivity. In particular, one major limitation of our study is that we did not have access to detailed measures of eye position, meaning that subtle difference in gaze pattern for left and right saccades could in theory influence our data. Despite these limitations, the central result we describe, a consistent relationship between firing and information that can tag individual stimuli, remains. Indeed, it is not clear that some of these factors (e.g., attention and intention) are conceptually separable anywhere in the brain. Instead, what we showed is that some aspect of the world aside from value was extractable from the firing rates of these neurons. That means that this information is available for downstream decoders. If the information reflects attention, or gaze position, for example, it may be that these processes are a mechanism the brain uses to preserve information about object identity.
We do not believe that neurons in the reward system are spatially tuned, at least not in the sense that neurons in the visual system are. Indeed, the effects we observe here appear to differ qualitatively from classical spatial tuning. First, there was little or weak anatomical organization to these responses: ipsilateral and contralateral selective neurons were intercalated. Second, selectivity for offer and choice side were, for the most part, uncorrelated within neurons, meaning a neuron that was contralaterally tuned for offers was no more likely to be contraversively tuned for choices. Thus selectivity likely does not reflect native spatial tuning but instead indicates positions of offers and choices as two of a much larger set of task variables that are worth tracking (Wilson et al. 2014). Since offer position and choice are uncorrelated in practice, the reward system appears to make no effort to correlate them in its responses.
In any case, our measures were limited to two positions and two stimuli and thus cannot distinguish between spatial tuning and object-specific tuning, that is, responses that are spatially selective only because the objects are located in different spatial positions (Rangel and Hare 2010; Padoa-Schioppa and Cai 2011). One way to distinguish these coding schemes would be to ascertain whether an individual neuron continues to use the same coding scheme across different recording sessions or for very different tasks. Given that many neurons in our samples did not use the same schemes for offered and received rewards, we would expect that spatial selectivity would be poorly conserved across sessions or tasks.
We speculate that the selectivity we observe in these five areas may facilitate selection of options and monitoring the consequences of those options. In other words, they mitigate the binding problem for rewards and objects they are associated with. The binding problem is not unique to economic choice, of course: much more famous is the problem of linking different aspects of stimuli into a coherent whole, known as the perceptual binding problem (Singer 1994; Roskies 1999; Shadlen and Movshon 1999; Engel et al. 2001). In principle, both binding problems can be overcome in several ways, including synchronous oscillations and spike-field coherence. Another solution, which our data endorse, is to maintain a “tag” to the associated option in reward-sensitive neurons by preserving some object-specific selectivity (Lennie 1998; Ghose and Maunsell 1999; Riesenhuber and Poggio 1999; Shadlen and Movshon 1999).
GRANTS
This research was supported by a National Science Foundation CAREER Award, National Alliance for Research on Schizophrenia and Depression Young Investigator Award, and a National Institute on Drug Abuse Grant R01-DA-038106 (to B. Y. Hayden).
DISCLOSURES
No conflicts of interest, financial or otherwise, are declared by the author(s).
AUTHOR CONTRIBUTIONS
Author contributions: C.E.S., T.C.B., and B.Y.H. conception and design of research; C.E.S., B.J.S., T.C.B., and M.D.C. performed experiments; C.E.S., T.C.B., and H.A. analyzed data; C.E.S. and B.Y.H. interpreted results of experiments; C.E.S. prepared figures; C.E.S., B.J.S., T.C.B., H.A., M.D.C., and B.Y.H. edited and revised manuscript; B.Y.H. drafted manuscript.
ACKNOWLEDGMENTS
We thank Aaron Roth and Marc Mancarella for assistance in data collection and Nathaniel Daw for math help.
REFERENCES
- Abe H, Lee D. Distributed coding of actual and hypothetical outcomes in the orbital and dorsolateral prefrontal cortex. Neuron 70: 731–741, 2011. [DOI] [PMC free article] [PubMed] [Google Scholar]
- Amemori K, Graybiel AM. Localized microstimulation of primate pregenual cingulate cortex induces negative decision-making. Nat Neurosci 15: 776–785, 2012. [DOI] [PMC free article] [PubMed] [Google Scholar]
- Bartra O, McGuire JT, Kable JW. The valuation system: a coordinate-based meta-analysis of BOLD fMRI experiments examining neural correlates of subjective value. Neuroimage 76: 412–427, 2013. [DOI] [PMC free article] [PubMed] [Google Scholar]
- Benjamini Y, Hochberg Y. Controlling the false discovery rate: a practical and powerful approach to multiple testing. J R Stat Soc 57: 289–300, 1995. [Google Scholar]
- Blanchard TC, Hayden BY, Bromberg-Martin ES. Orbitofrontal cortex uses distinct codes for different choice attributes in decisions motivated by curiosity. Neuron 85: 602–614, 2015. [DOI] [PMC free article] [PubMed] [Google Scholar]
- Blanchard TC, Pearson JM, Hayden BY. Postreward delays and systematic biases in measures of animal temporal discounting. Proc Natl Acad Sci USA 110: 15491–15496, 2013. [DOI] [PMC free article] [PubMed] [Google Scholar]
- Blanchard TC, Hayden BY. Neurons in dorsal anterior cingulate cortex signal postdeicisonal variables in a foraging task. J Neurosci 32: 646–655, 2014. [DOI] [PMC free article] [PubMed] [Google Scholar]
- Bryden DW, Roesch MR. Executive control signals in orbitofrontal cortex during response inhibition. J Neurosci 35: 3903–3914, 2015. [DOI] [PMC free article] [PubMed] [Google Scholar]
- Cai X, Padoa-Schioppa C. Neuronal encoding of subjective value in dorsal and ventral anterior cingulate cortex. J Neurosci 32: 3791–3808, 2012. [DOI] [PMC free article] [PubMed] [Google Scholar]
- Dean HL, Crowley JC, Platt ML. Visual and saccade-related activity in macaque posterior cingulate cortex. J Neurophysiol 92: 3056–3068, 2004. [DOI] [PubMed] [Google Scholar]
- Engel AK, Fries P, Singer W. Dynamic predictions: oscillations and synchrony in top-down processing. Nat Rev Neurosci 2: 704–716, 2001. [DOI] [PubMed] [Google Scholar]
- Ghose GM, Maunsell J. Specialized representations in visual cortex: a role for binding? Neuron 24: 79–85, 111–125, 1999. [DOI] [PubMed] [Google Scholar]
- Hare TA, Schultz W, Camerer CF, O'Doherty JP, Rangel A. Transformation of stimulus value signals into motor commands during simple choice. Proc Natl Acad Sci USA 108: 18120–18125, 2011. [DOI] [PMC free article] [PubMed] [Google Scholar]
- Hayden BY, Nair AC, McCoy AN, Platt ML. Posterior cingulate cortex mediates outcome-contingent allocation of behavior. Neuron 60: 19–25, 2008. [DOI] [PMC free article] [PubMed] [Google Scholar]
- Hayden BY, Heilbronner SR, Pearson JM, Platt ML. Surprise signals in anterior cingulate cortex: neuronal encoding of unsigned reward prediction errors driving adjustment in behavior. J Neurosci 31: 4178–4187, 2011. [DOI] [PMC free article] [PubMed] [Google Scholar]
- Heekeren HR, Marrett S, Bandettini PA, Ungerleider LG. A general mechanism for perceptual decision-making in the human brain. Nature 431: 859–862, 2004. [DOI] [PubMed] [Google Scholar]
- Heekeren HR, Marrett S, Ungerleider LG. The neural systems that mediate human perceptual decision making. Nat Rev Neurosci 9: 467–479, 2008. [DOI] [PubMed] [Google Scholar]
- Heilbronner SR, Hayden BY. Contextual factors explain risk-seeking preferences in rhesus monkeys. Front Neurosci 7: 7, 2013. [DOI] [PMC free article] [PubMed] [Google Scholar]
- Heilbronner SR, Platt ML. Causal evidence of performance monitoring by neurons in posterior cingulate cortex during learning. Neuron 80: 1384–1391, 2013. [DOI] [PMC free article] [PubMed] [Google Scholar]
- Hunt LT, Kolling N, Soltani A, Woolrich MW, Rushworth MF, Behrens TE. Mechanisms underlying cortical activity during value-guided choice. Nat Neurosci 15: 470–476, S471–S473, 2012. [DOI] [PMC free article] [PubMed] [Google Scholar]
- Kable JW, Glimcher PW. The neurobiology of decision: consensus and controversy. Neuron 63: 733–745, 2009. [DOI] [PMC free article] [PubMed] [Google Scholar]
- Kim JN, Shadlen MN. Neural correlates of a decision in the dorsolateral prefrontal cortex of the macaque. Nat Neurosci 2: 176–185, 1999. [DOI] [PubMed] [Google Scholar]
- Lee D, Seo H, Jung MW. Neural basis of reinforcement learning and decision making. Annu Rev Neurosci 35: 287–308, 2012. [DOI] [PMC free article] [PubMed] [Google Scholar]
- Lennie P. Single units and visual cortical organization. Perception 27: 889–935, 1998. [DOI] [PubMed] [Google Scholar]
- Levy DJ, Glimcher PW. The root of all value: a neural common currency for choice. Curr Opin Neurobiol 22: 1027–1038, 2012. [DOI] [PMC free article] [PubMed] [Google Scholar]
- Lim SL, O'Doherty JP, Rangel A. The decision value computations in the vmPFC and striatum use a relative value code that is guided by visual attention. J Neurosci 31: 13214–13223, 2011. [DOI] [PMC free article] [PubMed] [Google Scholar]
- Luk CH, Wallis JD. Choice coding in frontal cortex during stimulus-guided or action-guided decision-making. J Neurosci 33: 1864–1871, 2013. [DOI] [PMC free article] [PubMed] [Google Scholar]
- Monosov IE, Hikosaka O. Regionally distinct processing of rewards and punishments by the primate ventromedial prefrontal cortex. J Neurosci 32: 10318–10330, 2012. [DOI] [PMC free article] [PubMed] [Google Scholar]
- Montague PR, Berns GS. Neural economics and the biological substrates of valuation. Neuron 36: 265–284, 2002. [DOI] [PubMed] [Google Scholar]
- Ongur D, Price JL. The organization of networks within the orbital and medial prefrontal cortex of rats, monkeys and humans. Cereb Cortex 10: 206–219, 2000. [DOI] [PubMed] [Google Scholar]
- Padoa-Schioppa C. Neurobiology of economic choice: a good-based model. Annu Rev Neurosci 34: 333–359, 2011. [DOI] [PMC free article] [PubMed] [Google Scholar]
- Padoa-Schioppa C, Assad JA. Neurons in the orbitofrontal cortex encode economic value. Nature 441: 223–226, 2006. [DOI] [PMC free article] [PubMed] [Google Scholar]
- Padoa-Schioppa C, Cai X. The orbitofrontal cortex and the computation of subjective value: consolidated concepts and new perspectives. Ann NY Acad Sci 1239: 130–137, 2011. [DOI] [PMC free article] [PubMed] [Google Scholar]
- Pearson JM, Hayden BY, Platt ML. Explicit information reduces discounting behavior in monkeys. Front Psychol 1: 237, 2010. [DOI] [PMC free article] [PubMed] [Google Scholar]
- Peck CJ, Lau B, Salzman CD. The primate amygdala combines information about space and value. Nat Neurosci 16: 340–348, 2013. [DOI] [PMC free article] [PubMed] [Google Scholar]
- Platt ML, Padoa-Schioppa C. Neuronal representations of value. In: Neuroeconomics: Decision Making and the Brain, edited by Glimcher PW, Camerer C, Fehr E, Poldrack RA. New York: Elsevier, 2008. [Google Scholar]
- Quian Quiroga R, Snyder LH, Batista AP, Cui H, Andersen RA. Movement intention is better predicted than attention in the posterior parietal cortex. J Neurosci 26: 3615–3620, 2006. [DOI] [PMC free article] [PubMed] [Google Scholar]
- Rangel A, Hare T. Neural computations associated with goal-directed choice. Curr Opin Neurobiol 20: 262–270, 2010. [DOI] [PubMed] [Google Scholar]
- Rangel A, Clithero JA. The computation of stimulus values in simple choice. In: Neuroeconomics: Decision Making and the Brain (2nd ed.), edited by Glimcher PW and Fehr E. London; Waltham, MA; San Diego, CA: Elsevier/Academic Press, 2014, chapt. 8, p. 125–148. [Google Scholar]
- Riesenhuber M, Poggio T. Are cortical models really bound by the “binding problem”? Neuron 24: 87–93, 111–125, 1999. [DOI] [PubMed] [Google Scholar]
- Rigotti M, Barak O, Warden MR, Wang XJ, Daw ND, Miller EK, Fusi S. The importance of mixed selectivity in complex cognitive tasks. Nature 497: 585–590, 2013. [DOI] [PMC free article] [PubMed] [Google Scholar]
- Roesch MR, Taylor AR, Schoenbaum G. Encoding of time-discounted rewards in orbitofrontal cortex is independent of value representation. Neuron 51: 509–520, 2006. [DOI] [PMC free article] [PubMed] [Google Scholar]
- Rolls ET, Grabenhorst F, Deco G. Choice, difficulty, and confidence in the brain. Neuroimage 53: 694–706, 2010. [DOI] [PubMed] [Google Scholar]
- Roskies AL. The binding problem. Neuron 24: 7–9, 111–125, 1999. [DOI] [PubMed] [Google Scholar]
- Rushworth MF, Noonan MP, Boorman ED, Walton ME, Behrens TE. Frontal cortex and reward-guided learning and decision-making. Neuron 70: 1054–1069, 2011. [DOI] [PubMed] [Google Scholar]
- Seo H, Lee D. Behavioral and neural changes after gains and losses of conditioned reinforcers. J Neurosci 29: 3627–3641, 2009. [DOI] [PMC free article] [PubMed] [Google Scholar]
- Shadlen MN, Movshon JA. Synchrony unbound: a critical evaluation of the temporal binding hypothesis. Neuron 24: 67–77, 111–125, 1999. [DOI] [PubMed] [Google Scholar]
- Singer W. Time as coding space in neocortical processing: a hypothesis. In: Temporal Coding in the Brain. Berlin, Germany: Springer, 1994, p. 51–79. [Google Scholar]
- Stott JJ, Redish AD. A functional difference in information processing between orbitofrontal cortex and ventral striatum during decision-making behaviour. Philos Trans R Soc Lond B Biol Sci 369: pii: 20130472, 2014. [DOI] [PMC free article] [PubMed] [Google Scholar]
- Strait CE, Hayden BY. Preference patterns for skewed gambles in rhesus monkeys. Biol Lett 9: 20130902, 2013. [DOI] [PMC free article] [PubMed] [Google Scholar]
- Strait CE, Blanchard TC, Hayden BY. Reward value comparison via mutual inhibition in ventromedial prefrontal cortex. Neuron 82: 1357–1366, 2014. [DOI] [PMC free article] [PubMed] [Google Scholar]
- Strait CE, Brianna BJ, Hayden BY. Signatures of value comparison in ventral striatum neurons. PLoS Biol 13: e1002173, 2015. [DOI] [PMC free article] [PubMed] [Google Scholar]
- Tsujimoto S, Genovesio A, Wise SP. Monkey orbitofrontal cortex encodes response choices near feedback time. J Neurosci 29: 2569–2574, 2009. [DOI] [PMC free article] [PubMed] [Google Scholar]
- Tsujimoto S, Genovesio A, Wise SP. Evaluating self-generated decisions in frontal pole cortex of monkeys. Nat Neurosci 13: 120–126, 2010. [DOI] [PMC free article] [PubMed] [Google Scholar]
- Walton ME, Behrens TE, Buckley MJ, Rudebeck PH, Rushworth MF. Separable learning systems in the macaque brain and the role of orbitofrontal cortex in contingent learning. Neuron 65: 927–939, 2010. [DOI] [PMC free article] [PubMed] [Google Scholar]
- Wilson RC, Takahashi YK, Schoenbaum G, Niv Y. Orbitofrontal cortex as a cognitive map of task space. Neuron 81: 267–279, 2014. [DOI] [PMC free article] [PubMed] [Google Scholar]