

Abstract
Motor imagery (MI) is the mental simulation of movement, without the corresponding muscle contraction. Whereas the activation of cortical motor areas during MI is established, the involvement of spinal structures is still under debate. We used original and complementary techniques to probe the influence of MI on spinal structures. Amplitude of motor-evoked potentials (MEPs), cervico-medullary-evoked potentials (CMEPs), and Hoffmann (H)-reflexes of the flexor carpi radialis (FCR) muscle and of the triceps surae muscles was measured in young, healthy subjects at rest and during MI. Participants were asked to imagine maximal voluntary contraction of the wrist and ankle, while the targeted limb was fixed (static condition). We confirmed previous studies with an increase of FCR MEPs during MI compared with rest. Interestingly, CMEPs, but not H-reflexes, also increased during MI, revealing a possible activation of subcortical structures. Then, to investigate the effect of MI on the spinal network, we used two techniques: 1) passive lengthening of the targeted muscle via an isokinetic dynamometer and 2) conditioning of H-reflexes with stimulation of the antagonistic nerve. Both techniques activate spinal inhibitory presynaptic circuitry, reducing the H-reflex amplitude at rest. In contrast, no reduction of H-reflex amplitude was observed during MI. These findings suggest that MI has modulatory effects on the spinal neuronal network. Specifically, the activation of low-threshold spinal structures during specific conditions (lengthening and H-reflex conditioning) highlights the possible generation of subliminal cortical output during MI.
Keywords: H-reflex, motor-evoked potential, cervico-medullar-evoked potential, transcranial magnetic stimulation, muscle lengthening, presynaptic inhibition
during the past three decades, evidence has emerged, suggesting that mental training can improve motor performance (Lebon et al. 2010), thus promoting its interest for neuro-rehabilitation programs [for review, see Malouin et al. (2013)]. Mental training with motor imagery (MI) involves the internal simulation of movements without corresponding motor output (Jeannerod 2001). Numerous investigations have revealed that similar cortical areas, particularly motor areas, were activated during actual and imagined movements (Decety et al. 1994; Lotze et al. 1999; Roth et al. 1996). Transcranial magnetic stimulation (TMS) studies provided evidence of corticospinal modulations during MI [for review, see Grosprêtre et al. (2015)]. This activation was classically expressed in the literature by an increase in amplitude of motor-evoked potentials (MEPs) recorded in the muscle involved in the imagined action (Liang et al. 2008; Rozand et al. 2014; Stinear and Byblow 2003b).
However, findings from previous studies have not provided evidence on whether the MI-induced modulation occurs at cortical, subcortical, and/or spinal levels. Some authors found a facilitation of the Hoffmann (H)-reflex amplitude, an index of spinal excitability, elicited by peripheral nerve stimulation (PNS) during MI compared with rest (Bonnet et al. 1997; Cowley et al. 2008). On the contrary, others showed a decrease of H-reflex (Oishi et al. 1994) or did not find any effect (Yahagi et al. 1996). These inconsistencies may arise from different methodologies used to assess reflex excitability, different imagined tasks, or particular sensitivity of spinal structures (interneurons, motoneurons, etc.). For example, the different modulation of H-reflex observed during MI might be related to various parameters, such as the intensity of PNS, the intensity of the mental simulation, or the normalization of H-reflex.
Today, the question of the release of a potential cortical output elaborated during MI remains open (Guillot et al. 2012). Does this motor output reach the spinal level, therefore implying cortical and spinal interactions, or is it the product of supraspinal processes solely? In particular, the neural simulation theory of Jeannerod (2001) supports the first assumption, stipulating that during MI, the inhibition of the motor output would be incomplete and would activate subliminally the descending tracks. In this case, such activation may reach the spinal network and may potentially modulate the activity of the most excitable neural structures, such as interneurons.
This study aimed to bring new insights to the interaction between cortical and spinal networks during MI, by applying stimulations at different levels of the corticospinal tract. TMS was used to probe corticospinal excitability. Cervico-medullar stimulation and PNS were used to investigate spinal excitability. Cervico-medullar-evoked potentials (CMEPs) and H-reflexes can provide different insights into spinal excitability, as they are not influenced by the same circuitry (Taylor 2006). Indeed, cortico-motoneuronal synapse is not subjected to presynaptic inhibition, contrary to Ia-alpha synapse, which means that the amplitude of CMEP can be modulated without changes of the H-reflex, and conversely. The comparison of muscle responses with these noninvasive stimulations provides the means to examine the functioning of the corticospinal pathway at the segmental level during MI. We also used original techniques to assess the activity of spinal structures with a lower excitability threshold than motoneurons during MI. We investigated the interaction between motor responses (MEPs and H-reflexes) and sensory feedbacks induced by passive muscle lengthening [such as used by Duclay et al. (2011) and Pinniger et al. (2001) during actual contraction] and by a conditioning maneuver [method used by Achache et al. (2010)] when participants imagined muscle contractions. We hypothesized that MI may elicit a subliminal cortical output that would reach the spinal network and modulate the excitability of low-threshold spinal structures, such as presynaptic interneurons. Due to the methodological constraints, we measured motor responses in both upper and lower limbs [flexor carpi radialis (FCR) and triceps surae (TS) muscles].
MATERIALS AND METHODS
Participants.
Twelve young, healthy, right-handed men volunteered to participate in this study (age: 23.8 ± 1.08 yr old; height: 1.76 ± 0.02 m; weight: 71.13 ± 2.93 kg). None of them reported neurological or physical disorders. They gave informed consent, after being fully informed about the investigation and the possible related risks and discomfort. All experimental procedures were performed in accordance with the Declaration of Helsinki and were approved by the Regional Ethics Committee.
The tests were carried out in four experimental sessions, separated by at least 3 days. All participants (n = 12) took part in FCR experiments in sessions 1 and 3. Among them, 4 performed the session 2, and 10 performed the experiments with TS recordings in sessions 3 and 4. Table 1 depicts a simplified overview of the entire protocol (number of subjects, recorded parameters, number of stimulations per parameter, etc.). Stimulation and MI techniques are depicted in Fig. 1 and detailed in the following sections.
Table 1.
Overview of the experimental design with number of stimulations per measure
| Static Condition |
Static Condition |
Passive Shortening |
|||||||||
|---|---|---|---|---|---|---|---|---|---|---|---|
| Unmatched |
Passive Lengthening |
Rest Matched with Lengthening |
Rest Matched with Lengthening |
||||||||
| Muscle | n | Parameter | Rest | MI | Rest | MI | Rest | MI | Rest | MI | |
| Session 1 | FCR | 12 | MEP | 12 | 12 | ||||||
| Mmax | 4 | 4 | |||||||||
| Session 2 | FCR | 4 | CMEP | 8 | 8 | ||||||
| Mmax | 4 | 4 | |||||||||
| Session 3 | FCR | 12 | MEP | 12 | 12 | 12 | 12 | 12 | 12 | ||
| H-reflex | 12 | 12 | 12 | 12 | 12 | 12 | 12 | 12 | |||
| Mmax | 4 | 4 | 4 | 4 | 4 | 4 | 4 | 4 | |||
| SOL | 10 | H-reflex | 12 | 12 | 12 | 12 | 12 | 12 | |||
| MG | Mmax | 4 | 4 | 4 | 4 | 4 | 4 | ||||
| LG | |||||||||||
| Session 4 | SOL | 10 | H-reflex | 12 | 12 | ||||||
| MG | Conditioned H | 12 | 12 | ||||||||
| LG | Mmax | 4 | 4 | ||||||||
Reported is the number of evoked responses by condition in each subject. The number of subjects by session is indicated in column 3 (n). MI, motor imagery; FCR, flexor carpi radialis; MEP, motor-evoked potential; Mmax, maximal M wave; CMEP, cervico-medullary-evoked potential; H-reflex, Hoffmann-reflex; SOL, soleus; MG, medial gastrocnemius; LG, lateral gastrocnemius. Unmatched responses in column 1 represent maximal response amplitudes recorded at rest in static conditions. Matched responses represent the recordings with the adjusted stimulation intensity to match similar amplitude at rest among conditions (lengthening, shortening, and static).
Fig. 1.

Graphical overview of experimental setup. The several sites of stimulations and recordings are depicted for upper-limb (A) and lower-limb (B) measurements. The lens provides further details about the circuit activated by the conditioning stimulation applied on the common peroneal nerve (MTN, motoneurons). TMS, transcranial magnetic stimulation; CMS, cervico-medullary stimulation; MNS, median nerve stimulation; emg, electromyographic; FCR, flexor carpi radialis; ECR, extensor carpi radialis; PNS, posterior tibial nerve stimulation; CPS, common peroneal nerve stimulation; SOL, soleus; TA, tibialis anterior; LG, lateral gastrocnemius; MG, medial gastrocnemius.
Briefly, this study included four experimental sessions, involving different stimulation techniques and interventions. The first session was designed to probe the corticospinal excitability during imagined wrist contractions by measuring FCR MEPs in the right forearm that was kept in a static position, i.e., without any active or passive movement. Four subjects took part in the second session, during which CMEPs were measured in FCR muscle in the same conditions as in session 1. In session 3, we measured MEPs and H-reflexes in the upper limb (FCR muscle) and H-reflexes in the lower limb (TS muscles) when participants' hand and foot were passively lengthened and shortened by an ergometer at rest and during MI. The fourth session was conducted to understand further spinal mechanisms underlying MI by conditioning TS H-reflexes. We chose to investigate presynaptic inhibition in TS muscles, as it provides constant and reliable results at rest (Aymard et al. 2000) (for further information, see below).
General experimental procedures.
Participants sat comfortably in an isokinetic dynamometer chair (Biodex, Shirley, NY). To test FCR responses in the right hand, the rotation axis of the dynamometer was aligned with the styloid process of the ulna. Participants' right hand was firmly strapped in a neutral position to a homemade accessory adapted for wrist movement recordings. The upper arm was vertical along the trunk (shoulder abduction and elevation angles at 0°) and the forearm semipronated and flexed at 90°. To test TS responses in the right leg, the rotation axis of the dynamometer was aligned with the external malleolus. Participants' right leg was placed with hip, knee, and ankle joints at 90° (0° = full extension) and foot firmly strapped to the dynamometer pedal. During all conditions, particular care was taken to avoid trunk and head rotations to maintain constant corticovestibular influences on the excitability of the motor pool (Schieppati 1987). The trunk was stabilized by two crossover shoulder harnesses, and movements of the head were reduced by a collar fastened to the headrest of the seat.
For all experiments and all types of stimulation, participants were asked to stay at rest or to imagine maximal voluntary efforts. In the flexion mode (muscle shortening), participants were instructed to imagine pressing maximally on the hand pad (for wrist MI) or on the pedal (for ankle MI) and to feel the corresponding muscle contractions (kinesthetic MI). In the extension mode (muscle lengthening), they were asked to imagine pressing on the pad with the palm side of the hand or on the pedal with the sole of the foot and to feel the kinesthetic sensation normally elicited by this contraction. The participants were instructed not to use visual MI but to feel the intensity of muscle contraction normally elicited during actual performance. A kinesthetic strategy was shown to modulate corticospinal excitability maximally (Stinear et al. 2006). Before imagined contractions, participants were allowed to perform actual movements to have a correct representation of the level of muscle contraction. If actual contractions were performed, a rest period of at least 2 min was observed to allow the electromyographic (EMG) responses to return to their baseline level before beginning the tests (Duclay and Martin 2005). Each imagined trial was preceded by two oral signals given by the experimenter: “get ready” and “go.” The three types of stimulation (cortical, cervico-medullar, and peripheral) were triggered between 2 and 3 s after the go signal. Participants were instructed to stop imagining a few seconds after the stimulation. The numbers of stimuli are depicted in Table 1. The trials, separated by at least 10 s, were assigned randomly, and each series of experiments also contained four trials without stimulation to avoid stimulation habituation or expectation.
For passive movements induced in session 3, the dynamometer provided an instantaneous recording of joint torque and position at constant angular velocity (30°/s). The range of wrist motion was 60°, from −30° (wrist extension) to +30° (wrist flexion), and the range of ankle motion was 30°, from −15° (dorsi-flexion) to +15° (plantar flexion). During passive lengthening and shortening, we automatically triggered the stimulation using the position of the dynamometer (0° angle between the wrist and the hand and 90° angle between the leg and the sole of the foot) to avoid alteration of H-reflex amplitude induced by changes in muscle length (Gerilovsky et al. 1989). At rest, the mean amplitude of the responses was matched among each condition to avoid size effect on the modulation analyzed (static, lengthening, and shortening). Indeed, passive muscle lengthening reduces corticospinal and spinal excitability (Chye et al. 2010; Howatson et al. 2011), mainly due to spinal presynaptic inhibitory mechanisms (Duclay et al. 2011). The stimulation intensity for shortening and static conditions was adjusted to match response amplitude recorded in lengthening condition. To reduce antidromic influences, we ensured in all conditions that the intensity of the H-reflex stimulation did not elicit responses beyond maximal H-reflex (Hmax) (Grosprêtre and Martin 2012), thus always lying in the ascending part of the recruitment curve [range of Hmax/maximal M wave (Mmax) ratio: 0.11–0.40].
EMG activity.
EMG was recorded from two muscles of the right forearm [FCR and extensor carpi radialis (ECR)] and from four muscles of the right leg [soleus (SOL), medial gastrocnemius (MG), lateral gastrocnemius (LG), and tibialis anterior (TA)] in experiments measuring upper- and lower-limb activity, respectively. After shaving and dry cleaning the skin with alcohol to keep low impedance (<5 kΩ), EMG signals were obtained by using two silver-chloride (AgCl) surface electrodes (8 mm diameter) placed over the belly muscle with an interelectrode center-to-center distance of 2 cm. The common reference electrode was placed in a central position between stimulation and recording sites, over the medial epicondyle of the humerus for upper-limb measurements, and between upper-gastrocnemii insertions for lower-limb measurements.
To record responses from arm muscles, electrodes were positioned over the muscle belly at one-third of the distance from the medial epicondyle and the radial styloid for FCR muscle and at one-third of the distance from the lateral epicondyle and the radial styloid for ECR muscle (Bartko and Carpenter 1976). For SOL, MG, and TA muscles, the electrodes were positioned 2 cm below the insertions of the gastrocnemii over the Achilles tendon, over the mid-belly of the muscle, and at one-third of the distance on the line between the fibula and the tip of the medial malleolus, respectively (Hermens et al. 2000).
EMG signals were amplified with a bandwidth frequency ranging from 15 Hz to 1 kHz (gain = 1,000). EMG and mechanical signals were digitized online (sampling frequency: 5 kHz) and stored for analysis with Tida software (Heka Elektronik, Lambrecht/Pfalz, Germany).
TMS (session 1).
TMS was used to elicit MEPs in FCR muscle of the right forearm. A figure-of-eight-shaped coil was positioned over the left motor cortex and connected to a stimulator (Magstim 200; Magstim, Carmarthenshire, UK). The handle was oriented toward the back of the head and laterally at a 45° angle, assumed to be approximately perpendicular to the central sulcus.
First, the optimal spot for eliciting the largest MEP in the right FCR muscle was identified, and this position was marked on the bathing cap worn by the participant. We then determined the resting motor threshold (rMT), defined as the minimal TMS intensity required to evoke MEP peak-to-peak amplitudes of ∼50 μV in the targeted muscle in 5 out of 10 consecutive trials (Kobayashi and Pascual-Leone 2003). During the main phase of the experiment, the TMS intensity was set to 120% of the participant's rMT (range from 50 to 80% of maximum stimulator output across participants; mean = 67.6 ± 2.51%). The coil was secured by using a homemade tripod with a lockable articulated arm (T&O brand; Otelo Parc d'activités des Béthunes, Cedex, France). The experimenter checked visually throughout the experiment that the coil was positioned identically for all conditions and checked MEP amplitude during rest trials. During session 1, PNS was also used to elicit Mmax to normalize MEPs (see below). Each type of stimulation was randomly elicited across rest and MI trials.
Cervico-medullary stimulation (session 2).
To assess whether a subliminal motor output reaches spinal structures during MI of wrist contractions, CMEPs were recorded in the FCR muscle at rest and during MI for four subjects in session 2. Cervico-medullary stimulation (CMS) was shown to provide a direct measurement of motoneuron excitability by eliciting a single volley in descending axons at the pyramidal decussation (Taylor 2006). CMEPs were measured in upper-limb muscles, since it is easier to obtain responses in this body part (Taylor 2006). However, the number of subjects recruited was limited and the number of stimulations restricted (see Table 1), since CMEPs can be difficult to record in some participants, due to the discomfort induced by the electrical stimulation (Taylor et al. 2002). CMSs were initially tested in eight participants. They performed a familiarization protocol and were asked to relax fully, with the EMG signal being monitored during all trials to ensure stable muscle activity. We discarded four participants who presented noise in the EMG signal due to stimulation apprehension. We also elicited PNS with optimal intensity to elicit Mmax. Trials with and without stimulation were randomly distributed.
CMS was given by placing two AgCl (2 cm diameter) electrodes over mastoid processes on either side and the cathode placed on the left. We used a DS7AH current stimulator (Digitimer, Hertfordshire, UK) to elicit 200 μs-width pulses. The rMT was individually determined as the minimal intensity to evoke a CMEP peak-to-peak amplitude of ∼50 μV in the targeted muscle. The intensity was set to 120% of the participant's rMT (mean intensity used for 120% rMT: 187.5 ± 65 mA; range: 100–250 mA).
PNS (sessions 3 and 4).
To elicit H-reflex in the targeted muscles, single rectangular pulses (1 ms width) were delivered by two electrodes connected to a Digitimer stimulator (model DS7). To evoke FCR H-reflex, two AgCl surface electrodes (8 mm diameter) were positioned in line with the median nerve, up to the cubital fossa, below biceps' muscle belly, with the cathode 2.5 cm proximal to the anode. ECR EMG activity was measured to ensure that the antagonist muscle was not activated by the stimulation. To evoke TS H-reflex, the posterior tibial nerve was stimulated via a self-adhesive cathode (8 mm diameter; Ag-AgCl) placed in the popliteal fossa and with the anode (5 × 10 cm; Compex Médical, Ecublens, Switzerland) placed over the patellar tendon. TA EMG activity was measured to ensure that the common peroneal nerve was not activated. The best stimulation site to obtain the greatest H-reflex was first located by a hand-held cathode ball electrode (0.5 cm diameter). Then, the stimulation electrode was firmly fixed with straps. The intensity of stimulation was then increased from H-reflex threshold to Mmax, with 1 mA increments. Mmax were measured and used in each experimental session and condition to normalize each evoked response.
In session 3, FCR Hmax were first measured, as they provided a sufficient associated M wave to H wave (MatH) to ensure similar stimulation conditions throughout the experiment (Grosprêtre and Martin 2012). Mean intensity was 7.1 ± 1.86 mA for FCR Hmax and 15.66 ± 2.83 mA for FCR Mmax recordings. Hmax with no MatH, called Hfree (Maffiuletti et al. 2001) or H1 (Katz and Pierrot-Deseilligny 1998), was measured in SOL (intensity range: 10–40 mA). At this intensity, PNS minimizes the risk of an antidromic collision between alpha motoneuron axon and reflex volley that could interfere with a presynaptic conditioning maneuver. This avoids misinterpretations regarding changes in spinal excitability due to presynaptic modulation (Grosprêtre and Martin 2012). We optimized the stimulation intensity for the SOL muscle, MG and LG H-reflexes being often associated with a small M wave at this intensity (MatH). However, variations of MG and LG MatH are useful to identify any changes in PNS parameters relative to methodological issues (Grosprêtre and Martin 2012).
In session 4, TS H-reflexes were conditioned by PNS of the antagonist nerve, i.e., the common peroneal nerve, to induce D1 presynaptic inhibition of Ia afferences onto alpha motoneurons (see Fig. 1). The decrease of H-reflex with such a conditioning technique is attributed to an increased excitability of primary afferent depolarization interneurons, thus reflecting an increased presynaptic inhibition of SOL Ia afference (Mizuno et al. 1971). Here, the conditioning stimulus was applied to the branch of the common peroneal nerve with two AgCl surface electrodes (8 mm diameter) placed at the upper part of the anterolateral side of the leg, distal to the caput fibulae (Forget et al. 1989). To avoid monosynaptic facilitation in SOL motoneurons by Ia afferences of peroneal muscle (Meunier et al. 1993), we carefully checked visually and by tendon palpation that the stimulation did not induce any contraction of this muscle. The conditioning stimulus was a triple pulse over the common peroneal nerve at 300 Hz (1 ms duration), with the intensity set at 120% of TA motor threshold (Achache et al. 2010). A conditioning test interval was determined for each participant by testing several intervals between 15 and 25 ms, with 1 ms steps. The interval used to obtain the greatest SOL H-reflex depression was 21 ± 1 ms, confirming previous findings of Faist et al. (1996). Conditioned and unconditioned H-reflexes were randomly elicited at rest and during imagined contractions of the TS muscles, with the ankle kept in a constant neutral position (angle: 90°).
Data analysis.
For each session and for each muscle, the peak-to-peak amplitude average of MEP, CMEP, MatH, H-reflex, and Mmax responses was calculated. Responses were normalized to Mmax evoked in the same condition. Thus MEP/Mmax, CMEP/Mmax, Hmax/Mmax, and MatH/Mmax were considered as dependent variables and compared between MI and rest.
In all conditions, EMG activity was quantified with root mean square (RMS) values of the raw signal over a 500-ms period before the stimulation. EMGRMS analyses ensured that no contraction was present during MI. For FCR and TS muscles, EMGRMS activity was normalized by the corresponding Mmax (RMS/Mmax). As Mmax was not recorded in ECR and TA muscles, RMS was not normalized in these muscles. The analysis of EMG signals also ensured that no background EMG activity was induced by the passive solicitations (e.g., shortening and lengthening).
Statistical analysis.
First, the normality of the data was verified by the Shapiro-Wilk test (P > 0.05) to ensure the use of classical ANOVA for parametric values.
Differences between MI and rest for RMS/Mmax, Hmax/Mmax, MatH/Mmax, Mmax, and MEP/Mmax in static conditions of sessions 1 and 3 were analyzed with Student's two-tailed paired t-tests. A nonparametric Wilcoxon test was performed for CMEP/Mmax of session 2, due to the low sample (4 subjects).
For session 3 with passive movements (FCR and TS muscles), a one-way repeated-measures ANOVA (rmANOVA), with the factor muscle action mode (shortening, lengthening, and static), was first performed to ensure that H-reflexes and MEPs at rest were similar among the conditions. Then, a two-way rmANOVA was conducted with within-subjects factor muscle action mode (passive lengthening and static and passive shortening) and task (rest and MI) for each variable (RMS/Mmax, Hmax/Mmax, MatH/Mmax, Mmax, and MEP/Mmax for FCR and TS muscles and RMS for ECR and TA muscles).
For session 4, Hmax/Mmax was submitted to a two-way rmANOVA for each calf muscle (SOL, MG, and LG), with presynaptic conditioning (with or without conditioning) and task (rest and MI) as within-subjects factors.
When a main effect or an interaction was found, a post hoc analysis was made, using an honest significant difference Tukey's test. Statistical analysis was performed using STATISTICA (8.0 version; StatSoft, Tulsa, OK). The level of significance was accepted at P < 0.05. The effect size was calculated by the partial eta-squared (ηp2) method (Levine and Hullett 2002). Pearson correlations were assessed with P obtained in the Bravais-Pearson table. All data are expressed by their means ± SD.
RESULTS
EMG activity.
Mean values of all of the recorded parameters are presented in Table 2. For each session and muscle, RMS/Mmax and M-wave amplitudes (Mmax and MatH/Mmax) were not significantly affected by task or muscle action-mode factors (all P > 0.40). For instance, no effect of the factor task was found on Mmax amplitude (FCR, F1,11 = 0.67, P = 0.43; SOL, F1,9 = 0.29, P = 0.75; MG, F1,9 = 0.73, P = 0.41; LG, F1,9 = 0.33, P = 0.72) or on RMS/Mmax (FCR, F1,11 = 0.002, P = 0.96; SOL, F1,9 = 0.49, P = 0.50; MG, F1,9 = 0.41, P = 0.54; LG, F1,9 = 0.08, P = 0.78). These results ensured that the possible modulation of motor responses (MEP, CMEP, and H-reflex) would not be attributed to muscle contractions or stimulation conditions.
Table 2.
Raw electrophysiological data at rest and during MI
| Static Condition |
Static Condition |
Passive Shortening |
||||||||
|---|---|---|---|---|---|---|---|---|---|---|
| Unmatched |
Passive Lengthening |
Rest Matched with Lengthening |
Rest Matched with Lengthening |
|||||||
| n | Rest | MI | Rest | MI | Rest | MI | Rest | MI | ||
| FCR | 12 | RMS, μV | 5.4 ± 0.3 | 5.4 ± 0.2 | 5.4 ± 0.3 | 5.5 ± 0.4 | 5.4 ± 0.3 | 5.2 ± 0.3 | 5.5 ± 0.4 | 5.2 ± 0.3 |
| MEP, mV | 0.14 ± 0.04 | 0.26 ± 0.05* | 0.11 ± 0.03 | 0.21 ± 0.04* | 0.14 ± 0.04 | 0.26 ± 0.05* | 0.14 ± 0.03 | 0.30 ± 0.07* | ||
| Hmax, mV | 0.81 ± 0.28 | 0.74 ± 0.24 | 0.20 ± 0.06 | 0.40 ± 0.14* | 0.19 ± 0.06 | 0.19 ± 0.07 | 0.24 ± 0.08 | 0.25 ± 0.13 | ||
| MatH, mV | 0.93 ± 0.31 | 0.96 ± 0.30 | 0.97 ± 0.30 | 0.83 ± 0.22 | 0.93 ± 0.31 | 0.97 ± 0.30 | 0.83 ± 0.31 | 0.77 ± 0.24 | ||
| Mmax, mV | 3.75 ± 1.50 | 3.61 ± 1.47 | 3.55 ± 1.26 | 3.59 ± 1.32 | 3.73 ± 1.47 | 3.69 ± 1.46 | 3.60 ± 1.23 | 3.84 ± 1.30 | ||
| ECR | 12 | RMS, μV | 5.2 ± 0.3 | 5.4 ± 0.2 | 5.2 ± 0.3 | 5.4 ± 0.3 | 5.2 ± 0.3 | 5.5 ± 0.4 | 5.2 ± 0.3 | 5.2 ± 0.3 |
| FCR | 4 | RMS, μV | 5.3 ± 0.4 | 5.4 ± 0.03 | ||||||
| CMEP, mV | 0.25 ± 0.04 | 0.35 ± 0.07* | ||||||||
| Mmax, mV | 3.40 ± 0.70 | 2.77 ± 0.85 | ||||||||
| SOL | 10 | RMS, μV | 5.3 ± 0.3 | 5.5 ± 0.3 | 5.4 ± 0.3 | 5.4 ± 0.3 | 5.5 ± 0.3 | 5.5 ± 0.3 | 5.4 ± 0.4 | 5.5 ± 03 |
| Hfree, mV | 3.01 ± 0.52 | 3.09 ± 0.63 | 1.51 ± 0.46 | 2.23 ± 0.54* | 1.47 ± 0.38 | 1.50 ± 0.34 | 1.48 ± 0.39 | 1.46 ± 0.41 | ||
| Mmax, mV | 6.91 ± 0.66 | 6.87 ± 0.28 | 5.59 ± 0.90 | 5.60 ± 0.90 | 5.68 ± 0.88 | 5.83 ± 0.81 | 5.74 ± 0.87 | 5.88 ± 0.89 | ||
| Conditioned H, mV | 2.53 ± 0.45 | 3.03 ± 0.55* | ||||||||
| MG | 10 | RMS, μV | 5.4 ± 0.3 | 5.5 ± 0.3 | 5.7 ± 0.4 | 5.4 ± 0.3 | 5.4 ± 0.3 | 5.4 ± 0.3 | 5.4 ± 0.4 | 5.4 ± 0.3 |
| H, mV | 0.79 ± 0.09 | 0.76 ± 0.06 | 1.64 ± 0.63 | 2.33 ± 0.74* | 1.63 ± 0.58 | 1.66 ± 0.63 | 1.58 ± 0.57 | 1.64 ± 0.59 | ||
| MatH, mV | 1.50 ± 0.50 | 1.22 ± 0.38 | 3.11 ± 0.72 | 3.16 ± 0.67 | 3.31 ± 0.76 | 3.35 ± 0.75 | 2.96 ± 0.82 | 2.61 ± 0.70 | ||
| Mmax, mV | 4.08 ± 0.49 | 3.98 ± 0.60 | 5.40 ± 0.69 | 5.16 ± 0.64 | 5.16 ± 0.58 | 5.26 ± 0.74 | 5.24 ± 0.68 | 5.77 ± 0.81 | ||
| Conditioned H, mV | 0.59 ± 0.08 | 0.74 ± 0.06* | ||||||||
| LG | 10 | RMS, μV | 5.5 ± 0.3 | 5.4 ± 0.3 | 5.5 ± 0.3 | 5.5 ± 0.3 | 5.4 ± 0.3 | 5.6 ± 0.4 | 5.5 ± 0.3 | 5.4 ± 0.3 |
| H, mV | 0.59 ± 0.08 | 0.63 ± 0.09 | 1.08 ± 0.45 | 1.77 ± 0.67* | 1.07 ± 0.38 | 1.21 ± 0.36 | 0.99 ± 0.41 | 0.92 ± 0.38 | ||
| MatH, mV | 1.54 ± 0.46 | 1.51 ± 0.29 | 3.45 ± 1.11 | 3.49 ± 1.17 | 3.48 ± 1.12 | 3.41 ± 1.12 | 3.21 ± 1.23 | 3.05 ± 1.05 | ||
| Mmax, mV | 3.91 ± 0.48 | 4.01 ± 0.71 | 5.72 ± 1.23 | 5.69 ± 1.22 | 5.74 ± 1.20 | 5.71 ± 1.22 | 5.59 ± 1.17 | 5.42 ± 1.13 | ||
| Conditioned H, mV | 0.48 ± 0.07 | 0.61 ± 0.08* | ||||||||
| TA | 10 | RMS, μV | 5.5 ± 0.3 | 5.4 ± 0.2 | 5.5 ± 0.3 | 5.4 ± 0.2 | 5.5 ± 0.3 | 5.5 ± 0.4 | 5.6 ± 0.4 | 5.3 ± 0.4 |
Significant difference with rest condition (P < 0.001). RMS, root mean square of electromyographic activity; Hmax, maximal H-reflex; MatH, associated M wave to H wave; ECR, extensor carpi radialis; Hfree, Hmax with no MatH; H, H-reflex; TA, tibialis anterior. Unmatched responses in column 1 represent maximal response amplitudes recorded at rest in static conditions. Matched responses represent the recordings with the adjusted stimulation intensity to match similar amplitude at rest among conditions (lengthening, shortening, and static).
Corticospinal, cervico-medullar, and spinal excitability in static position.
In sessions 1 and 2, when the right hand was in a static position, MI increased FCR MEP/Mmax (t11 = 3.27, P = 0.007) and FCR CMEP/Mmax (Z = 2.52, P = 0.012; range: +34.9/+206.3%) compared with rest (Fig. 2).
Fig. 2.

FCR-evoked responses during rest and motor imagery (MI). Left: means (±SD) of FCR motor-evoked potential (MEP)/maximal M wave (Mmax), cervico-medullary-evoked potential (CMEP)/Mmax, and maximal Hoffmann-reflex [H-reflex; (Hmax)]/Mmax for rest (white bars) and MI (black bars) conditions. Results of each subject are depicted over bars by open gray circles. Right: typical responses are shown for 1 representative subject (same subject depicted for MEP, CMEP, and H-reflex panels). Twelve responses are superimposed for MEPs and H-reflexes and 8 for CMEP responses. Dashed lines represent the mean peak-to-peak amplitude at rest. *P < 0.05 between rest and MI.
In contrast, no change was observed between rest and MI regarding Hmax/Mmax in the static position in session 3 (FCR, P = 0.62) and session 4 (SOL, P = 0.84; MG, P = 0.88; LG, P = 0.62; Fig. 2, bottom). This lack of modulation was not dependent on the initial rest H-reflex amplitude. In fact, during static conditions, no changes between rest and MI Hmax/Mmax were found either, when stimulus intensity was reduced (to match lengthening H-reflex) in session 3 (FCR, P = 0.99; SOL, P = 0.95; MG, P = 0.94; LG: P = 0.50).
Thus to elicit H-reflexes in each muscle, two stimulus intensities were used among the several experiments, corresponding to several points on the recruitment curve. As an example, static rest H-reflex was 3.01 ± 0.52 mV for SOL muscle (corresponding to the Hmax/Mmax ratio of 0.41 ± 0.05; see Table 2, Static Condition, Unmatched), and it was 1.47 ± 0.38 mV when re-adjusted to match amplitude in lengthening condition (corresponding to Hmax/Mmax of 0.23 ± 0.04; see Table 2, Static Condition, Rest Matched with Lengthening). To summarize, no effects of MI were found on Hmax/Mmax, whatever the intensity of stimulation.
Corticospinal and spinal excitability with passive movements.
Before performing any MI trials, we modulated the stimulus intensity to provide similar amplitudes of MEPs and H-reflexes at rest among the muscle action modes (passive lengthening, passive shortening, and static), as varying muscle length affects supraspinal and spinal responses. Thus no effect of the factor muscle action mode was found on the responses at rest for all tested muscles (MEPs: FCR, F2,22 = 0.42, P = 0.66; H-reflexes: FCR, F2,22 = 1.26, P = 0.30; SOL, F2,18 = 0.07, P = 0.93; MG, F2,18 = 0.77, P = 0.48; LG, F2,18 = 0.51, P = 0.61).
With matched responses at rest, we found that MI increased FCR MEP amplitude compared with rest (main effect of task, F1,11 = 12.61, P = 0.004, ηp2 = 0.53), independently of muscle action modes (F2,22 = 1.53, P = 0.24). As depicted in Fig. 3A, MEP/Mmax was facilitated by 71.3 ± 27.4% during passive lengthening (P = 0.006), by 59.8 ± 11.9% during passive shortening (P = 0.009), and by 56.6 ± 8.3% in a static position (P = 0.007). These results confirm ones observed in session 1 with unmatched responses.
Fig. 3.

Evoked responses during passive muscle solicitations. Responses at rest and during MI are pictured with white and black bars, respectively, during passive lengthening, static conditions, and passive shortening. Each response at rest in static and shortening condition (MEP, H-reflexes) is elicited to match lengthening value. Normalized MEPs (A) and H-reflexes (C) of FCR muscle are presented (session 1, n = 12). B: correlation between H-reflex and MEP increases during MI compared with rest in the FCR muscle during passive lengthening. Normalized H-reflexes of SOL (D), MG (E), and LG (F) muscles are presented (session 3, n = 10). *P < 0.05, ***P < 0.001.
Interestingly, H-reflex amplitude was modulated depending on the muscle solicitation. The rmANOVA revealed an interaction between the factors, task and muscle action mode, for both FCR (F2,22 = 10.11, P < 0.001, ηp2 = 0.48) and TS muscles (SOL: F2,18 = 15.19, P < 0.001, ηp2 = 0.70; MG: F2,18 = 15.7, P < 0.001, ηp2 = 0.70; LG: F2,18 = 8.96, P < 0.001, ηp2 = 0.532). During muscle lengthening, Hmax/Mmax, while imagining, was greater than those without MI (increase of 101.33 ± 77.63% for FCR, P = 0.003; 91.81 ± 34.52% for SOL, P < 0.001; 103.76 ± 27.1% for MG, P < 0.001; and 77.96 ± 20.18% for LG, P < 0.001). During muscle shortening and static conditions, Hmax/Mmax while imagining was not different from that without MI (all P > 0.83; Fig. 3). Thus MI modulated H-reflex amplitude when the targeted muscle was stretched, i.e., under specific neural solicitation of the spinal network. In addition, with the examination of the FCR-response increase during MI with muscle lengthening, the greater the H-reflex, the greater the MEP (R2 = 0.64, P < 0.05; see Fig. 3B). It can also be noticed that the slope of this relation (Fig. 3B) is close to the identity line (y = x).
Presynaptic inhibition.
We used a conditioning maneuver to identify the spinal neural mechanisms underlying MI. We compared unconditioned and conditioned H-reflex amplitude at rest and during MI. The rmANOVA revealed an interaction between presynaptic conditioning and task factors for TS muscles (SOL: F1,9 = 15.87, P = 0.003, ηp2 = 0.64; MG: F1,9 = 17.75, P = 0.002, ηp2 = 0.66; LG: F1,9 = 31.54, P = 0.003, ηp2 = 0.42). Unconditioned H-reflexes at rest and during MI were similar (all muscles, P > 0.81; Fig. 4), confirming the results of session 3 (static condition). At rest, we reduced H-reflex amplitude with the conditioning maneuver (−16.54 ± 2.53% for SOL muscle, P < 0.001; −25.44 ± 4.62% for MG muscle, P < 0.001; −19.66 ± 4.39% for LG muscle, P = 0.018). Interestingly, during MI, conditioned H/Mmax was similar to unconditioned H/Mmax (SOL: P = 0.92; MG: P = 0.92; LG: P = 0.53; Fig. 4), revealing the removal of inhibitory effects induced by the conditioning maneuver. These results showed a possible effect of MI onto the spinal interneuron network mediating presynaptic inhibition.
Fig. 4.

Impact of MI on Ia presynaptic inhibition (PSI). Conditioned and unconditioned H/Mmax are depicted for SOL, MG, and LG muscles at rest (without MI, white bars) and during MI (black bars). *P < 0.05, **P < 0.01, ***P < 0.001.
DISCUSSION
The main result of the present study demonstrates the significant effect of MI on corticospinal and spinal structures. In static conditions, corticospinal (MEP) and cervico-medullary excitabilities (CMEP), but not Ia-alpha synapse excitability (H-reflex), were facilitated during MI, suggesting a subliminal activation of the corticospinal track, insufficient to recruit alpha motoneurons. When MI was associated to a passive muscle lengthening, both MEP and H-reflex increased. In addition to a CMEP increase in static condition, these results emphasize the presence of descending volleys during MI, activating specific spinal structures. Finally, the decrease of presynaptic inhibition during MI, with the limb static, confirms that a subliminal output activates low-threshold interneurons mediating presynaptic inhibition in all participants. These findings establish, for the first time, a strong statement about the influence of MI on the corticospinal and spinal excitability.
Corticospinal modulations with MI in static condition.
First, an increase of MEPs with MI compared with rest was observed when the targeted muscle was kept in a static position. This increase, in accordance with previous reports (Li et al. 2004; Rozand et al. 2014; Stinear and Byblow 2003a), suggests that MI represents an intermediate level of activation of cortical structures between rest and voluntary contraction (Li 2007). However, this sole motor response does not provide enough information to dissociate cortical from spinal activation. In the present study, we used additional techniques (sessions 2–4) to identify further neural mechanisms underlying MI, especially at the spinal level.
When the targeted muscle was kept in a static position, no modulation of H-reflex amplitude was observed during MI. Similar results were observed at several points of the recruitment curve (ascending part), since we tested two different intensities of H-reflex (at Hmax in session 3 and at sub-Hmax in session 4). Therefore, the absence of reflex modulation during MI may not originate from the spinal saturation phenomenon (Grosprêtre and Martin 2012).
CMS provided further clues about spinal-level modulations during MI. CMEP responses are thought to represent a direct measure of the motoneuronal pool excitability by activating descending axons at the spinal decussation (Taylor 2006). In the present study, greater FCR CMEPs during MI compared with rest were observed for each of the four subjects tested. Even with the consideration of the low number of subjects tested for CMS stimulations, this original result suggests that the cortical activity generated by MI (Ehrsson et al. 2003; Porro et al. 1996) is sufficient to create a cortical output addressed to the spinal level. The two sites of stimulation activating different neural structures may explain the contrasting results between CMEP and H-reflex modulation. CMEP is the result of stimulation at the inion level and involves the synapse between descending tracks and motoneurons (Taylor 2006). H-reflex, induced by PNS, reflects the transmission efficiency of Ia-alpha motoneuron synapse (Pierrot-Deseilligny and Burke 2005). Therefore, H-reflex is more likely subjected to presynaptic inhibitory mechanisms than CMEP (Nielsen and Petersen 1994). CMEP enhancement during MI can reflect an increase in the excitability of the whole descending track, whereas unchanged H-reflex during MI rules out a potential increase of motoneuronal excitability or any postsynaptic activation. Nevertheless, the difficulty to evoke CMS in the present study, mainly attributed to stimulus discomfort, reduced the number of subjects tested. Further experiments are needed to generalize CMEP modulations during MI.
MI associated to passive movement.
To investigate further the potential impact of MI on spinal structures, the participants were instructed to imagine a contraction, while the targeted muscle was passively shortened or lengthened. First, we found that MI also increased MEP amplitudes when the targeted muscle was passively shortened and lengthened, indicating that concomitant passive movement does not alter the MI effect on corticospinal modulations.
The model of muscle lengthening is especially known to reduce H-reflex amplitude through the activation of a presynaptic inhibition mechanism of Ia afferences, whereas muscle shortening does not (Duclay and Martin 2005; Pinniger et al. 2001; Romanò and Schieppati 1987). For the first time, a facilitation of spinal excitability was found during MI, with passive muscle lengthening in upper- and lower limb-muscles, but not during passive shortening. In addition, the amount of facilitation observed on FCR H-reflexes was linearly correlated to the facilitation of FCR corticospinal responses (MEP) in the same condition (muscle lengthening). Aoyama and Kaneko (2011) already observed an increase of the stretch reflex during MI but no changes in H-reflex amplitude in static condition compared with rest, suggesting a selective effect of MI over spinal mechanisms. These changes may originate from several mechanisms, such as the following: 1) a change in neuromuscular fusimotor neuron excitability, i.e., gamma motoneurons that regulate the Ia discharge when changing muscle length; 2) a reduction of homosynaptic postactivation depression (HPAD), i.e., a depletion of neurotransmitters in the Ia-alpha synapse occurring after muscle lengthening; or 3) a decrease of presynaptic inhibition induced by primary afferent depolarization interneurons. Regarding the first hypothesis, microneurographic recordings of muscle spindle activity showed no effect of MI on gamma motoneuron activity (Gandevia et al. 1997). Therefore, the modulation of fusimotor activity may not explain the increase of H-reflex during lengthening observed in the present study. Secondly, the absence of H-reflex modulation during MI, associated to passive shortening, excludes the hypothesis of HPAD mechanisms, observed during both shortening and lengthening at rest (Nordlund et al. 2004). We tested the third hypothesis about the influence of MI on presynaptic inhibitory interneurons with a conditioning maneuver.
Effects of MI on spinal presynaptic inhibition.
We conditioned the H-reflex of tricep surae muscles with a stimulation of the antagonist nerve to induce D1 presynaptic inhibition and to assess the involvement of primary afferent depolarization interneurons during MI (Meunier and Pierrot-Deseilligny 1998). In the present study, TS H-reflexes decreased by ∼20% at rest with the leg static. Interestingly, during MI, no significant decrease of H-reflexes was observed, suggesting a removal of presynaptic inhibition. These results—with the targeted limb in a static position—emphasize those obtained with the passive lengthening model, suggesting specific modulation of the presynaptic inhibitory mechanism during MI.
Animal studies showed that corticospinal projections onto primary afferent depolarization interneurons predominantly result in a decrease of presynaptic inhibition (Lundberg and Vyklicky 1963). Thus a regulation pathway of this mechanism was suggested (Fig. 5), which is preponderant during muscle lengthening. It was previously suggested that cortical projections could modulate interneuron activity through a specific spinal mechanism (Pierrot-Deseilligny and Burke 2005). In parallel to the mechanism involved in the reduction of Ia inhibition by a subthreshold stimulation of the motor cortex (Grosprêtre et al. 2014; Rothwell et al. 1984), MI may produce a subliminal cortical output that would reach the interneuronal network at the spinal level and more precisely, presynaptic inhibitory interneurons. Indeed, we recently found that subthreshold TMS increased H-reflex amplitude during passive muscle lengthening but not during passive muscle shortening or in a static condition (Grosprêtre et al. 2014). Even though MI and TMS do not functionally engage neural mechanisms similarly, the subliminal motor outputs elicited by endogenous and exogenous cortical activation, respectively, are likely to reach the same spinal structures. For example, spinal interneurons, which are subjected to descending pathways (Chen et al. 2001), play several roles in the modulation of primary afferent discharge, such as presynaptic inhibitory or excitatory effects (Jankowska 2001). In addition, animal studies have shown that GABAergic interneurons of the spinal cord have a low electrical threshold (Daniele and MacDermott 2009). This would explain why a subthreshold cortical output and a subliminal motor command induced by TMS and MI, respectively, may activate these low-threshold structures and may be insufficient to activate the motoneuronal pool that has a higher threshold.
Fig. 5.
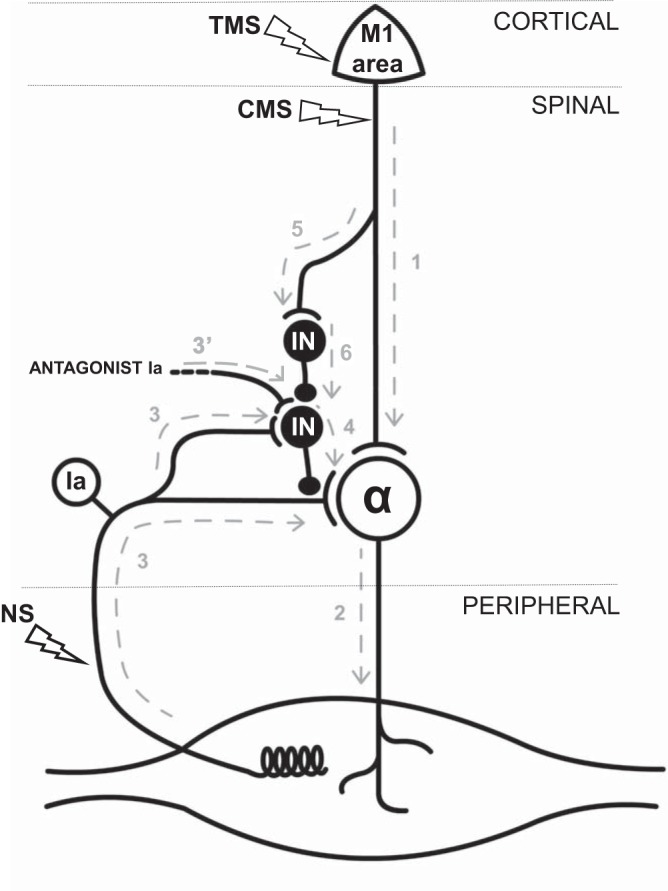
Simplified diagram of the hypothetical spinal neuron network involved during MI. The different levels of the nervous system (cortical, spinal, and peripheral) are delimited by the gray, dashed lines. The several stimulation techniques used in the present study are indicated by empty flashes: TMS, CMS, and nerve stimulation (NS). Classically, voluntary motor command directly activates the motoneuronal pool through the pyramidal tract (1 + 2) to initiate muscle contraction. MI might generate a subliminal impulse that does not induce a discharge of α-motoneurons (2). At the same time, it might activate a network of interneurons (IN; 5 + 6), with lower threshold of activation, through a parallel path. Presynaptic interneurons receive input from agonist Ia afferences (3), as well as from antagonist Ia afferences (3′). Thus during MI, cortical output may reduce the presynaptic inhibition induced by muscle lengthening (3 + 4) or antagonist Ia stimulation (3′ + 4).
Conclusion.
Neural mechanisms of MI are mainly attributed to cortical activations, without involvement of subcortical and spinal structures. Nonetheless, the neural simulation theory of Jeannerod (2001) considers the existence of a subliminal motor output generated during MI. The present study demonstrates the presence of such a response that activates low-threshold spinal structures, such as presynaptic interneurons, without modifying the excitability of alpha motoneurons. The increase of the CMEP amplitude during MI gave a first hint of descending volleys along the corticospinal tract. The modulation of the H-reflex amplitude during MI, both when passively lengthening the muscle and when conditioning the spinal response, supported the activation of presynaptic spinal interneurons when imagining. We suggest that MI activates both cortical and subcortical structures and that its impact on spinal networks depends, at least, on the excitability thresholds of the involved neuronal structures (interneurons and motoneurons).
These findings bring new insights into MI-induced neural adaptations. The enhancement of motor performance (strength gain or error decrease in motor sequence) after mental practice with MI has been mainly attributed to cortical changes (Pascual-Leone et al. 1995; Ranganathan et al. 2004). The results of the present study bring new evidence for a complementary hypothesis: in addition to neural plasticity at the cortical level, the reinforcement of synapse conductivity at the spinal level might participate in the benefits of MI practice.
GRANTS
Support for this work was provided by the Institut National de la Santé et de la Recherche Médicale (INSERM).
DISCLOSURES
No conflicts of interest, financial or otherwise, are declared by the authors.
AUTHOR CONTRIBUTIONS
Author contributions: S.G., F.L., and A.M. conception and design of research; S.G., F.L., and A.M. performed experiments; S.G., F.L., and A.M. analyzed data; S.G., F.L., C.P., and A.M. interpreted results of experiments; S.G., F.L., and A.M. prepared figures; S.G., F.L., C.P., and A.M. drafted manuscript; S.G., F.L., C.P., and A.M. edited and revised manuscript; S.G., F.L., C.P., and A.M. approved final version of manuscript.
REFERENCES
- Achache V, Roche N, Lamy JC, Boakye M, Lackmy A, Gastal A, Quentin V, Katz R. Transmission within several spinal pathways in adults with cerebral palsy. Brain 133: 1470–1483, 2010. [DOI] [PubMed] [Google Scholar]
- Aoyama T, Kaneko F. The effect of motor imagery on gain modulation of the spinal reflex. Brain Res 1372: 41–48, 2011. [DOI] [PubMed] [Google Scholar]
- Aymard C, Katz R, Lafitte C, Lo E, Pénicaud A, Pradat-Diehl P, Raoul S. Presynaptic inhibition and homosynaptic depression: a comparison between lower and upper limbs in normal human subjects and patients with hemiplegia. Brain 123: 1688–1702, 2000. [DOI] [PubMed] [Google Scholar]
- Bartko JJ, Carpenter WT. On the methods and theory of reliability. J Nerv Ment Dis 163: 307–317, 1976. [DOI] [PubMed] [Google Scholar]
- Bonnet M, Decety J, Jeannerod M, Requin J. Mental simulation of an action modulates the excitability of spinal reflex pathways in man. Brain Res Cogn Brain Res 5: 221–228, 1997. [DOI] [PubMed] [Google Scholar]
- Chen D, Theiss RD, Ebersole K, Miller JF, Rymer WZ, Heckman CJ. Spinal interneurons that receive input from muscle afferents are differentially modulated by dorsolateral descending systems. J Neurophysiol 85: 1005–1008, 2001. [DOI] [PubMed] [Google Scholar]
- Chye L, Nosaka K, Murray L, Edwards D, Thickbroom G. Corticomotor excitability of wrist flexor and extensor muscles during active and passive movement. Hum Mov Sci 29: 494–501, 2010. [DOI] [PubMed] [Google Scholar]
- Cowley PM, Clark BC, Ploutz-Snyder LL. Kinesthetic motor imagery and spinal excitability: the effect of contraction intensity and spatial localization. Clin Neurophysiol 119: 1849–1856, 2008. [DOI] [PubMed] [Google Scholar]
- Daniele CA, MacDermott AB. Low-threshold primary afferent drive onto GABAergic interneurons in the superficial dorsal horn of the mouse. J Neurosci 29: 686–695, 2009. [DOI] [PMC free article] [PubMed] [Google Scholar]
- Decety J, Perani D, Jeannerod M, Bettinardi V, Tadary B, Woods R, Mazziotta JC, Fazio F. Mapping motor representations with positron emission tomography. Nature 371: 600–602, 1994. [DOI] [PubMed] [Google Scholar]
- Duclay J, Martin A. Evoked H-reflex and V-wave responses during maximal isometric, concentric, and eccentric muscle contraction. J Neurophysiol 94: 3555–3562, 2005. [DOI] [PubMed] [Google Scholar]
- Duclay J, Pasquet B, Martin A, Duchateau J. Specific modulation of corticospinal and spinal excitabilities during maximal voluntary isometric, shortening and lengthening contractions in synergist muscles. J Physiol 589: 2901–2916, 2011. [DOI] [PMC free article] [PubMed] [Google Scholar]
- Ehrsson HH, Geyer S, Naito E. Imagery of voluntary movement of fingers, toes, and tongue activates corresponding body-part-specific motor representations. J Neurophysiol 90: 3304–3316, 2003. [DOI] [PubMed] [Google Scholar]
- Faist M, Dietz V, Pierrot-Deseilligny E. Modulation, probably presynaptic in origin, of monosynaptic Ia excitation during human gait. Exp Brain Res 109: 441–449, 1996. [DOI] [PubMed] [Google Scholar]
- Forget R, Pantieri R, Pierrot-Deseilligny E, Shindo M, Tanaka R. Facilitation of quadriceps motoneurones by group I afferents from pretibial flexors in man. 1. Possible interneuronal pathway. Exp Brain Res 78: 10–20, 1989. [DOI] [PubMed] [Google Scholar]
- Gandevia SC, Wilson LR, Inglis JT, Burke D. Mental rehearsal of motor tasks recruits alpha-motoneurones but fails to recruit human fusimotor neurones selectively. J Physiol 505: 259–266, 1997. [DOI] [PMC free article] [PubMed] [Google Scholar]
- Gerilovsky L, Tsvetinov P, Trenkova G. Peripheral effects on the amplitude of monopolar and bipolar H-reflex potentials from the soleus muscle. Exp Brain Res 76: 173–181, 1989. [DOI] [PubMed] [Google Scholar]
- Grosprêtre S, Martin A. H reflex and spinal excitability: methodological considerations. J Neurophysiol 107: 1649–1654, 2012. [DOI] [PubMed] [Google Scholar]
- Grosprêtre S, Papaxanthis C, Martin A. Modulation of spinal excitability by a sub-threshold stimulation of M1 area during muscle lengthening. Neuroscience 263: 60–71, 2014. [DOI] [PubMed] [Google Scholar]
- Grosprêtre S, Ruffino C, Lebon F. Motor imagery and cortico-spinal excitability: a review. Eur J Sport Sci 1: 1–8, 2015. [DOI] [PubMed] [Google Scholar]
- Guillot A, Di Rienzo F, Macintyre T, Moran A, Collet C. Imagining is not doing but involves specific motor commands: a review of experimental data related to motor inhibition. Front Hum Neurosci 6: 247, 2012. [DOI] [PMC free article] [PubMed] [Google Scholar]
- Hermens HJ, Freriks B, Disselhorst-Klug C, Rau G. Development of recommendations for SEMG sensors and sensor placement procedures. J Electromyogr Kinesiol 10: 361–374, 2000. [DOI] [PubMed] [Google Scholar]
- Howatson G, Taylor MB, Rider P, Motawar BR, McNally MP, Solnik S, DeVita P, Hortobágyi T. Ipsilateral motor cortical responses to TMS during lengthening and shortening of the contralateral wrist flexors. Eur J Neurosci 33: 978–990, 2011. [DOI] [PMC free article] [PubMed] [Google Scholar]
- Jankowska E. Spinal interneuronal systems: identification, multifunctional character and reconfigurations in mammals. J Physiol 533: 31–40, 2001. [DOI] [PMC free article] [PubMed] [Google Scholar]
- Jeannerod M. Neural simulation of action: a unifying mechanism for motor cognition. Neuroimage 14: S103–S109, 2001. [DOI] [PubMed] [Google Scholar]
- Katz R, Pierrot-Deseilligny E. Recurrent inhibition in humans. Prog Neurobiol 57: 325–355, 1998. [DOI] [PubMed] [Google Scholar]
- Kobayashi M, Pascual-Leone A. Transcranial magnetic stimulation in neurology. Lancet Neurol 2: 145–156, 2003. [DOI] [PubMed] [Google Scholar]
- Lebon F, Collet C, Guillot A. Benefits of motor imagery training on muscle strength. J Strength Cond Res 24: 1680–1687, 2010. [DOI] [PubMed] [Google Scholar]
- Levine TR, Hullett CR. Eta squared, partial eta squared, and misreporting of effect size in communication research. Hum Commun Res 28: 612–625, 2002. [Google Scholar]
- Li S. Movement-specific enhancement of corticospinal excitability at subthreshold levels during motor imagery. Exp Brain Res 179: 517–524, 2007. [DOI] [PMC free article] [PubMed] [Google Scholar]
- Li S, Latash ML, Zatsiorsky VM. Effects of motor imagery on finger force responses to transcranial magnetic stimulation. Brain Res Cogn Brain Res 20: 273–280, 2004. [DOI] [PubMed] [Google Scholar]
- Liang N, Murakami T, Funase K, Narita T, Kasai T. Further evidence for excitability changes in human primary motor cortex during ipsilateral voluntary contractions. Neurosci Lett 433: 135–140, 2008. [DOI] [PubMed] [Google Scholar]
- Lotze M, Montoya P, Erb M, Hülsmann E, Flor H, Klose U, Birbaumer N, Grodd W. Activation of cortical and cerebellar motor areas during executed and imagined hand movements: an fMRI study. J Cogn Neurosci 11: 491–501, 1999. [DOI] [PubMed] [Google Scholar]
- Lundberg A, Vyklicky L. Inhibitory interaction between spinal relexes to primary afferents. Experientia 19: 247–248, 1963. [DOI] [PubMed] [Google Scholar]
- Maffiuletti NA, Martin A, Babault N, Pensini M, Lucas B, Schieppati M. Electrical and mechanical H(max)-to-M(max) ratio in power- and endurance-trained athletes. J Appl Physiol 90: 3–9, 2001. [DOI] [PubMed] [Google Scholar]
- Malouin F, Jackson PL, Richards CL. Towards the integration of mental practice in rehabilitation programs. A critical review. Front Hum Neurosci 7: 576, 2013. [DOI] [PMC free article] [PubMed] [Google Scholar]
- Meunier S, Pierrot-Deseilligny E. Cortical control of presynaptic inhibition of Ia afferents in humans. Exp Brain Res 119: 415–426, 1998. [DOI] [PubMed] [Google Scholar]
- Meunier S, Pierrot-Deseilligny E, Simonetta M. Pattern of monosynaptic heteronymous Ia connections in the human lower limb. Exp Brain Res 96: 534–544, 1993. [DOI] [PubMed] [Google Scholar]
- Mizuno Y, Tanaka R, Yanagisawa N. Reciprocal group I inhibition on triceps surae motoneurons in man. J Neurophysiol 34: 1010–1017, 1971. [DOI] [PubMed] [Google Scholar]
- Nielsen J, Petersen N. Is presynaptic inhibition distributed to corticospinal fibres in man? J Physiol 477: 47–58, 1994. [DOI] [PMC free article] [PubMed] [Google Scholar]
- Nordlund MM, Thorstensson A, Cresswell AG. Conditioning Ia-afferent stimulation reduces the soleus Hoffman reflex in humans when muscle spindles are assumed to be inactive. Neurosci Lett 366: 250–253, 2004. [DOI] [PubMed] [Google Scholar]
- Oishi K, Kimura M, Yasukawa M, Yoneda T, Maeshima T. Amplitude reduction of H-reflex during mental movement simulation in elite athletes. Behav Brain Res 62: 55–61, 1994. [DOI] [PubMed] [Google Scholar]
- Pascual-Leone A, Nguyet D, Cohen LG, Brasil-Neto JP, Cammarota A, Hallett M. Modulation of muscle responses evoked by transcranial magnetic stimulation during the acquisition of new fine motor skills. J Neurophysiol 74: 1037–1045, 1995. [DOI] [PubMed] [Google Scholar]
- Pierrot-Deseilligny E, Burke D. The Circuitry of the Human Spinal Cord: Its Role in Motor Control and Movement Disorders. New York: Cambridge University Press, 2005. [Google Scholar]
- Pinniger GJ, Nordlund M, Steele JR, Cresswell AG. H-reflex modulation during passive lengthening and shortening of the human triceps surae. J Physiol 534: 913–923, 2001. [DOI] [PMC free article] [PubMed] [Google Scholar]
- Porro CA, Francescato MP, Cettolo V, Diamond ME, Baraldi P, Zuiani C, Bazzocchi M, di Prampero PE. Primary motor and sensory cortex activation during motor performance and motor imagery: a functional magnetic resonance imaging study. J Neurosci 16: 7688–7698, 1996. [DOI] [PMC free article] [PubMed] [Google Scholar]
- Ranganathan VK, Siemionow V, Liu JZ, Sahgal V, Yue GH. From mental power to muscle power-gaining strength by using the mind. Neuropsychologia 42: 944–956, 2004. [DOI] [PubMed] [Google Scholar]
- Romanò C, Schieppati M. Reflex excitability of human soleus motoneurones during voluntary shortening or lengthening contractions. J Physiol 390: 271–284, 1987. [DOI] [PMC free article] [PubMed] [Google Scholar]
- Roth M, Decety J, Raybaudi M, Massarelli R, Delon-Martin C, Segebarth C, Morand S, Gemignani A, Décorps M, Jeannerod M. Possible involvement of primary motor cortex in mentally simulated movement: a functional magnetic resonance imaging study. Neuroreport 7: 1280–1284, 1996. [DOI] [PubMed] [Google Scholar]
- Rothwell JC, Day BL, Berardelli A, Marsden CD. Effects of motor cortex stimulation on spinal interneurones in intact man. Exp Brain Res 54: 382–384, 1984. [DOI] [PubMed] [Google Scholar]
- Rozand V, Lebon F, Papaxanthis C, Lepers R. Does a mental training session induce neuromuscular fatigue? Med Sci Sports Exerc 46: 1981–1989, 2014. [DOI] [PubMed] [Google Scholar]
- Schieppati M. The Hoffmann reflex: a means of assessing spinal reflex excitability and its descending control in man. Prog Neurobiol 28: 345–376, 1987. [DOI] [PubMed] [Google Scholar]
- Stinear CM, Byblow WD. Motor imagery of phasic thumb abduction temporally and spatially modulates corticospinal excitability. Clin Neurophysiol 114: 909–914, 2003a. [DOI] [PubMed] [Google Scholar]
- Stinear CM, Byblow WD. Role of intracortical inhibition in selective hand muscle activation. J Neurophysiol 89: 2014–2020, 2003b. [DOI] [PubMed] [Google Scholar]
- Stinear CM, Byblow WD, Steyvers M, Levin O, Swinnen SP. Kinesthetic, but not visual, motor imagery modulates corticomotor excitability. Exp Brain Res 168: 157–164, 2006. [DOI] [PubMed] [Google Scholar]
- Taylor JL. Stimulation at the cervicomedullary junction in human subjects. J Electromyogr Kinesiol 16: 215–223, 2006. [DOI] [PubMed] [Google Scholar]
- Taylor JL, Petersen NT, Butler JE, Gandevia SC. Interaction of transcranial magnetic stimulation and electrical transmastoid stimulation in human subjects. J Physiol 541: 949–958, 2002. [DOI] [PMC free article] [PubMed] [Google Scholar]
- Yahagi S, Shimura K, Kasai T. An increase in cortical excitability with no change in spinal excitability during motor imagery. Percept Mot Skills 83: 288–290, 1996. [DOI] [PubMed] [Google Scholar]