Figure 1.
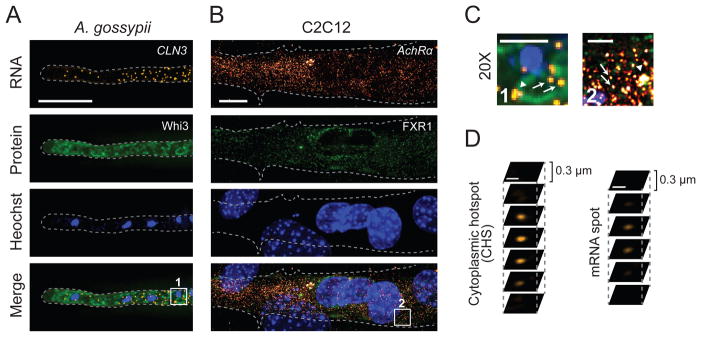
smFISH with immunofluorescence (IF) (A) CLN3 mRNA (orange; smFISH) and Whi3-GFP (green; IF) are visualized by smFISH and IF, respectively in A. gossypii. Rabbit anti-GFP IgG (1:100) and rat antirabbit IgG conjugated with Alexa-488 (1:500; Santa Cruz Biotech, TX) are used for IF. (B) AchRα transcripts (orange; smFISH) and FXR1 (green; IF) in differentiated C2C12 mouse myotubes. FXR1 was detected using 1:5,000 rabbit α-FXR1 ML14 antiserum (a generous gift from Edward Khandjian at Universite Laval), and 1:200 goat α-rabbit Alexa 488 (Molecular probes). (A,B) Nuclei are visualized by Hoechst staining. The gray dashed line indicates cell outline. Scale bar: 10 μm. (C) Magnification (20X) of a region within boxes in Figure 1A and 1B, bottom panels. Arrowheads indicate the cytoplasmic hotspots and arrows indicate single mRNA foci. Scale bar: 2 μm. (D) Z-sections of a cytoplasmic hotspot and mRNA spot. Scale bar: 500 nm.

