

Abstract
Background
Combinations of reflux parameters (acid exposure time, AET; symptom association probability, SAP) on pH-impedance monitoring describe varying confidence in reflux evidence. We compared outcomes between phenotypes with distinct pre-identified reflux parameters.
Methods
In this observational cohort study, patients undergoing pH-impedance testing over a 5-year period were phenotyped by strength of reflux evidence as strong (abnormal AET, positive SAP), good (abnormal AET, negative SAP), reflux hypersensitivity (RH, normal AET, positive SAP), and equivocal evidence of reflux, and compared to two historical institutional pH monitoring cohorts. Symptom burden (dominant symptom intensity, DSI; global symptom severity, GSS) was assessed by questionnaire at baseline and on prospective follow-up and compared between phenotypes.
Results
Of 94 patients tested off PPI therapy, baseline symptom burden was highest with strong reflux evidence and lowest when equivocal (DSI: p=0.01; GSS: p=0.03 across groups). After 3.1±0.2 years follow-up, symptomatic improvement with surgical or medical therapy was highest with strong or good evidence, and lowest when equivocal (DSI: p=0.008; GSS: p=0.005 across groups). This was most pronounced for typical symptoms (DSI: p=0.001; GSS: 0.016 across groups), but not atypical symptoms (DSI: p=0.6; GSS: p=0.2). For testing on PPI therapy, only GSS followed a similar trend (GSS: p=0.057, DSI: p=0.3). Compared to historical cohorts with pH monitoring alone, equivocal evidence for reflux was partly replaced by RH, especially off PPI (p<0.0001).
Conclusions
Phenotyping GERD by strength of reflux evidence on pH-impedance testing off PPI efficiently stratifies symptomatic outcome, especially for typical symptoms, and could be useful in planning management.
Keywords: gastroesophageal reflux disease, pH-impedance testing, symptom-reflux association, strength of reflux evidence
INTRODUCTION
An empiric trial of antisecretory therapy is often utilized as the initial diagnostic approach in symptomatic gastroesophageal reflux disease (GERD).1 Further diagnostic testing is typically reserved for patients where a diagnosis of GERD remains in doubt (unproven GERD), for those with known GERD whose symptoms do not resolve with seemingly adequate antireflux therapy (proven GERD), for those in whom further confirmation of GERD is desired prior to antireflux procedures, and for patients with alarm symptoms requiring endoscopic evaluation.1, 2 In these clinical settings, some form of ambulatory reflux monitoring (pH monitoring alone, or combined pH-impedance monitoring) is often pursued, and performed either off antisecretory therapy (unproven GERD) or on maximal antisecretory therapy (proven GERD). In both of these scenarios, abnormal acid exposure time (AET) and symptom-reflux correlation with impedance-detected reflux events provide the best prediction of symptomatic improvement with antireflux therapy.3, 4
There has been interest in phenotyping GERD based on the strength of reflux evidence on ambulatory reflux monitoring.5–7 We have previously reported that two parameters - AET and symptom association probability (SAP) obtained from conventional ambulatory pH monitoring - can stratify reflux evidence into the following categories: strong (abnormal AET and positive SAP), good (abnormal AET alone), reflux hypersensitivity (RH; physiologic AET and positive SAP), and equivocal (normal AET and negative SAP).8 In retrospective analysis, GERD phenotypes on conventional pH monitoring have demonstrated a gradient of symptomatic response to antireflux therapy in the setting of esophageal chest pain and unexplained cough, with the best response seen with strong GERD evidence, and the worst with equivocal evidence.9, 10 Similar clinical phenotyping has been reported with parameters from combined pH-impedance monitoring,11 which may have higher sensitivity than pH monitoring alone in detecting reflux events.5, 12 When symptomatic outcome with proton pump inhibitor (PPI) therapy was assessed, the proportions within each phenotype differed between those with PPI response compared to non-response, suggesting that symptomatic outcome can potentially be better predicted by the strength of reflux evidence on combined pH-impedance testing than on conventional pH monitoring alone.11
In this study, we utilized pH-impedance monitoring to stratify patients with reflux symptoms into phenotypes based on strength of reflux evidence, using the two parameters previously identified to predict outcome, abnormal AET and symptom reflux association3, 4. We compared the distribution of phenotypes in this cohort to that obtained from previously reported institutional pH databases. Specifically, we sought to prospectively compare symptomatic outcomes between these GERD phenotypes following medical or surgical antireflux therapy.
METHODS
Subjects
All adults (≥18 years of age) with persisting GERD symptoms despite antisecretory therapy referred for pH-impedance testing to the motility center at Washington University in Saint Louis, Missouri from January 2005 through August 2010 were eligible for inclusion. Exclusion criteria included inadequate studies (poor data quality precluding analysis), incomplete studies (< 14 hours of recording time), incomplete symptom information (incomplete questionnaires), major histopathology-based esophageal motor disorders, and prior history of fundoplication or other foregut surgery. All patients were prospectively contacted for follow-up and repeat symptom assessment by questionnaire; those who could not be contacted for follow-up or declined follow-up questionnaire assessments were also excluded. Patient management was not influenced by this study protocol; instead, management was directed by the treating physicians who provided referral for pH-impedance testing. This study protocol was approved by the Human Research Protection Office at Washington University in Saint Louis.
pH-Impedance Monitoring
pH-impedance testing was offered in an ‘open-access’ fashion such that referring physicians decided whether testing was performed on or off antisecretory therapy. When performed off therapy, patients were instructed to stop their PPI medications 5–7 days prior to the study, and histamine-2 receptor antagonists, prokinetic medications, and antacids 3 days prior to the study. After an overnight fast, an experienced nurse positioned the pH-impedance catheter (Sandhill Scientific, Highlands Ranch, CO) such that the distal esophageal pH sensor was 5 cm proximal to the lower esophageal sphincter (LES), measured using high-resolution esophageal manometry (HRM). Throughout data acquisition, patients recorded their meals and activities on a paper diary, and logged their symptom events by pressing appropriate buttons on the data recorder.
Upon return of the data recorder, diary events were reconciled and meal times excluded. The uploaded data was then analyzed with dedicated software (Bioview Analysis; Sandhill Scientific, Highlands Ranch, CO), with automated calculation of AET, reflux exposure time (RET, consisting of bolus exposure time 5 cm proximal to the LES, to correspond to AET), reflux events, symptom events, and symptom-reflux association parameters. Each pH-impedance study was scrutinized manually by two reviewers (AP, CPG) to ensure the accuracy of automated capture of reflux events; any discrepancies between the reviewers were resolved by discussion.
AET was calculated as the percentage of time the pH was below 4 at the distal esophageal pH sensor. Per our institutional threshold, an AET≥4.0% was designated as abnormal.4, 13 Symptoms were considered associated with reflux events if they occurred within 2 minutes following a reflux event. Symptom association probability (SAP) was calculated using the Ghillebert probability estimate (GPE).14 SAP was designated positive if the likelihood of a chance association between symptoms and reflux events was <5%, corresponding to p<0.05. The SAP was first calculated for pH-detected reflux events, then re-calculated for all impedance-detected reflux events. Our group has previously shown that GPE correlates very well with SAP calculated using the Weusten method, with sensitivity of 0.95 and specificity of 0.91.15, 16
Based on AET and SAP, patients were categorized according to reflux evidence into the following clinical phenotypes: 1) strong (both abnormal AET and positive acid or impedance SAP), 2) good (abnormal AET but negative SAP), 3) reflux hypersensitivity (RH; normal AET but positive SAP to pH or pH-impedance detected reflux events), and 4) no or equivocal evidence (normal AET and negative SAP).
Symptom Assessment
Prior to pH-impedance monitoring, all patients completed a symptom survey to rate their dominant and secondary symptom frequency and severity on 5-point Likert scales generated a priori for esophageal testing at our center.3, 4, 17, 18 For each esophageal symptom, patients rated symptom frequency from 0 (no symptoms) to 4 (multiple daily episodes) and symptom severity from 0 (no symptoms) to 4 (very severe symptoms); the product of severity and frequency yielded a total score from 0 to 16, termed the dominant symptom intensity (DSI). Additionally, patients rated their global symptom severity (GSS) pertaining to the esophagus over the previous two weeks on a 100-mm visual analog scale (VAS). Basic demographic data (age, gender, race) were also collected.
Each patient’s referring physician guided subsequent management; treatment decisions were not influenced or altered by this study. Potential subjects for this study were prospectively contacted to assess management approaches (surgical versus medical therapy) and symptomatic outcomes. The pre-procedure symptom survey was re-administered at this follow-up, and linear as well as dichotomous (≥50%) improvement in DSI and GSS were calculated to quantify symptomatic outcomes.
Comparison cohorts
Proportions of phenotypes off and on PPI from the current study cohort were compared to two historical cohorts previously reported from our institution: a cohort of 2067 subjects evaluated with pH monitoring off and on PPI therapy over a 7-year period,8 and a second cohort of 723 subjects evaluated with pH monitoring off PPI therapy over a 5-year period as part of pre-operative testing prior to ARS.19 These comparisons were included in order to assess differences across phenotype proportions between conventional pH and combined pH-impedance testing, studies performed off and on PPI therapy, and between mixed cohorts and cohorts referred for ARS evaluation.
Data Analysis
Data are reported as the mean ± standard error of the mean unless otherwise indicated. Demographics, symptom presentation, PPI status on testing, baseline symptom burden (DSI and GSS), duration of follow-up, management approach, and symptomatic outcomes (both linear and ≥50% improvement in DSI and GSS) were compared across the four GERD phenotypes. Distributions of phenotypes were compared between the study cohort and the two comparison cohorts. Categorical data were compared using the χ-squared test, and continuous data were compared using ANOVA or the 2-tailed Student’s t-test, as appropriate. In all cases, p<0.05 was required for statistical significance. All statistical analyses were performed using IBM SPSS Statistics V.22.0 (Armonk, NY).
RESULTS
Over the 5-year study period, 302 patients underwent ambulatory pH-impedance testing for their persisting GERD symptoms. 60 patients were excluded (7 with inadequate or incomplete studies, 26 with prior esophageal surgery, 3 with major esophageal motor disorders, and 24 with missing pre-procedure surveys), 53 patients could not be reached for follow-up, and 2 patients declined to participate (Figure 1). The remaining 187 patients (53.8±0.9 yr, 70.6% female) consented to participate. Of these, 94 patients were tested off PPI therapy, and the remaining 93 were studied on PPI therapy. There were no differences in demographics, presenting symptoms, proportions who underwent ARS, and duration of follow-up between patients tested off and on PPI therapy (p≥0.09 for all comparisons). Baseline symptom burden was similar between cohorts tested off and on PPI therapy (DSI: 9.4±0.6 vs 8.6±0.6, respectively, p=0.4; GSS; 63.0±2.6 vs 61.6±2.7, respectively, p=0.7).
Figure 1.
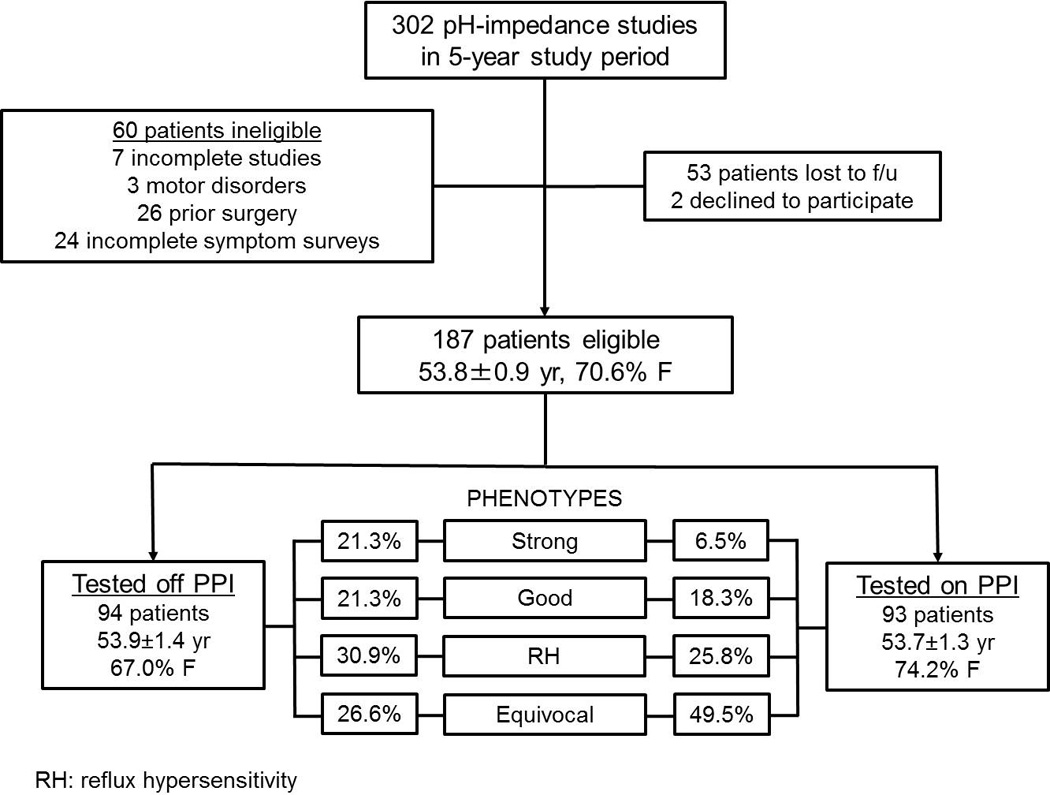
Schematic flow diagram of study design, and proportions of each of the four GERD phenotypes off and on PPI therapy.
Studies off PPI Therapy
Phenotype Distribution
When the 94 patients tested off PPI therapy were phenotyped, 21.3% had strong evidence of GERD, 21.3% had good evidence of GERD, 30.9% had reflux hypersensitivity (RH), and 26.6% had no evidence of GERD according to study definitions (Figure 2A).
Figure 2.
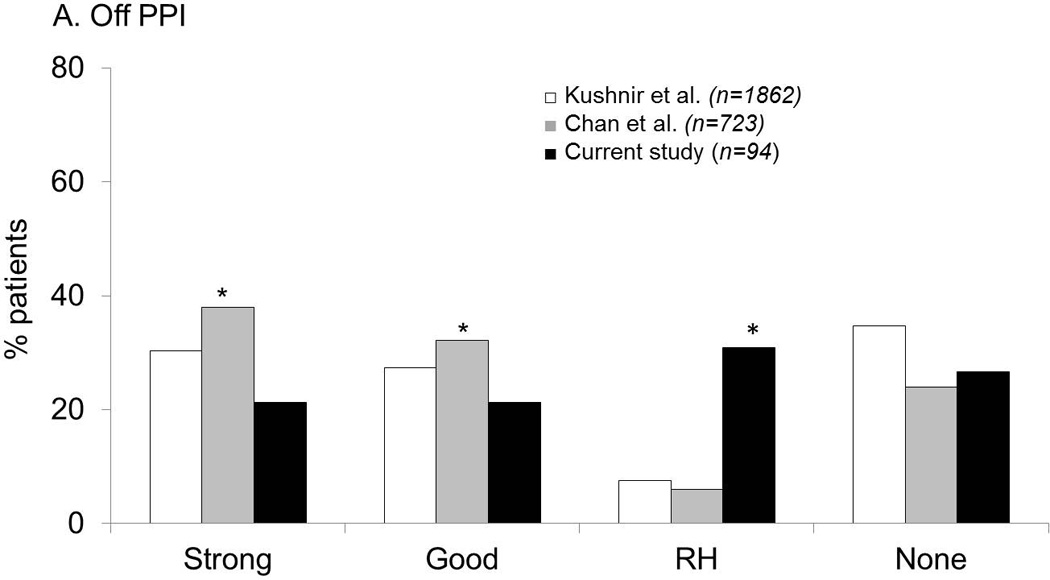
Comparison of GERD evidence phenotypes between the current study (using pH-impedance monitoring) and two institutional historical cohorts using pH monitoring. A. Off PPI therapy. The likelihood of strong and good reflux evidence was highest with pH monitoring performed in patients referred for antireflux surgery, while proportions with RH were highest in the current study utilizing pH-impedance monitoring. B. On PPI therapy. Proportions with abnormal acid exposure were low in all cohorts. Once again, proportion of patients with RH was highest in the current cohort (using pH-impedance monitoring) in contrast to comparison cohorts with pH monitoring alone.
Symptom Burden
When symptom burden was assessed, baseline DSI and GSS were significantly higher in phenotypes with strong and good reflux evidence, compared to RH and no reflux evidence (p=0.01 and 0.03 across groups, respectively, for DSI and GSS; Table 1).
Table 1.
Characteristics of Four GERD Phenotypes from pH-Impedance Monitoring Off PPI
| Strong Reflux Evidence n=20 |
Good Reflux Evidence n=20 |
Reflux Hypersensitivity n=29 |
Equivocal or No Reflux Evidence n=25 |
p values† | |
|---|---|---|---|---|---|
| Mean age (yr) | 52.6±2.3 | 60.5±2.7 | 49.6±2.6 | 54.7±2.8 | 0.040 |
| Gender (F) | 13 (65.0%) | 15 (75.0%) | 16 (55.2%) | 19 (76.0%) | 0.338 |
| Race (Caucasian) | 19 (95.0%) | 18 (90.0%) | 25 (86.2%) | 20 (80.0%) | 0.797 |
| Typical symptoms* | 17 (85.0%) | 11 (55.0%) | 19 (65.5%) | 13 (52.0%) | 0.106 |
| Duration of follow-up (mo) | 37.6±4.5 | 39.3±4.1 | 35.0±3.7 | 39.4±3.5 | 0.815 |
| Surgical Treatment | 15 (75.0%) | 9 (45.0%) | 9 (31.0%) | 2 (8.0%) | <0.001 |
| DSI | |||||
| Baseline | 11.5±1.0 | 11.4±1.3 | 8.1±1.1 | 7.5±0.9 | 0.013 |
| Change** | 8.7±1.3 | 7.5±1.2 | 3.8±1.2 | 4.1±0.9 | 0.008 |
| Follow-up | 2.8±0.9 | 3.9±1.3 | 4.3±0.9 | 3.3±0.9 | 0.728 |
| ≥50% Improvement | 15 (75.0%) | 16 (84.2%) | 15 (55.6%) | 18 (75.0%) | 0.165 |
| GSS | |||||
| Baseline | 74.6±5.0 | 65.6±4.5 | 62.6±5.0 | 52.4±5.4 | 0.031 |
| Change** | 61.9±7.7 | 45.8±6.6 | 34.0±6.3 | 26.0±7.6 | 0.005 |
| Follow-up | 12.3±4.0 | 18.8±3.7 | 29.9±5.1 | 27.3±5.5 | 0.055 |
| ≥50% Improvement | 16 (84.2%) | 13 (68.4%) | 16 (59.3%) | 12 (52.2%) | 0.157 |
PPI: proton pump inhibitor; DSI: dominant symptom intensity; GSS: global symptom severity
heartburn, acid regurgitation
between baseline and follow-up assessments
ANOVA for continuous variables, chi-square for categorical variables
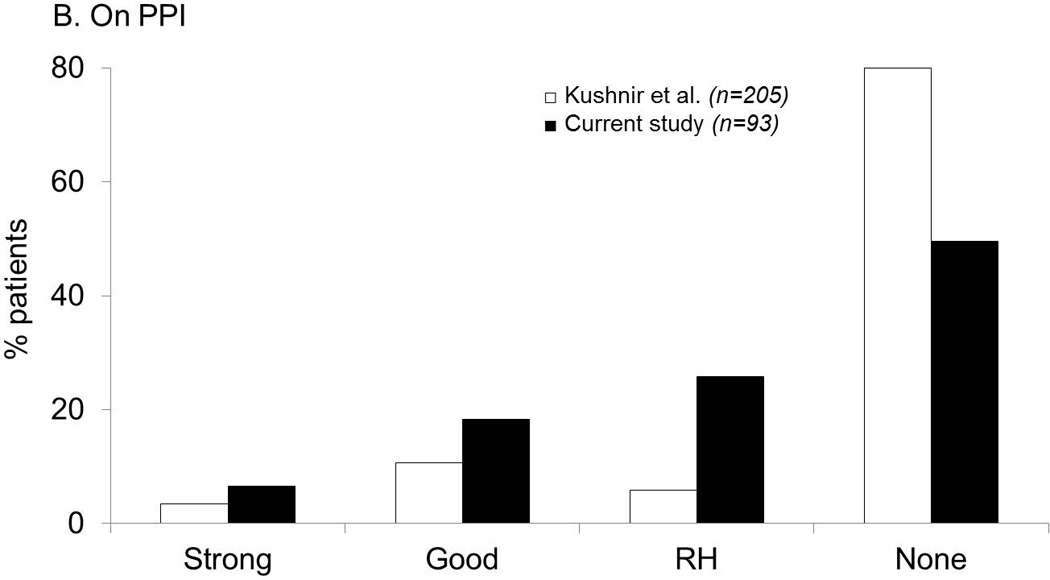
On follow-up assessment 3.1±0.2 years later, change in symptom burden followed a gradient across phenotypes, with greatest change in both DSI and GSS with strong GERD evidence, and least change with no GERD evidence (p=0.008 for DSI and p=0.005 for GSS across groups; Table 1). Strong and good phenotypes had similar linear symptom improvement (p=0.5 and p=0.12 for DSI and GSS, respectively), and these phenotypes both individually and collectively trended significantly different from the equivocal group (p≤0.03 and p≤0.06 for all DSI and GSS comparisons, respectively). Patients with RH demonstrated lesser symptom improvement compared to those with strong or good evidence of reflux (p=0.005 and p=0.018 for DSI and GSS, respectively). Baseline GSS, magnitude of GSS change, and especially follow-up GSS reflecting residual esophageal symptoms over the previous two weeks prior to questionnaire administration, were different across the four phenotypes (Figure 3A).
Figure 3.
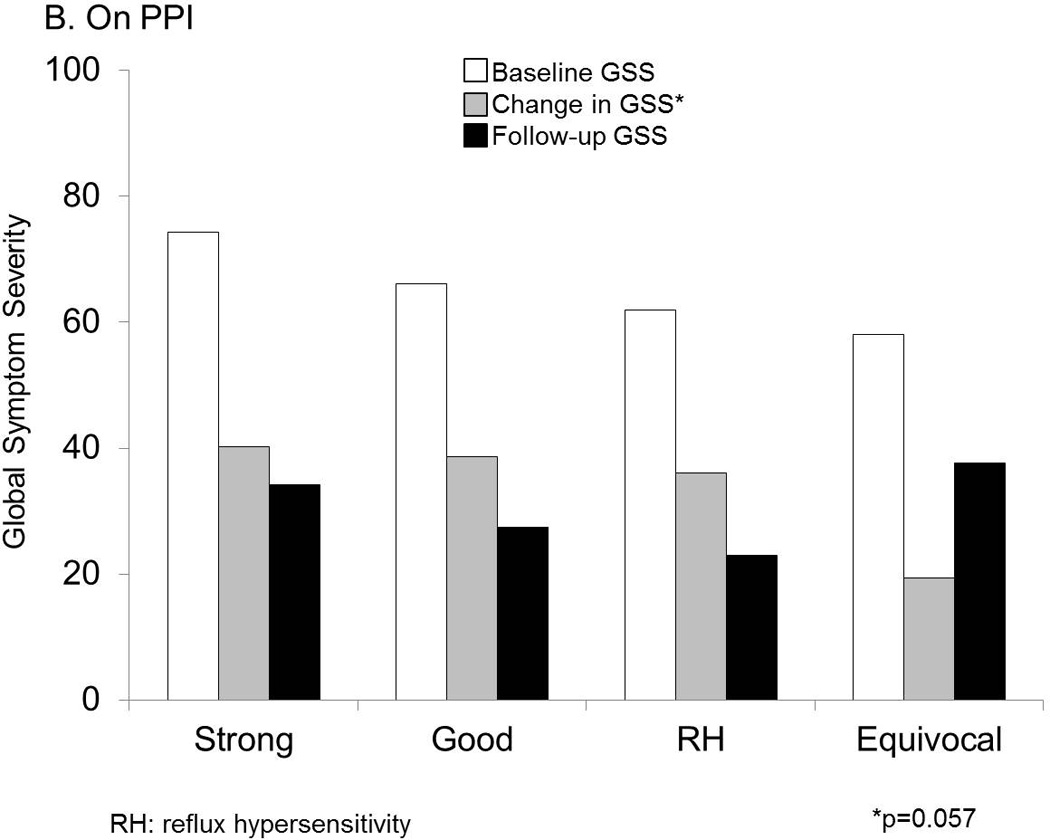
Symptom burden measured as GSS at baseline and follow up were significantly different across GERD phenotypes. RH=reflux hypersensitivity. A. Off PPI. Baseline and follow up global symptom severity (GSS) on 100-mm visual analog scales was lowest with equivocal or no GERD evidence, and followed a gradient along increasing strength of GERD evidence. These differences were statistically significant across groups. B. On PPI. While baseline and follow up GSS were not significantly different, the change in GSS followed the same gradient along increasing strength of GERD evidence, and trended strongly towards statistical significance.
The likelihood of a surgical approach to management was highest with strong reflux evidence, and least with no evidence, as would be expected (p<0.001 across groups; Table 1). Symptom burden improved to a similar extent with medical vs. surgical therapy in the strong and good reflux evidence phenotypes.
Presenting symptoms
Although the proportion of patients presenting with typical symptoms (heartburn or regurgitation) was higher in the strong reflux evidence group when compared to those without GERD evidence (p=0.04), other inter-group comparisons did not show a difference in the proportions with typical symptom presentation (p≥0.08 for all comparisons).
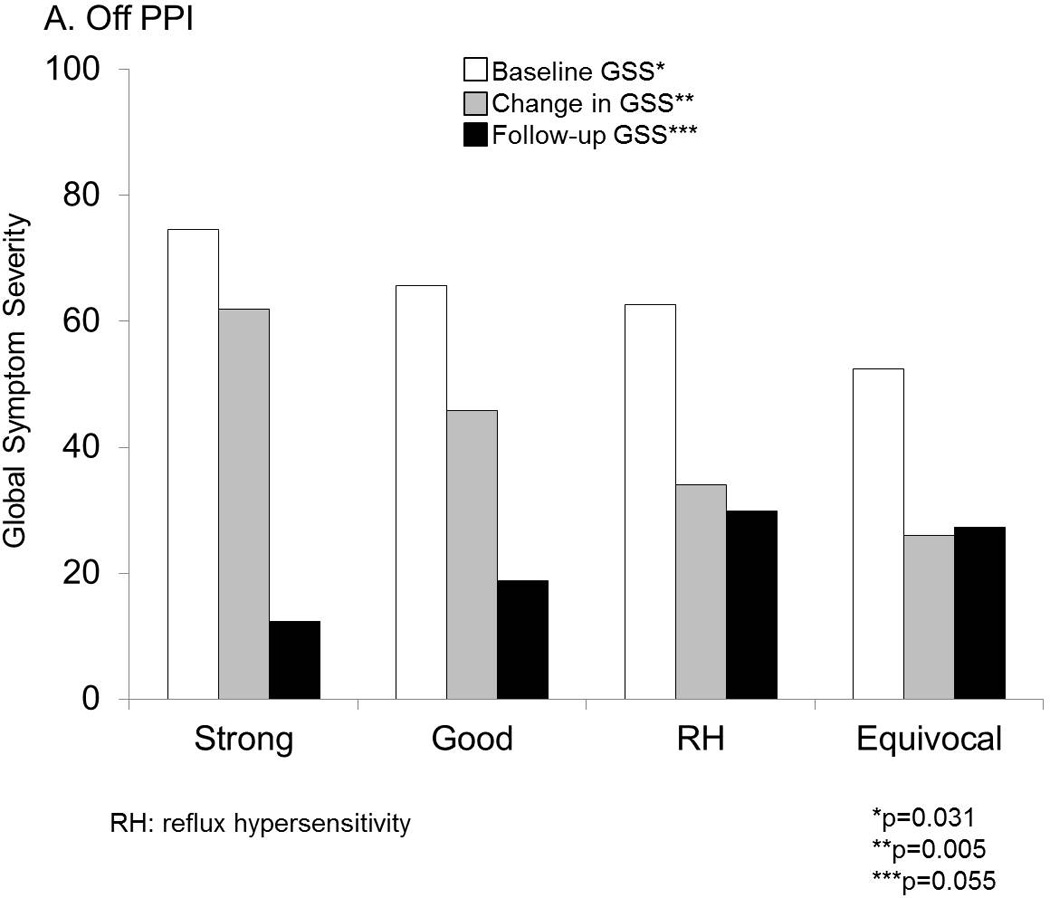
When assessing only the 60 patients with typical symptoms tested off PPI therapy, linear improvement in symptom burden was more profound with greater strength of GERD evidence. This was particularly prominent for dominant symptom change (DSI, p=0.001 across the four phenotypes; Figure 4). Differences in GSS change were also significant across the phenotypes, albeit less profound (p=0.016). In contrast, patients presenting with atypical symptoms tested off PPI therapy did not show differences in symptomatic improvement across phenotypes (p=0.6 and p=0.2 for DSI and GSS, respectively).
Figure 4.
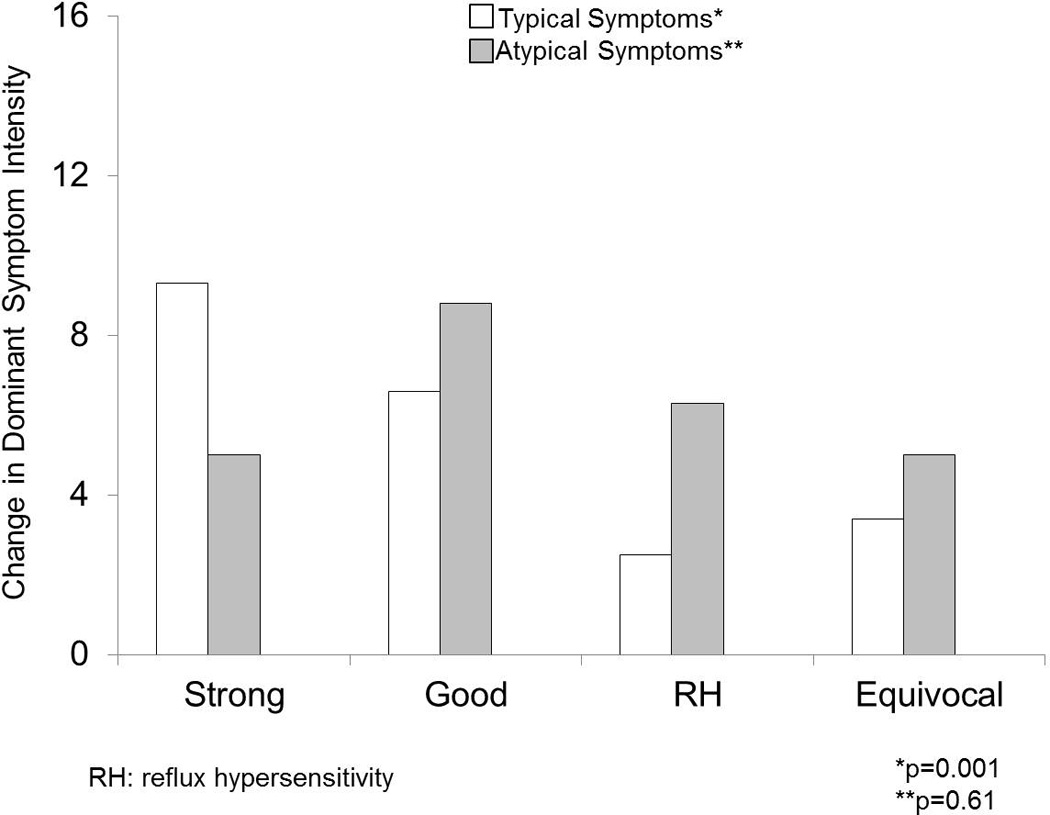
Change in dominant symptom intensity (DSI) across the four GERD phenotypes off PPI. While typical symptoms followed a gradient of greater change in DSI from equivocal to strong GERD evidence (p=0.001), atypical symptoms did not demonstrate a similar pattern (p=0.6).
Studies on PPI therapy
Phenotype Distribution
Of the 93 patients with pH-impedance monitoring performed on PPI therapy, no reflux evidence was seen in almost half the cohort (49.5%), and abnormal AET was seen in only 24.8% (6.5% and 18.3% with strong and good evidence of reflux, respectively; Figure 2B).
Symptom Burden
When symptom burden was assessed, DSI and GSS were numerically higher in the strong reflux evidence phenotype (p=0.06 and p=0.4 for DSI and GSS across groups, respectively; Table 2).
Table 2.
Characteristics of Four GERD Phenotypes from pH-Impedance Monitoring on PPI
| Strong Reflux Evidence n=6 |
Good Reflux Evidence n=17 |
Reflux Hypersensitivity n=24 |
Equivocal or No Reflux Evidence n=46 |
p values† | |
|---|---|---|---|---|---|
| Mean age (yr) | 47.2±2.5 | 51.4±2.5 | 58.5±2.0 | 53.0±2.1 | 0.104 |
| Gender (F) | 5 (83.3%) | 12 (70.6%) | 19 (79.2%) | 33 (71.7%) | 0.842 |
| Race (Caucasian) | 6 (100%) | 13 (76.5%) | 22 (91.7%) | 36 (78.3%) | 0.616 |
| Typical symptoms* | 5 (83.3%) | 10 (58.8%) | 15 (62.5%) | 24 (52.2%) | 0.489 |
| Duration of follow-up (mo) | 32.3±3.8 | 42.2±3.5 | 44.1±4.3 | 42.3±2.6 | 0.553 |
| Surgical Treatment | 4 (66.7%) | 8 (47.1%) | 7 (29.2%) | 5 (10.9%) | 0.002 |
| DSI | |||||
| Baseline | 14.0±2.0 | 8.3±1.2 | 9.4±1.2 | 7.6±0.9 | 0.061 |
| Change** | 7.2±4.0 | 4.5±1.5 | 6.2±1.3 | 3.5±0.9 | 0.306 |
| Follow-up | 6.8±3.2 | 3.8±1.1 | 3.2±1.0 | 4.1±0.7 | 0.491 |
| ≥50% Improvement | 3 (50.0%) | 10 (62.5%) | 17 (77.3%) | 26 (61.9%) | 0.518 |
| GSS | |||||
| Baseline | 74.3±8.7 | 66.1±5.3 | 61.9±6.2 | 58.1±3.9 | 0.421 |
| Change** | 40.2±14.5 | 38.7±8.9 | 36.0±7.7 | 19.4±3.7 | 0.057 |
| Follow-up | 34.2±11.6 | 27.4±6.5 | 23.0±6.0 | 37.7±4.2 | 0.194 |
| ≥50% Improvement | 3 (50.0%) | 12 (70.6%) | 11 (55.0%) | 13 (29.5%) | 0.022 |
PPI: proton pump inhibitor; DSI: dominant symptom intensity; GSS: global symptom severity
heartburn, acid regurgitation
between baseline and follow-up assessments
ANOVA for continuous variables, chi-square for categorical variables
On follow-up assessment 3.5±0.2 years later, change in GSS strongly trended along a gradient similar to that seen off PPI therapy, highest change occurring with strong GERD evidence, and least change with no GERD evidence (p=0.057; Figure 3B). Strong and good phenotypes had similar linear symptom improvement (p=0.5 and p=0.9 for DSI and GSS, respectively), and these phenotypes collectively were significantly different from the equivocal group for GSS change (p=0.010) but not for DSI change (p=0.325). Among these patients tested on PPI therapy, patients with RH had similar symptom improvement compared to those with strong or good evidence of reflux (p=0.6 and p=0.8 for DSI and GSS, respectively).
Proportions of patients undergoing ARS followed a gradient similar to those tested off PPI therapy, and was highest with strong reflux evidence, and least with no evidence (p=0.002, Table 2).
Comparison with Historical Cohorts
In patients tested off PPI, proportions of patients with strong GERD evidence were highest in the comparison cohort of patients referred for ARS (p≤0.002 for both comparisons) compared to the current study and to pH monitoring alone.19 The biggest differences, however, were seen in the proportions of RH, which were highest with pH-impedance monitoring; proportions with acid sensitivity in both the historical pH monitoring cohorts were significantly lower (p<0.0001; Figure 2A).
Similar to the current study, proportions with strong and good GERD evidence were low in the comparison cohort with pH monitoring on PPI therapy, with 80.0% demonstrating normal pH parameters. Proportions with no GERD evidence were highest with pH monitoring alone, while there was a shift in proportions of patients from no GERD evidence with pH monitoring to RH with combined pH-impedance monitoring, due to higher numbers of reflux events detected with pH-impedance monitoring (p<0.0001 for both comparisons, Figure 2B).
DISCUSSION
In this prospective observational cohort study, we demonstrate that stratifying patients into phenotypes based on the strength of reflux evidence on pH-impedance monitoring is not only feasible, but also predictive of symptomatic outcome from antireflux therapy. Patients with strong or good evidence of reflux show much greater symptomatic improvement compared to those with no or equivocal evidence of reflux. Our results demonstrate that this phenotyping provides best outcome information with pH-impedance monitoring off PPI therapy, and particularly for typical rather than atypical symptoms. We propose that phenotyping of GERD based on the strength of reflux evidence on pH-impedance monitoring can be part of the decision-making process in planning the management approach in symptomatic GERD, and in counseling patients regarding expectations of symptom response.
The clinical value of the gain in GERD evidence afforded by combined pH-impedance monitoring over conventional pH monitoring alone has been unclear in the past. Impedance parameters such as reflux exposure time (RET), symptom index (SI), or the total numbers of reflux events have not consistently predicted symptomatic improvement in outcome studies3, 4, 20 despite the decrease in total numbers of reflux events following ARS.21 In contrast, AET from pH or pH-impedance monitoring has been shown to predict symptomatic outcome. The clinical value of impedance monitoring may be in complementing the predictive value of AET, by providing symptom association with impedance-detected reflux events, since impedance monitoring provides a higher yield of reflux events compared to pH monitoring alone.3, 4 Based on these prior conclusions including outcome data from both medical and surgical antireflux therapy3, 4, these two parameters from pH-impedance testing were used in generating the phenotypes. We demonstrate that this combination of abnormal AET and symptom association with impedance detected reflux events is successful in identifying GERD phenotypes in whom the best symptomatic outcomes can be predicted when both of these parameters coexist.
However, the association of symptoms with reflux events remains controversial as a parameter ascribing causality on pH and pH-impedance monitoring; indeed, symptom association is the weakest link in reflux monitoring.22 The numbers of reflux events and numbers of symptoms related to reflux events have been shown to be consistent, as have multiple symptom-reflux association indices beyond the symptom index, which returns inconsistent results in the setting of limited or excessive symptoms or reflux events.16, 23 In contrast, a study of a mixed cohort of patients tested both on and off antisecretory therapy suggested that symptom reflux association indices can be over-interpreted, especially in the absence of high acid exposure times of >10%.22 Another study of 100 patients with typical GERD symptoms suggested that the proportions of patients with any positive symptom-reflux association on pH-impedance monitoring performed off PPI therapy did not differ between PPI responders and non-responders.20 Our data suggests that symptom association is of value when positive, and provides predictive information suggesting symptom improvement from antireflux therapy when combined with abnormal AET. This assertion is further supported by retrospective data demonstrating better symptomatic outcome when both AET and symptom association parameters coexist.9–11, 24
Other investigators have proposed similar phenotyping of reflux disease, using the presence or absence of abnormal reflux exposure and symptom association off PPI therapy.7 Our data clearly support such phenotyping, especially off PPI therapy. Further, patients with strong or good evidence of reflux on pH-impedance testing showed superior symptomatic outcomes to antireflux therapy compared to those with no or equivocal evidence of reflux. This suggests that phenotyping can be utilized to counsel patients, plan management, and perhaps even discontinue antireflux therapy when the basis for GERD is not substantiated on well-performed reflux monitoring off PPI therapy.9–11
Comparison of our data with existing literature provides prevalence information on the proposed four GERD phenotypes from tertiary care practice.8, 11 We show that the likelihood of identification of RH is significantly higher when pH impedance testing is utilized, from the fact that pH-impedance monitoring detects higher reflux events compared to pH monitoring alone, which in turn allows more symptoms to be associated with reflux events. There is a clear shift from equivocal or no reflux evidence to RH with pH-impedance monitoring over pH monitoring alone, a finding that has been reported previously by Savarino et al. A potentially higher degree of functional overlap likely coexists with patients without any reflux evidence on pH-impedance monitoring, with the worst outcome from antireflux therapy in this phenotype.
Limitations of our study design influence the strength of our conclusions. Study patients were identified retrospectively from the study database and prospectively followed using questionnaires; despite this methodology, only 21.9% of eligible participants could not be contacted, and the duration of follow-up was over 3 years. GERD management was not protocolized; we could not accurately assess the factors that guided medical or surgical management, as treatment decisions were made by referring physicians without direction from study investigators. However, this point also represents a potential strength of the study design, as outcome from all management avenues could be evaluated within each phenotype, allowing segregation of management outcome in a real-world setting. Non-reflux contributors to symptom perception and resolution, including functional pain overlap and placebo effect, were not separately evaluated and could have affected symptomatic outcomes. We also did not alter our pH threshold in phenotyping patients tested on PPI; however, our preliminary data suggests that the same thresholds predict outcome even when monitoring is performed on PPI4. Our phenotypes reflect a tertiary care practice; therefore, proportions of each GERD phenotype may not be generalizable, and proportions with RH in particular could be lower in non-tertiary care settings. However, our study cohort included a combination of patients from tertiary and community practices referred for testing through an open-access system, which helped capture a wide spectrum of gastroenterology practices. We did not utilize wireless pH monitoring, which could have provided for prolonged recordings, and potentially changed designations from RH and equivocal phenotypes to strong or good phenotypes in some patients, from uncovering day to day variation in acid exposure25. Finally, we could not confirm patient compliance with medical antireflux therapy before pH-impedance testing or on follow-up, other than that self-reported by patients on questionnaires. Nevertheless, we feel our findings conform to published data, and our phenotypes describe pragmatic use of reflux parameters on pH-impedance testing, thus providing direction to clinicians in planning antireflux therapy.
In conclusion, phenotyping symptomatic reflux patients based on AET and SAP from pH-impedance monitoring, especially off PPI therapy and in the setting of typical symptom presentation, predicts GERD symptom outcomes following medical and surgical therapies. Implementation of these phenotypes has potential to function as a robust guide to management of symptomatic reflux patients.
Key Messages.
Distinct phenotypes can be recognized from pH-impedance monitoring data when presence or absence of abnormal esophageal acid exposure time (AET) and symptom reflux association (assessed by symptom association probability or SAP) are utilized.
These phenotypes include patients with strong evidence (abnormal AET, positive SAP), good evidence (abnormal AET, negative SAP), reflux hypersensitivity (normal AET, positive SAP) and equivocal or no evidence of GERD (normal AET, negative SAP).
These GERD phenotypes predict varying degrees of symptomatic outcome from antireflux therapy, particularly when extracted from pH-impedance monitoring performed off antisecretory therapy.
ACKNOWLEDGMENTS
Author roles: AP: study design, data collection and analysis, manuscript preparation and review: GSS: study design, data analysis, critical review of manuscript; VMK & WWC: data collection, manuscript review and approval; CPG: study concept and design, data analysis, manuscript preparation, critical review and final approval of manuscript
This study was partially funded through NIH/NIDDK (5P30 DK052574-14 –AP; NIH K23DK84413-4 - GSS), and through the Washington University Department of Medicine Mentors in Medicine (MIM) and Clinical Science Training and Research (CSTAR) programs
Footnotes
Podium Presentation at the Annual Meeting of the American Gastroenterological Association Washington DC, May 2015
No conflicts of interest exist. No writing assistance was obtained.
REFERENCES
- 1.Katz PO, Gerson LB, Vela MF. Guidelines for the diagnosis and management of gastroesophageal reflux disease. Am J Gastroenterol. 2013;108:308–328. doi: 10.1038/ajg.2012.444. quiz 329. [DOI] [PubMed] [Google Scholar]
- 2.Richter JE, Pandolfino JE, Vela MF, et al. Utilization of wireless pH monitoring technologies: a summary of the proceedings from the esophageal diagnostic working group. Dis Esophagus. 2013;26:755–765. doi: 10.1111/j.1442-2050.2012.01384.x. [DOI] [PubMed] [Google Scholar]
- 3.Patel A, Sayuk GS, Gyawali CP. Acid-based parameters on pH-impedance testing predict symptom improvement with medical management better than impedance parameters. Am J Gastroenterol. 2014;109:836–844. doi: 10.1038/ajg.2014.63. [DOI] [PMC free article] [PubMed] [Google Scholar]
- 4.Patel A, Sayuk GS, Gyawali CP. Parameters on Esophageal pH-Impedance Monitoring That Predict Outcomes of Patients With Gastroesophageal Reflux Disease. Clin Gastroenterol Hepatol. 2015;13:884–891. doi: 10.1016/j.cgh.2014.08.029. [DOI] [PMC free article] [PubMed] [Google Scholar]
- 5.Savarino E, Marabotto E, Zentilin P, et al. The added value of impedance-pH monitoring to Rome III criteria in distinguishing functional heartburn from non-erosive reflux disease. Dig Liver Dis. 2011;43:542–547. doi: 10.1016/j.dld.2011.01.016. [DOI] [PubMed] [Google Scholar]
- 6.Boeckxstaens GE, Rohof WO. Pathophysiology of gastroesophageal reflux disease. Gastroenterol Clin North Am. 2014;43:15–25. doi: 10.1016/j.gtc.2013.11.001. [DOI] [PubMed] [Google Scholar]
- 7.Boeckxstaens G, El-Serag HB, Smout AJ, et al. Symptomatic reflux disease: the present, the past and the future. Gut. 2014;63:1185–1193. doi: 10.1136/gutjnl-2013-306393. [DOI] [PMC free article] [PubMed] [Google Scholar]
- 8.Kushnir VM, Sayuk GS, Gyawali CP. The effect of antisecretory therapy and study duration on ambulatory esophageal pH monitoring. Dig Dis Sci. 2011;56:1412–1419. doi: 10.1007/s10620-010-1443-7. [DOI] [PMC free article] [PubMed] [Google Scholar]
- 9.Kushnir VM, Sayuk GS, Gyawali CP. Abnormal GERD parameters on ambulatory pH monitoring predict therapeutic success in noncardiac chest pain. Am J Gastroenterol. 2010;105:1032–1038. doi: 10.1038/ajg.2009.646. [DOI] [PMC free article] [PubMed] [Google Scholar]
- 10.Hersh MJ, Sayuk GS, Gyawali CP. Long-term therapeutic outcome of patients undergoing ambulatory pH monitoring for chronic unexplained cough. J Clin Gastroenterol. 2010;44:254–260. doi: 10.1097/MCG.0b013e3181b8e97b. [DOI] [PMC free article] [PubMed] [Google Scholar]
- 11.de Bortoli N, Martinucci I, Savarino E, et al. Proton pump inhibitor responders who are not confirmed as GERD patients with impedance and pH monitoring: who are they? Neurogastroenterol Motil. 2014;26:28–35. doi: 10.1111/nmo.12221. [DOI] [PubMed] [Google Scholar]
- 12.Bredenoord AJ, Weusten BL, Timmer R, et al. Addition of esophageal impedance monitoring to pH monitoring increases the yield of symptom association analysis in patients off PPI therapy. Am J Gastroenterol. 2006;101:453–459. doi: 10.1111/j.1572-0241.2006.00427.x. [DOI] [PubMed] [Google Scholar]
- 13.Kahrilas PJ, Quigley EM. Clinical esophageal pH recording: a technical review for practice guideline development. Gastroenterology. 1996;110:1982–1996. doi: 10.1053/gast.1996.1101982. [DOI] [PubMed] [Google Scholar]
- 14.Ghillebert G, Janssens J, Vantrappen G, et al. Ambulatory 24 hour intraoesophageal pH and pressure recordings v provocation tests in the diagnosis of chest pain of oesophageal origin. Gut. 1990;31:738–744. doi: 10.1136/gut.31.7.738. [DOI] [PMC free article] [PubMed] [Google Scholar]
- 15.Weusten BL, Roelofs JM, Akkermans LM, et al. The symptom-association probability: an improved method for symptom analysis of 24-hour esophageal pH data. Gastroenterology. 1994;107:1741–1745. doi: 10.1016/0016-5085(94)90815-x. [DOI] [PubMed] [Google Scholar]
- 16.Kushnir VM, Sathyamurthy A, Drapekin J, et al. Assessment of concordance of symptom reflux association tests in ambulatory pH monitoring. Aliment Pharmacol Ther. 2012 doi: 10.1111/j.1365-2036.2012.05066.x. [DOI] [PMC free article] [PubMed] [Google Scholar]
- 17.Kushnir VM, Prakash Gyawali C. High resolution manometry patterns distinguish acid sensitivity in non-cardiac chest pain. Neurogastroenterol Motil. 2011;23:1066–1072. doi: 10.1111/j.1365-2982.2011.01787.x. [DOI] [PMC free article] [PubMed] [Google Scholar]
- 18.Shaker A, Stoikes N, Drapekin J, et al. Multiple rapid swallow responses during esophageal high-resolution manometry reflect esophageal body peristaltic reserve. Am J Gastroenterol. 2013;108:1706–1712. doi: 10.1038/ajg.2013.289. [DOI] [PMC free article] [PubMed] [Google Scholar]
- 19.Chan WW, Haroian LR, Gyawali CP. Value of preoperative esophageal function studies before laparoscopic antireflux surgery. Surg Endosc. 2011;25:2943–2949. doi: 10.1007/s00464-011-1646-9. [DOI] [PubMed] [Google Scholar]
- 20.Zerbib F, Belhocine K, Simon M, et al. Clinical, but not oesophageal pH-impedance, profiles predict response to proton pump inhibitors in gastro-oesophageal reflux disease. Gut. 2012;61:501–506. doi: 10.1136/gutjnl-2011-300798. [DOI] [PubMed] [Google Scholar]
- 21.Roman S, Poncet G, Serraj I, et al. Characterization of reflux events after fundoplication using combined impedance-pH recording. Br J Surg. 2007;94:48–52. doi: 10.1002/bjs.5532. [DOI] [PubMed] [Google Scholar]
- 22.Slaughter JC, Goutte M, Rymer JA, et al. Caution about overinterpretation of symptom indexes in reflux monitoring for refractory gastroesophageal reflux disease. Clin Gastroenterol Hepatol. 2011;9:868–874. doi: 10.1016/j.cgh.2011.07.009. [DOI] [PubMed] [Google Scholar]
- 23.Aanen MC, Weusten BL, Numans ME, et al. Effect of proton-pump inhibitor treatment on symptoms and quality of life in GERD patients depends on the symptom-reflux association. J Clin Gastroenterol. 2008;42:441–447. doi: 10.1097/MCG.0b013e318074dd62. [DOI] [PubMed] [Google Scholar]
- 24.Prakash C, Clouse RE. Wireless pH monitoring in patients with non-cardiac chest pain. Am J Gastroenterol. 2006;101:446–452. doi: 10.1111/j.1572-0241.2006.00425.x. [DOI] [PubMed] [Google Scholar]
- 25.Penagini R, Sweis R, Mauro A, et al. Inconsistency in the Diagnosis of Functional Heartburn: Usefulness of Prolonged Wireless pH Monitoring in Patients With Proton Pump Inhibitor Refractory Gastroesophageal Reflux Disease. J Neurogastroenterol Motil. 2015;21:265–272. doi: 10.5056/jnm14075. [DOI] [PMC free article] [PubMed] [Google Scholar]