Abstract
Study Design
Investigation of the effects of the impairment of different nutritional pathways on the intervertebral disc degeneration patterns in terms of spatial distributions of cell density, glycosaminoglycan content, and water content.
Objective
To test the hypothesis that impairment of different nutritional pathways would result in different degenerative patterns in human discs.
Summary of Background Data
Impairment of nutritional pathways has been found to affect cell viability in the disc. However, details on how impairment of different nutritional pathways affects the disc degeneration patterns are unknown.
Methods
A 3D finite element model was used for this study. This finite element method was based on the cell-activity-coupled mechano-electrochemical theory for cartilaginous tissues. Impairment of the nutritional pathways was simulated by lowering the nutrition level at the disc boundaries. Effects of the impartment of cartilaginous endplate-nucleus pulposus (CEP-NP) pathway only (Case 1), annulus fibrosus (AF) pathway only (Case 2), and both pathways (Case 3) on disc degeneration patterns were studied.
Results
The predicted critical level of nutrition for Case 1, Case 2, and Case 3 were around 30%, 20%, and 50% of the reference values, respectively. Below this critical level, the disc degeneration would occur. Disc degeneration appeared mainly in the NP for Case 1, in the outer AF for Case 2, and in both the NP and inner to middle AF for Case 3. For Cases 1 and 3, the loss of water content was primarily located in the mid-axial plane, which is consistent with the horizontal gray band seen in some T2-weighted MRI images. For the disc geometry used in this study, it was predicted that there existed a High Intensity Zone (for Case 3), as seen in some T2-weighted MRI images.
Conclusion
Impairment of different nutrition pathways results in different degenerative patterns.
Keywords: biomechanics, continuum mixture theory, finite element method, modeling, biophysics
Introduction
Many spinal disorders (such as neck and low back pain) are associated with the degeneration of the intervertebral disc (IVD),1 which may be initiated or accelerated by a nutritional deficiency.2,3 Due to avascular nature of the IVDs, small molecules (like the nutrients) have to reach the cells through the extracellular matrix mainly by diffusion,4 from the blood vessels at disc margins via two pathways: the cartilaginous endplate-nucleus pulposus (CEP-NP) pathway and the annulus fibrosus (AF) periphery pathway.5 Several researchers have reported that the CEP-NP nutritional pathway is primarily responsible for nurturing cells in the NP and inner AF regions while AF periphery mainly for cells in the outer AF region.5–8 These findings clearly indicate that the nutritional pathway plays a significant role in regulating the spatial distribution of cell density within the IVD.
The disc cells are crucial for maintaining the integrity of tissue structure which is important for its mechanical functions. Loss of cell numbers and resulting extracellular matrix within the disc would trigger a cascade of biochemical and mechanical changes within the tissue, resulting in a tissue failure.9–11 In this study, we are interested in whether impairment of different nutritional pathways affects the degenerative patterns (e.g., spatial distribution of cell density, glycosaminoglycan (GAG) content, and water content, etc.) in human lumbar discs. Thus, the objective of this study was to investigate the effects of variation of nutritional supply and pathways on degenerative patterns in human lumbar discs. We hypothesized that variation of nutrition supply or pathways would result in different degenerative patterns in human lumbar discs. The distributions of cell density, GAG content, and water content in the disc with different nutritional supplies and pathways were studied numerically.9,12
Methods
The effect of impairment of nutritional pathway on disc degeneration patterns was numerically studied with a finite element method developed based on the cell-activity-coupled mechano-electrochemical mixture theory.9,12,13 In this model, the disc is considered as an inhomogeneous, porous mixture consisting of the following phases: a charged solid phase with cells and GAG fixed to it, a fluid phase, a solute phase with multiple species of ions, glucose, oxygen, and lactate. The cell metabolic activities were dependent on glucose, oxygen and lactate (pH value). The cell viability was assumed to be dependent on glucose concentration only13 as it has been reported that glucose is the most crucial nutrients for disc cell survival.3,14,15 The rate of GAG content change (QGAG) was determined by the GAG synthesis rate per tissue volume (Qsyn) and the GAG degradation rate per tissue volume (Qdeg) by: QGAG = Qsyn − Qdeg. The GAG synthesis rate was assumed to be proportional to the value of local cell density (ρcell): Qsyn = λ1 ρcell, while the GAG degradation rate was proportional to the value of local GAG content (CGAG):Qdeg = λ2 CGAG.12 The information on how GAG synthesis rate per cell (i.e., the value of λ1) and the rate of GAG degradation (i.e., the value of λ2) vary with disc degeneration is very limited. It is expected these values will change during the progression of disc degeneration. However, we do not know when these values start to change as disc degeneration progresses. So in this study, we assumed that both proportional constants (i.e., λ1 and λ2) in GAG synthesis and degradation were invariant with time. The value of GAG synthesis rate per cell (i.e., λ1) could be calculated by the values of local cell density, GAG content, and λ2 (which is related to the half-life of GAG turnover16) in the disc at mature, healthy state because the rate of GAG content change in the mature, healthy disc is assumed to be zero.12 The transport of water and solutes were coupled with hydration (or tissue porosity) which depends on tissue deformation in the model.17,18
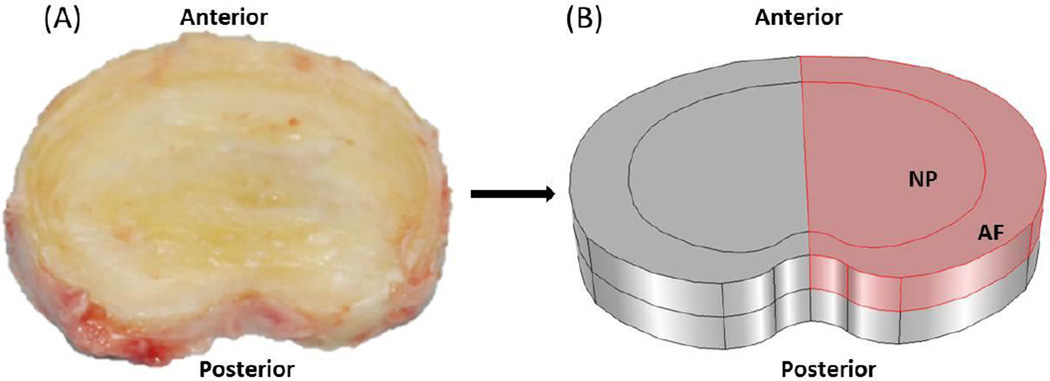
A realistic three-dimensional disc geometry was generated based on an L2-L3 human lumbar disc (41 years old male, non-degenerated19), see Figure 1A. The disc was modeled with two distinct regions: NP and AF. Because of symmetry, only the upper-right quarter of the disc was simulated (Figure 1B). The finite element model of the disc was developed with COMSOL (COMSOL 4.3b, COMSOL Inc. MA) based on the method developed by Sun et al. (1999).20 Disc at the healthy state before degeneration was chosen as the reference configuration.
Figure 1.
(A) Geometry and size of the disc from human lumbar spine (L2–3, male, non-degenerated35) and (B) Schematic of the right–upper quarter of the disc used in the simulations. The cell density in the healthy disc was assumed to be 4000 cells/mm3 in NP and 9000 cells/mm3 in AF.16
The information for cell density in the mature, healthy disc was obtained from experimental data in literature21: 4000 cells/mm3 in NP and 9000 cells/mm3 in AF. Information for distributions of fixed charge density (FCD) and water content (i.e., volume fraction of water) in the mature, healthy disc were extracted from experimental data in literature22: fixed charge density in NP was assumed to be homogeneous, with a value of 0.3425 M, and linearly decreased from 0.3425 to 0.1634 M from the innermost AF region to the outermost AF region. Water content was 0.85 in the NP, and linearly decreased from 0.85 to 0.7 from the innermost AF region to the outermost AF region. More information on material properties, initial and boundary conditions can be found in literature.9,12,13
The concentrations of nutrients and metabolic wastes in the blood were reported to be: 5.6 mM for glucose concentration, 6.4 kPa for oxygen tension, and 1mM for lactate concentration.23–26 The effect of cartilage endplate (CEP) on nutrition supply was considered by adjusting the boundary conditions at the interface between NP and CEP.9 Values for glucose concentration, oxygen tension, and lactate concentration at the CEP-NP boundary were 3.2 mM, 3.6 kPa, and 2.15 mM on the NP surface adjacent to the endplate; respectively; and at the AF periphery boundary were 5 mM, 5.8 kPa, and 0.9 mM, respectively.9,12,23 These values were used as the reference values in this study. The equilibrium distributions of glucose, oxygen, lactate, and other signals in the healthy disc with the reference values were calculated and used as the initial condition for the following simulations. The impaired nutrition supply was simulated by lowering the level of nutrients (glucose and oxygen) at the inner side of the disc boundaries. Since the flux is proportional to the difference in nutrient concentration between blood and inner side of the disc boundaries, varying the nutrient concentration at the inner side of the disc boundaries is equivalent to change the permeability of the tissues, according to Fick’s law. Three cases were investigated in this study: glucose and oxygen concentrations reduced at CEP-NP boundary only (Case 1), at AF periphery only (Case 2), and at both CEP-NP and AF periphery boundaries simultaneously (Case 3). In Case 1, discs with nutrition level at the CEP-NP boundary ranged from 100% to 0% of the corresponding reference values (while the nutrition level on the AF periphery boundary was kept at the reference level) were simulated. In Case 2, discs with the nutrition level at the AF periphery boundary ranged from 100% to 0% of the corresponding reference values (while the nutrition level on the CEP-NP boundary was kept at the reference level) were simulated. In Case 3, discs with the nutrition level at both the CEP-NP and AF periphery boundaries ranged from 100% to 0% of the corresponding reference values were simulated.
Distribution of cell density in the disc at 40 days after reducing the level of nutrients at the boundary was analyzed to investigate the degenerative pattern in discs at the initial stage of degeneration. Forty days was chosen as a time point for the early stage of disc degeneration because the cell density and nutrient distributions in the disc were predicted to reach new equilibrium in about 30 days and 40 days, respectively, after a nutrition level has dropped on disc boundaries.12
Variations of GAG and water contents with time were also calculated. Distributions of GAG and water contents in discs after 10 years of disc degeneration (starting from the time when the nutrient level at disc boundary starts to decrease) were analyzed to elucidate the degenerative patterns in discs at the developed stage, because disc degeneration is a slow process.16,27
Results
Effect of impairment of different nutritional supply and pathways on cell density distribution
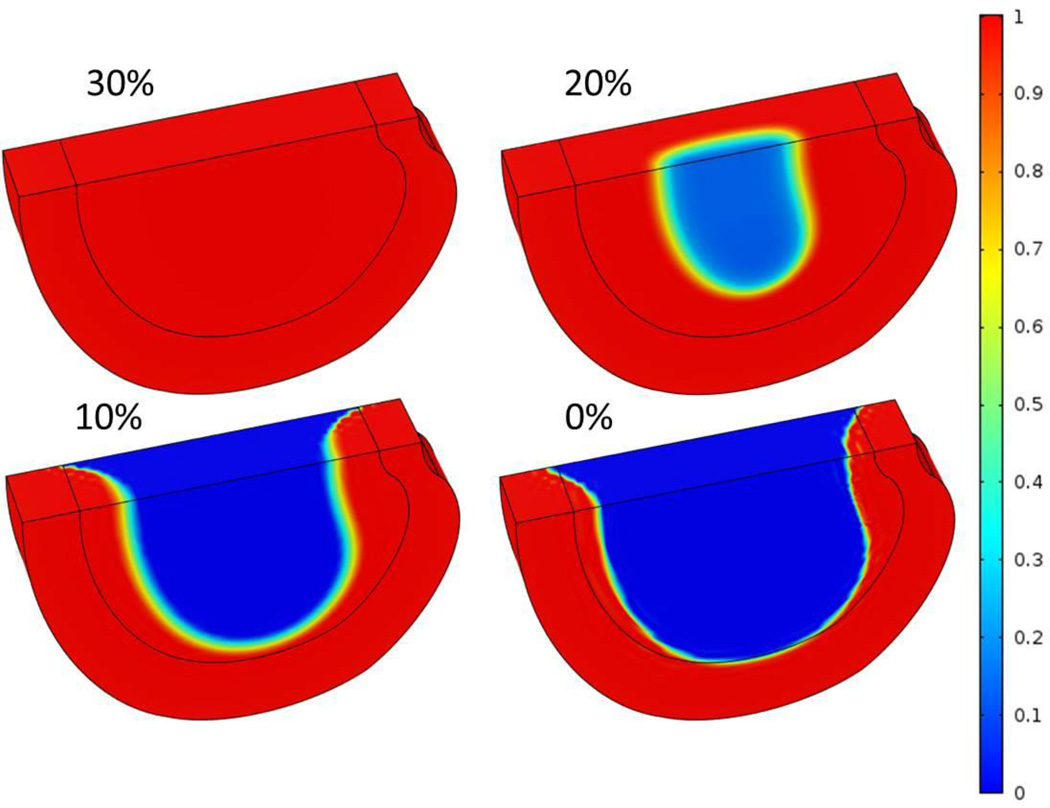
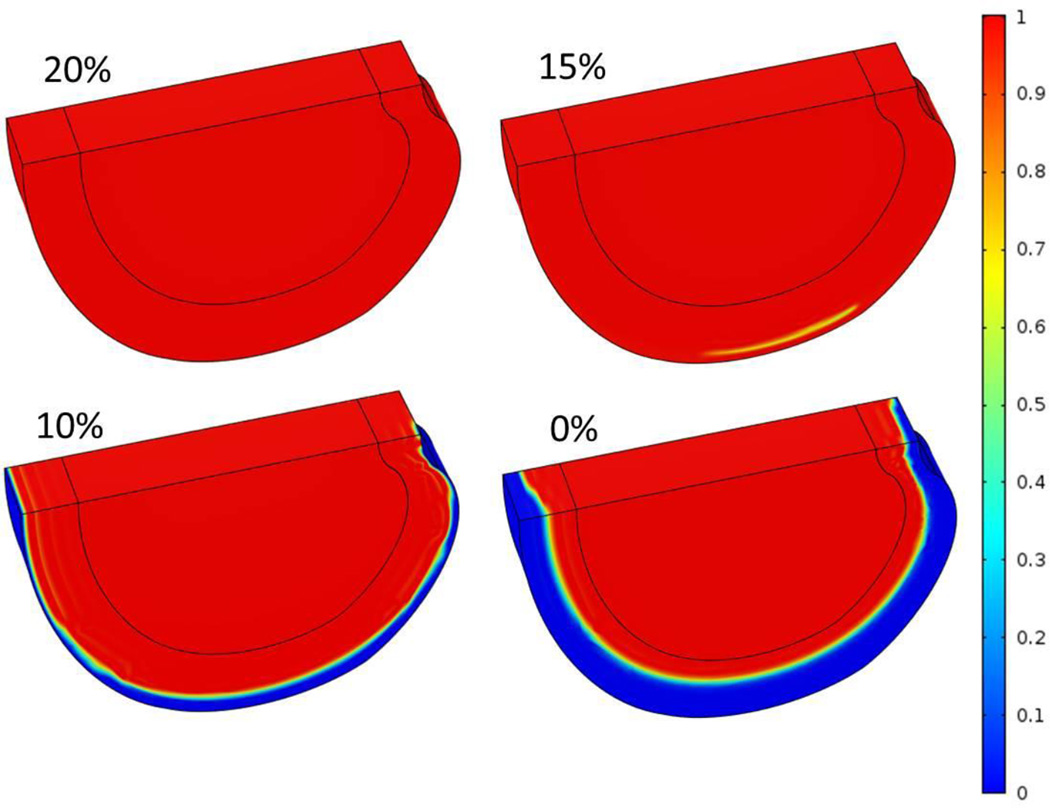
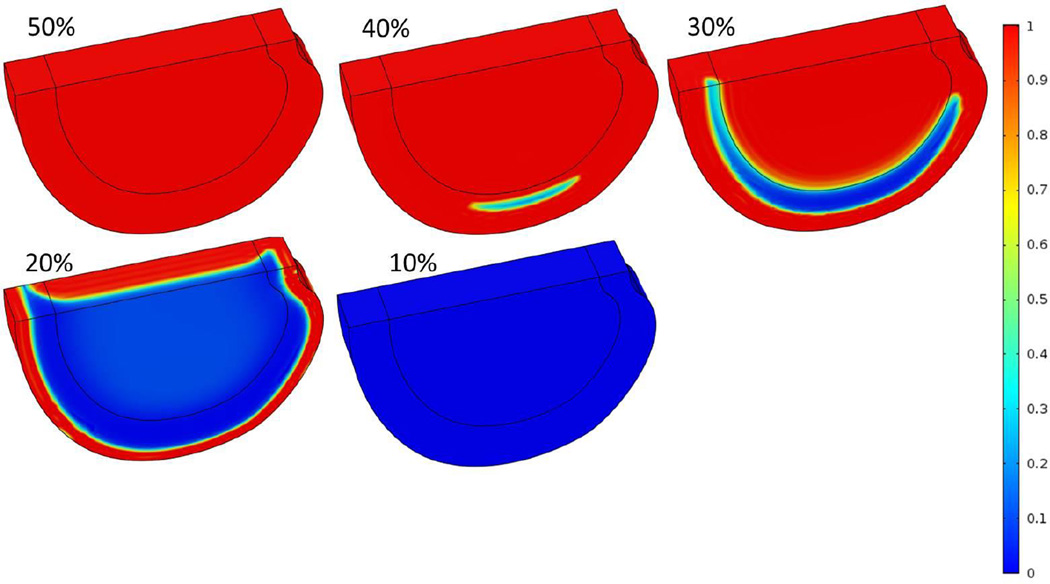
The extent of decrease in the nutrition level at disc boundaries greatly affected the distribution and magnitude of the cell density. After nutrition level decreased to specified values, distribution of the cell density in the disc reached equilibrium state in about 30 days,12 and was reported in Figures 2, 3 and 4. The equilibrium state for cell density distribution was defined at when the maximum change of the relative cell density at a location is less than 0.1% /day.
Figure 2.
Three-dimensional distributions of normalized cell density at steady state after nutrient concentrations on CEP-NP boundary decreased to 30%, 20%, 10%, and 0% of the corresponding reference values.
Figure 3.
Three-dimensional distributions of normalized cell density at steady state after nutrient concentrations on AF periphery decreased to 20%, 15%, 10%, and 0% of the corresponding reference values.
Figure 4.
Three-dimensional distributions of normalized cell density at steady state after nutrient concentrations on both NP and AF boundaries decreased to 50%, 40%, 30%, 20% and 10% of the corresponding reference values.
Case 1: Impairment of CEP-NP pathway only
With the reference values of nutrition concentrations at the AF periphery boundary, the nutrition level around 30% of the reference values at the CEP-NP boundary (i.e., glucose concentration of 1.2 mM and oxygen tension of 1.53 kPa) were predicted to be sufficient for the disc to maintain viability of all the cells (i.e., 4000 cells/mm3 in NP and 9000 cells/mm3 in AF) within the disc (Figure 2A). This level is defined as the critical level for cells survival in the disc. Below this level cell death began to occur.
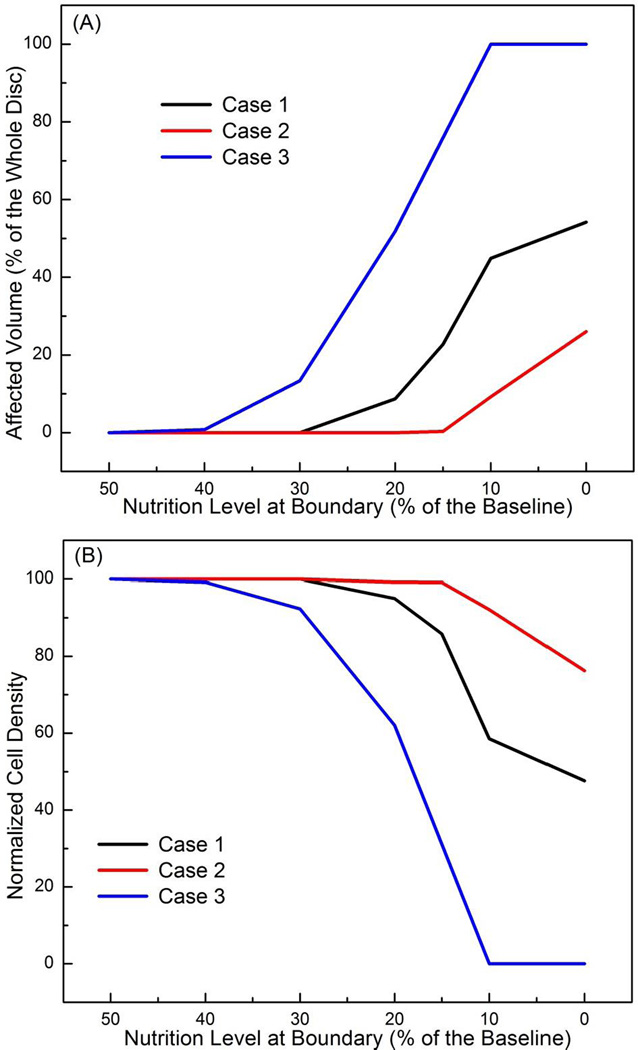
It was predicted that cells started to die from the center of the NP region in this case. When cell density distribution reached an equilibrium state, the cell death occurred mostly in the NP region, while the AF region was not affected (Figure 2). The affected region (defined as the region where cell density decreased by more than 10%) was larger in disc with lower nutrition level at the CEP-NP boundary (Figures 2 and 5A). For example, at the equilibrium state, 54% of the disc volume was affected and the normalized cell density (averaged over whole disc) was 48% when the nutritional level at CEP-NP boundary was 0%, compared to no region was affected (or no cell death) when the nutrition level at CEP-NP boundary was 30% or higher (Figures 5A and 5B).
Figure 5.
(A) Percent of the affected regions (relative to the whole disc volume) where cell death is greater than 10% of the corresponding value at healthy state for Case 1 (black line), Case 2 (red line), and Case 3 (blue line). (B) Changes in normalized cell density (averaged over the whole disc volume) for Case 1 (black line), Case 2 (red line), and Case 3 (blue line). All the results presented in this figure were values at steady state.
Case 2: Impairment of AF pathway only
With nutrition level at the CEP-NP boundary kept at reference values, it was predicted that nutrition level around 20% of the reference values at the AF periphery boundary (i.e., glucose concentration of 1 mM and oxygen tension of 1.16 kPa) were sufficient for the disc (Figure 3A) to maintain viability of all the cells within the disc. Below this level, cell death began to occur (Figure 3), mostly in the outer AF region. The affected region was larger with lower nutrition level at AF periphery (Figures 3 and 5A). The NP region was not affected in this case (Figure 3). When the nutritional level on this boundary was 0%, at the equilibrium state, 26% of the disc volume was affected (Figs 5A), and the normalized cell density reduced to 76% (Figure 5B), compared to no degenerative region (i.e., 0% of affected volume) or no cell death (i.e., 100% of normalized cell density) were predicted at 20% or above of the reference values on AF periphery boundary (Figure 5).
Case 3: Impairment of both CEP-NP and AF periphery pathways
It was predicted that the nutrition level around 50% of the reference values at both CEP-NP boundary (i.e., 2 mM for glucose concentration and 2.55 kPa for oxygen tension) and AF periphery boundary (i.e., 2.5 mM for glucose concentration and 2.9 kPa for oxygen tension) were sufficient to maintain cell viability everywhere within the disc. Below this level the cell death began to occur in the lateral regions (Figure 4). When the nutrition level reduced to 10% or lower (of the reference values) at both CEP-NP and AF periphery boundaries, at equilibrium, all cells within the disc were dead (Figures 4 and 5).
Effect of impairment of different nutritional supply and pathways on GAG and water contents
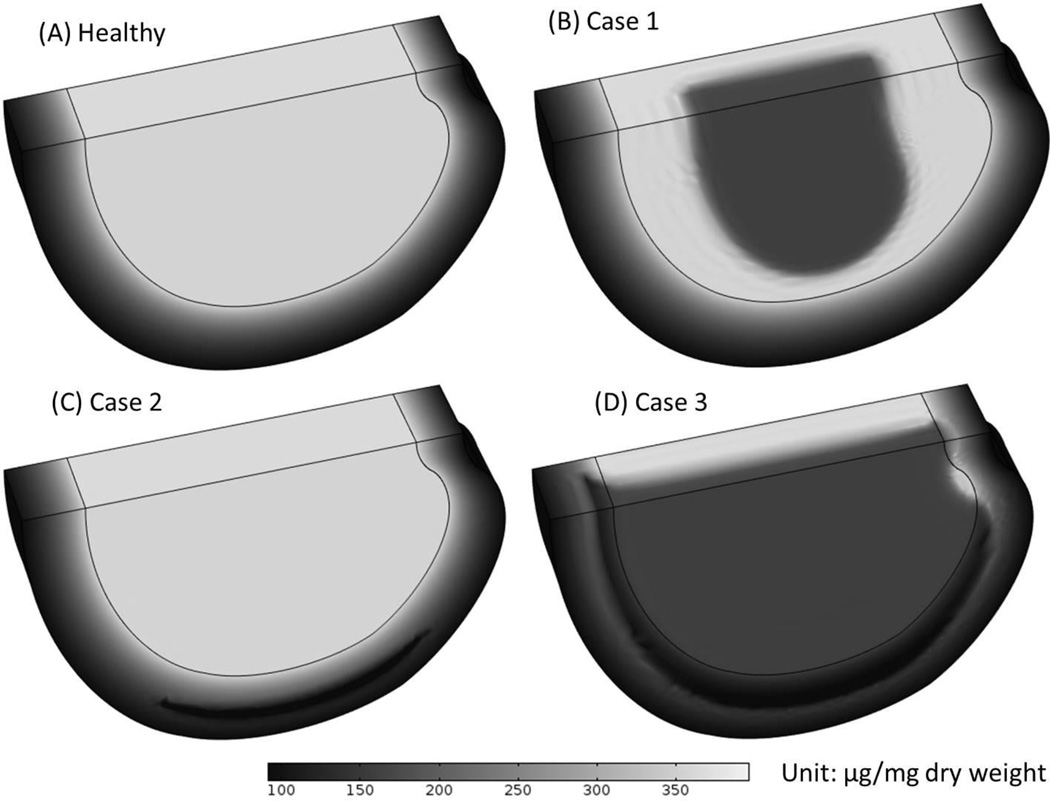
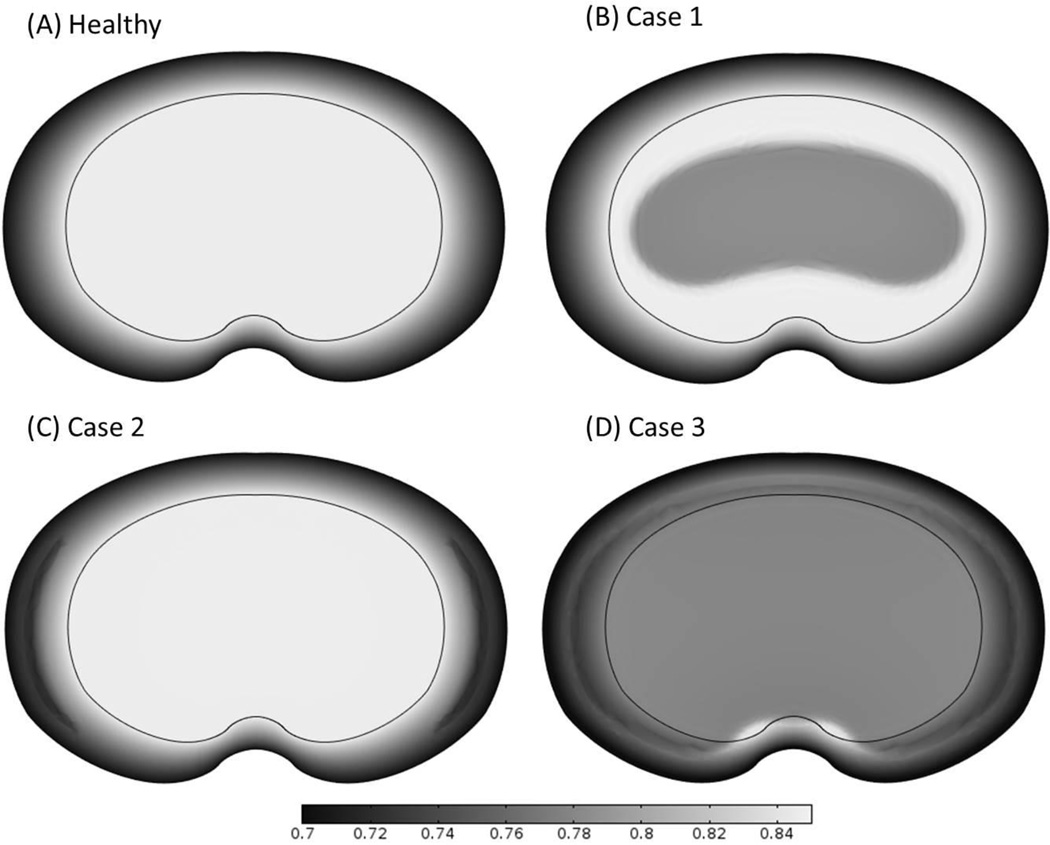
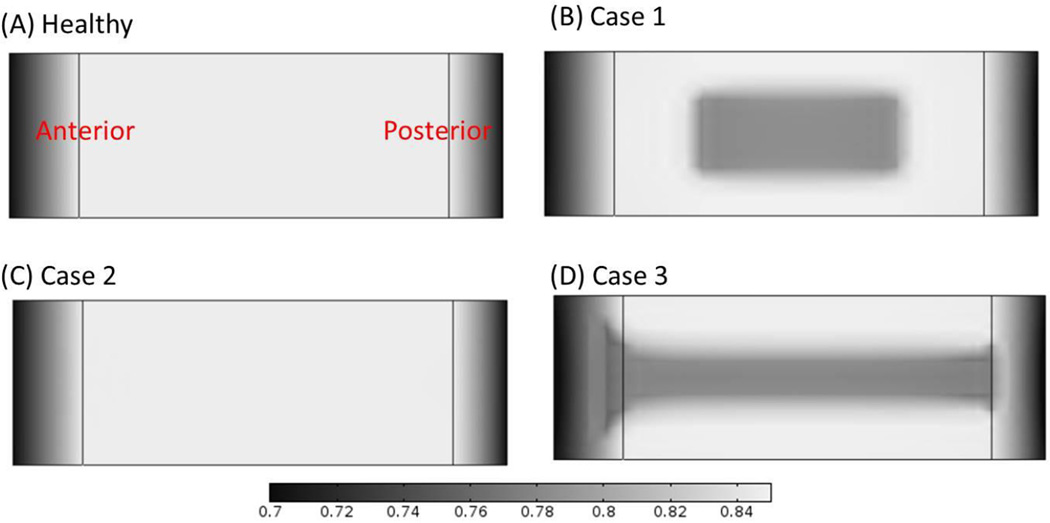
The changes of GAG content (Figure 6) and water content (Figures 7 and 8) distributions within the disc in the three cases were analyzed. Results of GAG content and water content after 10 years of degeneration (starting from the time when the nutrient level at disc boundary starts to decrease) were presented here. It was predicted that the spatial distributions of GAG and water content distributions were similar (Figures 6 and 7). The degenerative patterns seen in Figures 6 and 7 were related to the cell density distributions in Figures 2–4. For Case 3, there was a zone (on the middle plane in the posterior region) with much higher water content than that in the surrounding areas (Figure 7D), this phenomenon was only observed in Case 3.
Figure 6.
Comparison of the GAG content distributions (A) in the healthy disc with reference values of nutrition level, (B) in Case 1 where nutrition level was decreased in CEP-NP pathway only, (C) in Case 2 where nutrition level was decreased in AF pathway only, and (D) in Case 3 where nutrition level was reduced in both pathways. The results shown in (B-D) are GAG distributions at 10 years after cell density reached steady state as nutrition level reduced to 15% of the reference values.
Figure 7.
Comparison of the water content distributions on the disc mid-axial plane (A) in the healthy disc with reference values of nutrition level, (B) in Case 1 where nutrition level was decreased in CEP-NP pathway only, (C) in Case 2 where nutrition level was decreased in AF pathway only, and (D) in Case 3 where nutrition level was decreased in both pathways. The high water content zone is clearly shown in the posterior region in the disc for Case 3. The results shown in (B-D) are water content distributions at 10 years after cell density reached steady state as nutrition level reduced to 15% of the corresponding reference values.
Figure 8.
Comparison of the water content distributions on the mid-sagittal plane (A) in the healthy disc with reference values of nutrition level, (B) in Case 1 where nutritional level was decreased in CEP-NP pathway only, (C) in Case 2 where nutrition level was decreased in AF pathway only, and (D) in Case 3 where nutrition level was decreased in both pathways. The results shown in (B–D) are water content distributions at 10 years after cell density reached steady state as nutrition level reduced to 15% of the corresponding reference values.
Discussion
It is well known that impairment of different nutritional pathways affects the cell density distribution within the disc,5–8 however, little is known on the degenerative pattern (spatial distributions of cell density, GAG content, water content, etc.) of disc in relation to nutritional supplies and pathways. Results from present study indicate that impartment of the CEP-NP nutritional pathway would cause tissue degeneration mostly in the NP region, while impartment of the AF periphery nutritional pathway is primary responsible for the tissue degeneration in the outer AF region.
When the nutrition level to disc is decreased to a critical level, cell death initiates at the location where the local nutrition concentration is the lowest [and below the threshold value for cell survival (e.g., 0.5 mM)3,13–15,28]. This location depends on many factors, such as disc shape and size, the level of nutrition supply at disc boundary, and the transport properties of disc tissues. Note that the effects of disc shape and size or transport properties on degenerative patters were not simulated in current study. As the local glucose concentration decreased below the threshold value for cell survival, cell death occurs and the cell density distribution would reach a new equilibrium (where the demand and supply of nutrients are balanced) in about 30 days.12 At this early state (around 30 days), the integrity of the extracellular matrix is close to intact because the change of extracellular composition is a much slower process.12,16 Thus, the reduction of cell number is the earliest degenerative sign in the disc caused by poor nutrition supply.
In the healthy, adult human lumbar discs before degeneration, we assumed that the GAG synthesis and degradation rates are balanced and the net GAG content does not change with time. When the cell death occurs, the overall GAG synthesis rate within the disc decreases, causing a decrease in the total GAG content over time until a new equilibrium is reached.12 The slow decrease in GAG content gradually reduces the swelling pressure in the disc, resulting in the lower water content within the disc.9,29,30 This explains why the pattern for the distribution of cell density in the disc is similar to the patterns of GAG and water content distributions in the disc at much later stages (e.g., 10 years later), see Figures 2–4 and 6–7. It also explains that different nutritional supplies and pathways would result in distinctive patterns of disc degeneration. Knowledge of these patterns may help to diagnose disc degeneration in relation to poor nutrition supply. Quantitative imaging techniques like the T2-weighted magnetic resonance imaging (MRI) can be used to identify a decrease in disc height and a loss of water content in the disc, both suggestive of a loss of mass in the disc. Our predicted results in cases in which there has been a loss of nutrition supplies through the CEP-NP and/or AF periphery pathway (Figures 6B and 6D) are similar to those seen on MRI.31–34 Likely, poor-nutrition-related disc degeneration in the clinical patient falls on the spectrum between these two cases (i.e., Case 1 and Case 3). For these two cases, the poor-nutrition-related disc degeneration was predicted to start at the middle axial plane of the disc, where the water content was lower than the surrounding regions, see Figure 8. This is consistent with the horizontal gray band seen in T2-weighted MRI images for degenerated discs.31 In addition, the higher water content zone predicted in Case 3 (shown in Figure 7D) is consistent with the High Intensity Zone (HIZ) seen in T2-weighted MRI images.35–38 The HIZ was initially proposed as a marker to diagnose low back pain,37,39 whereas it was also found in asymptomatic subjects later.38 Nevertheless, the results in this study clearly indicate that this zone is related to the disc degeneration in Case 3, which could be a radiographic marker for disc degeneration.35–38 Although the nature of the HIZ is still not clear, we speculate that the HIZ might be related to the geometry of degenerated discs. More studies are needed in order to understand this phenomenon.
In this study, there are several limitations. One limitation is that the GAG synthesis rate per cell (i.e., the value of λ1) in the present model was assumed to be uncoupled with cell metabolism. Assuming the synthesis of one disaccharide unit of the GAG molecule requires two glucose molecules, it is expected the consumption rate of glucose by cells should be greater than twice the rate of the GAG synthesis. In this study, this condition is satisfied with the value of λ1 from the literature.12 (data not shown)
Another limitation is that the mechanical loading in this study was assumed to be constant over time (i.e., the diurnal activity was not considered). Based on the study of the effect of dynamic loading on cell viability in the disc,13 consideration of diurnal activity would not affect the distinct patterns of cell density, and GAG content and water content distributions in relation to decreased nutrition supply. Other limitations of this study include the lack of a thin layer of CEP in the model; instead, its effect on nutrition transport was simulated by varying the nutrition level at the CEP-NP interface. Another limitation is that the intrinsic mechanical properties of the disc (Lame constants λ and μ) were assumed not to change with disc degeneration. This simplification would affect the value water content, however, its effect on degenerative patterns are not expected to be significant, because the spatial distributions of GAG and water contents are mainly determined by the spatial distribution of cell density, while the spatial distribution of cell density is determined by the nutrition environment. Thus, the simplifications on the mechanical properties are not significant on the spatial distributions of the cell density, GAG and water contents.
In summary, the effects of different nutritional supplies and pathways on the disc degeneration patterns (in terms of distributions of cell viability, GAG content, and water content) were quantitatively studied using a three-dimensional finite element model developed based on the cell-activity-coupled mechano-electrochemical multiphase mixture theory.9,12 The disc degenerative patterns were quantitatively predicted and linked to the levels and pathways of the nutrition supply. This study provides a better understanding of the mechanisms of poor nutrition related disc degeneration as well as new knowledge on the diagnosis of early disc degeneration.
Acknowledgments
The manuscript submitted does not contain information about medical device(s)/drug(s). NIH grant (AR066240) funds were received in support of this work. Relevant financial activities outside the submitted work: consultancy, grants, payment for lectures.
References
- 1.Luoma K, Riihimaki H, Luukkonen R, et al. Low back pain in relation to lumbar disc degeneration. Spine. 2000;25:487–492. doi: 10.1097/00007632-200002150-00016. [DOI] [PubMed] [Google Scholar]
- 2.Urban JP, Smith S, Fairbank JC. Nutrition of the intervertebral disc. Spine. 2004;29:2700–2709. doi: 10.1097/01.brs.0000146499.97948.52. [DOI] [PubMed] [Google Scholar]
- 3.Horner HA, Urban JPG. 2001 Volvo Award winner in basic science studies: Effect of nutrient supply on the viability of cells from the nucleus pulposus of the intervertebral disc. Spine (Phila Pa 1976) 2001;26:2543–2549. doi: 10.1097/00007632-200112010-00006. [DOI] [PubMed] [Google Scholar]
- 4.Urban J, Holm S, Maroudas A. Diffusion of small solutes into the intervertebral disc: as in vivo study. Biorheology. 1978;15:203–221. doi: 10.3233/bir-1978-153-409. [DOI] [PubMed] [Google Scholar]
- 5.Nachemson A, Lewin T, Maroudas A, et al. In vitro diffusion of dye through the end-plates and the annulus fibrosus of human lumbar inter-vertebral discs. Acta orthop. Scandinav. 1970;41:8. doi: 10.3109/17453677008991550. [DOI] [PubMed] [Google Scholar]
- 6.Ogata K, Whiteside LA. 1980 Volvo award winner in basic science. Nutritional pathways of the intervertebral disc. An experimental study using hydrogen washout technique. Spine (Phila Pa 1976) 1981;6:211–216. [PubMed] [Google Scholar]
- 7.van der Werf M, Lezuo P, Maissen O, et al. Inhibition of vertebral endplate perfusion results in decreased intervertebral disc intranuclear diffusive transport. Journal of anatomy. 2007;211:769–774. doi: 10.1111/j.1469-7580.2007.00816.x. [DOI] [PMC free article] [PubMed] [Google Scholar]
- 8.Rajasekaran S, Babu JN, Arun R, et al. ISSLS prize winner: A study of diffusion in human lumbar discs: a serial magnetic resonance imaging study documenting the influence of the endplate on diffusion in normal and degenerate discs. Spine (Phila Pa 1976) 2004;29:2654–2667. doi: 10.1097/01.brs.0000148014.15210.64. [DOI] [PubMed] [Google Scholar]
- 9.Zhu Q, Gao X, Gu W. Temporal changes of mechanical signals and extracellular composition in human intervertebral disc during degenerative progression. Journal of biomechanics. 2014;47:3734–3743. doi: 10.1016/j.jbiomech.2014.09.004. [DOI] [PMC free article] [PubMed] [Google Scholar]
- 10.Gu W, Zhu Q, Gao X, et al. Simulation of the Progression of Intervertebral Disc Degeneration due to Decreased Nutrition Supply. The spine journal : official journal of the North American Spine Society. 2014;39:6. doi: 10.1097/BRS.0000000000000560. [DOI] [PMC free article] [PubMed] [Google Scholar]
- 11.Buckwalter JA. Spine Update - Aging and Degeneration of the Human Intervertebral Disc. Spine. 1995;20:1307–1314. doi: 10.1097/00007632-199506000-00022. [DOI] [PubMed] [Google Scholar]
- 12.Gu WY, Zhu Q, Gao X, et al. Simulation of the Progression of Intervertebral Disc Degeneration Due to Decreased Nutritional Supply. Spine. 2014;39:E1411–E1417. doi: 10.1097/BRS.0000000000000560. [DOI] [PMC free article] [PubMed] [Google Scholar]
- 13.Zhu Q, Jackson AR, Gu WY. Cell viability in intervertebral disc under various nutritional and dynamic loading conditions: 3d finite element analysis. Journal of biomechanics. 2012;45:2769–2777. doi: 10.1016/j.jbiomech.2012.08.044. [DOI] [PMC free article] [PubMed] [Google Scholar]
- 14.Bibby SR, Urban JP. Effect of nutrient deprivation on the viability of intervertebral disc cells. Eur Spine J. 2004;13:695–701. doi: 10.1007/s00586-003-0616-x. [DOI] [PMC free article] [PubMed] [Google Scholar]
- 15.Bibby SRS. Cell Metabolism and Viability in the Intervertebral Disc. University of Oxford; 2002. [Google Scholar]
- 16.Sivan SS, Tsitron E, Wachtel E, et al. Aggrecan turnover in human intervertebral disc as determined by the racemization of aspartic acid. J Biol Chem. 2006;281:13009–13014. doi: 10.1074/jbc.M600296200. [DOI] [PubMed] [Google Scholar]
- 17.Gu WY, Yao H, Vega AL, et al. Diffusivity of ions in agarose gels and intervertebral disc: effect of porosity. Ann Biomed Eng. 2004;32:1710–1717. doi: 10.1007/s10439-004-7823-4. [DOI] [PubMed] [Google Scholar]
- 18.Gu WY, Yao H, Huang CY, et al. New insight into deformation-dependent hydraulic permeability of gels and cartilage, and dynamic behavior of agarose gels in confined compression. Journal of biomechanics. 2003;36:593–598. doi: 10.1016/s0021-9290(02)00437-2. [DOI] [PubMed] [Google Scholar]
- 19.Jackson AR, Huang CY, Brown MD, et al. 3D finite element analysis of nutrient distributions and cell viability in the intervertebral disc: effects of deformation and degeneration. Journal of biomechanical engineering. 2011;133:091006. doi: 10.1115/1.4004944. [DOI] [PMC free article] [PubMed] [Google Scholar]
- 20.Sun DN, Gu WY, Guo XE, et al. A mixed finite element formulation of triphasic mechano-electrochemical theory for charged, hydrated biological soft tissues. Int J Numer Meth Eng. 1999;45:1375–1402. [Google Scholar]
- 21.Maroudas A, Stockwell RA, Nachemson A, et al. Factors involved in the nutrition of the human lumbar intervertebral disc: cellularity and diffusion of glucose in vitro. Journal of anatomy. 1975;120:113–130. [PMC free article] [PubMed] [Google Scholar]
- 22.Urban JPG, Maroudas A. The measurement of fixed charge density in the intervertebral disc. Biochim Biophys Acta. 1979;586:166–178. [Google Scholar]
- 23.Selard E, Shirazi-Adl A, Urban JP. Finite element study of nutrient diffusion in the human intervertebral disc. Spine. 2003;28:1945–1953. doi: 10.1097/01.BRS.0000087210.93541.23. [DOI] [PubMed] [Google Scholar]
- 24.Urban J. Personal communication. 2001 [Google Scholar]
- 25.Crock HV, Goldwasser M. Anatomic studies of the circulation in the region of the vertebral end-plate in adult Greyhound dogs. Spine (Phila Pa 1976) 1984;9:702–706. doi: 10.1097/00007632-198410000-00009. [DOI] [PubMed] [Google Scholar]
- 26.Stefanovic-Racic M, Stadler J, Georgescu HI, et al. Nitric oxide and energy production in articular chondrocytes. Journal of cellular physiology. 1994;159:274–280. doi: 10.1002/jcp.1041590211. [DOI] [PubMed] [Google Scholar]
- 27.Hutton WC, Murakami H, Li J, et al. The effect of blocking a nutritional pathway to the intervertebral disc in the dog model. Journal of spinal disorders & techniques. 2004;17:53–63. doi: 10.1097/00024720-200402000-00011. [DOI] [PubMed] [Google Scholar]
- 28.Shirazi-Adl A, Taheri M, Urban JP. Analysis of cell viability in intervertebral disc: Effect of endplate permeability on cell population. Journal of biomechanics. 2010;43:1330–1336. doi: 10.1016/j.jbiomech.2010.01.023. [DOI] [PubMed] [Google Scholar]
- 29.Urban JPG, Mcmullin JF. Swelling Pressure of the Lumbar Intervertebral Disks - Influence of Age, Spinal Level, Composition, and Degeneration. Spine. 1988;13:179–187. doi: 10.1097/00007632-198802000-00009. [DOI] [PubMed] [Google Scholar]
- 30.Perie DS, Maclean JJ, Owen JP, et al. Correlating material properties with tissue composition in enzymatically digested bovine annulus fibrosus and nucleus pulposus tissue. Ann Biomed Eng. 2006;34:769–777. doi: 10.1007/s10439-006-9091-y. [DOI] [PMC free article] [PubMed] [Google Scholar]
- 31.Pfirrmann CW, Metzdorf A, Zanetti M, et al. Magnetic resonance classification of lumbar intervertebral disc degeneration. Spine (Phila Pa 1976) 2001;26:1873–1878. doi: 10.1097/00007632-200109010-00011. [DOI] [PubMed] [Google Scholar]
- 32.Griffith JF, Wang YX, Antonio GE, et al. Modified Pfirrmann grading system for lumbar intervertebral disc degeneration. Spine (Phila Pa 1976) 2007;32:E708–E712. doi: 10.1097/BRS.0b013e31815a59a0. [DOI] [PubMed] [Google Scholar]
- 33.Benneker LM, Heini PF, Anderson SE, et al. Correlation of radiographic and MRI parameters to morphological and biochemical assessment of intervertebral disc degeneration. Eur Spine J. 2005;14:27–35. doi: 10.1007/s00586-004-0759-4. [DOI] [PMC free article] [PubMed] [Google Scholar]
- 34.Hoppe S, Quirbach S, Mamisch TC, et al. Axial T2 mapping in intervertebral discs: a new technique for assessment of intervertebral disc degeneration. Eur Radiol. 2012;22:2013–2019. doi: 10.1007/s00330-012-2448-8. [DOI] [PubMed] [Google Scholar]
- 35.Sugiura K, Tonogai I, Matsuura T, et al. Discoscopic findings of high signal intensity zones on magnetic resonance imaging of lumbar intervertebral discs. Case reports in orthopedics. 2014;2014:245952. doi: 10.1155/2014/245952. [DOI] [PMC free article] [PubMed] [Google Scholar]
- 36.Peng B, Hou S, Wu W, et al. The pathogenesis and clinical significance of a high-intensity zone (HIZ) of lumbar intervertebral disc on MR imaging in the patient with discogenic low back pain. Eur Spine J. 2006;15:583–587. doi: 10.1007/s00586-005-0892-8. [DOI] [PMC free article] [PubMed] [Google Scholar]
- 37.Aprill C, Bogduk N. High-intensity zone: a diagnostic sign of painful lumbar disc on magnetic resonance imaging. The British journal of radiology. 1992;65:361–369. doi: 10.1259/0007-1285-65-773-361. [DOI] [PubMed] [Google Scholar]
- 38.Carragee EJ, Paragioudakis SJ, Khurana S. 2000 Volvo Award Winner in Clinical Studies - Lumbar high-intensity zone and discography in subjects without low back problems. Spine. 2000;25:2987–2992. doi: 10.1097/00007632-200012010-00005. [DOI] [PubMed] [Google Scholar]
- 39.Lam KS, Carlin D, Mulholland RC. Lumbar disc high-intensity zone: the value and significance of provocative discography in the determination of the discogenic pain source. Eur Spine J. 2000;9:36–41. doi: 10.1007/s005860050006. [DOI] [PMC free article] [PubMed] [Google Scholar]
- 40.Jackson AR, Huang CY, Gu WY. Effect of endplate calcification and mechanical deformation on the distribution of glucose in intervertebral disc: a 3D finite element study. Computer methods in biomechanics and biomedical engineering. 2011;14:195–204. doi: 10.1080/10255842.2010.535815. [DOI] [PMC free article] [PubMed] [Google Scholar]


