Abstract
Despite the long history of nanoparticulate calcium phosphate (CaP) as a non-viral transfection agent, there has been limited success in attempts to optimize its properties for transfection comparable in efficiency to that of viral vectors. Here we focus on the optimization of: (a) CaP nanoparticle precipitation conditions, predominantly supersaturation and Ca/P molar ratios; (b) transfection conditions, mainly the concentrations of the carrier and plasmid DNA; (c) the presence of surface additives, including citrate anion and cationic poly(L-lysine) (PLL). CaP nanoparticles significantly improved transfection with plasmid DNA encoding enhanced green fluorescent protein (eGFP) in pre-osteoblastic MC3T3-E1 cells compared to a commercial non-viral carrier. At the same time they elicited significantly lesser cytotoxicity than the commercial carrier. Plasmid DNA acted as a nucleation promoter, decreasing the nucleation lag time of metastable CaP solutions and leading to a higher rate of nucleation and a lower size of the precipitated particles. The degree of supersaturation (DS) of 15 was found to be more optimal for transfection than that of 12.5 or 17.5 and higher. Because CaP particles precipitated at DS 15 were spherical, while DS 17.5 and 21 yielded acicular particles, it was concluded that spherical particle morphologies were more conducive to transfection than the anisotropic ones. Even though the yield at DS 15 was 10 and 100 times lower than that at DS 17.5 and 21, respectively, transfection rates were higher using CaP nanoparticle colloids prepared at DS 15 than using those made at higher or lower DS, indicating that the right particle morphology can outweigh the difference in the amount of the carrier, even when this difference is close to 100x. In contrast to the commercial carrier, the concentration of CaP-pDNA delivered to the cells was directly proportional to the transfection rate. Osteosarcoma K7M2 cells were four times more easily transfectable with CaP nanoparticles than the MC3T3-E1 cells. The addition of citrate increased the transfection rate at lower concentrations; however, a complete redispersal of CaP-pDNA nanoparticles at higher concentrations of citrate coincided with a complete diminishment of transfection, implying the benefits of partial aggregation of CaP nanoparticles carrying pDNA. In contrast, PLL delayed transfection initially, but enhanced it at longer time points (≥ 96 h), leading to the conclusion that both citrate and PLL could exert positive effects on transfection: citrate if added at low concentrations and PLL to extend transfection over longer periods of time.
Keywords: Calcium phosphate, Citrate, Confocal microscopy, Gene delivery, Hydroxyapatite, Immunofluorescence, Nanoparticles, Plasmid DNA, Poly(L-lysine), Transfection
Graphical Abstract
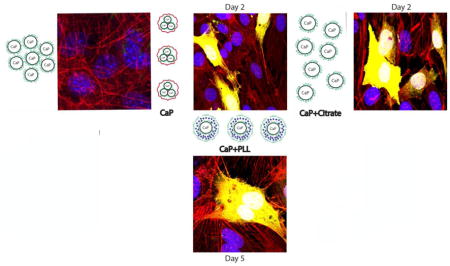
1. Introduction
Transfection is the process of introducing exogenous genetic material into the cell and is extensively investigated due to its potential therapeutic uses [1]. Traditionally viral vectors are used to ensure high transfection efficiencies; however, risks associated with viral gene delivery include the elicitation of immunogenic responses, toxicity, insertional mutagenesis and the limited amount of DNA transportable by the carrier [2]. To overcome these issues, non-viral methods have been developed to artificially deliver DNA to cells, including direct injection [3], electroporation [4], and the use of particulate carriers, e.g., polymeric particles [5], cationic polymeric micelles [6], ionic lipids [7], and inorganic particles, the most prospective of which have been calcium phosphates (CaP) [8]–[10].
The use of CaP as a transfection agent is justified by the fact that it is inexpensive, nontoxic, biocompatible, bioactive, easily synthesizable and degradable in the early lysosome [11]. CaP is also a component of all hard tissues in the body and will degrade to ions present in all cells and extracellular fluids, which also makes it a safe and biocompatible material for intracellular delivery. The first major advantage of CaP over other inorganic particles for this therapeutic application comes from its high loading capacity. Thanks to the highly charged ionic surface species (Ca2+ and PO43−), CaP can bind to an array of organics. Alternation between Ca2+ and PO43− species also endows CaP with a large surface charge density, making it similar to viral capsids, which owe their penetrability of the cell membrane to one such charge density that is variable in sign on the atomic scale but also comparable in magnitude to that of DNA [12]. Secondly, DNA-loaded CaP particles (CaP-DNA) are taken up by the cells through caveolae- and clathrin-mediated endocytoses [13]. Once internalized, CaP-DNA is expected to remain stable in the early through late endosome until its transition to the acidic lysosome (pH ~4) [14], at which point CaP particles start to dissolve. The release of constituent ions raises the osmotic pressure inside the lysosome, causing the vesicle to burst and release the nucleic acid cargo into the cytosol before its premature degradation in the late lysosome[11], [13].
Nanoparticles have been investigated as the most prospective non-viral transfection carriers for gene therapies. However, nanoparticle aggregation can significantly reduce the transfection efficiencies [15]–[17]. Therefore, we wanted to test if citrate, a strong dispersant [18], would increase the efficiency of transfection by stabilizing CaP particles in suspension. The great majority (~ 80 %) of citrate ions resides in bone, where they account for 5.5 wt% content of its organic component or ~ 1.6 wt% overall [19] and where they coat the plate-shaped CaP crystals, facilitating their dispersal within the collagenous matrix of bone [20]. Their positive effect on necrotic bone regeneration when delivered in a polymeric form and in combination with CaP has also been noted [21]. The rationale for the use of poly(L-lysine) (PLL) is following: since cationic polymers were previously used as transfection agents [22]–[24] and viral vectors are highly effective in part due to the positively charged glycosidic moieties of the capsid shell, we wished to determine if adding a positively charged polypeptide to CaP would improve the transfection rate. PLL has been previously used as a functional surface coating [25] and to deliver drugs [26], [27] and DNA [22]–[24]. Moreover, PLL is capable of disrupting the cell membrane[22], allowing for an easier passage of pDNA-loaded particles into the cytoplasm.
2. Materials and methods
2.1. Synthesis of CaP-pDNA, CaP-pDNA-PLL and CaP-pDNA-citrate particles
Two precursor solutions were made in identical volumes, one containing 250 mM CaCl2 (Sigma-Aldrich) and 50 μg/ml plasmid DNA (pDNA) encoding for enhanced green fluorescent protein (eGFP) and the other one containing varying amounts of NaH2PO4 (Sigma-Aldrich), 140 mM NaCl (Sigma-Aldrich) and 50 mM HEPES (pKa =7.5, Life Technologies). pH of the NaH2PO4 solution was set to 7 unless noted otherwise. pDNA did not affect pH in the system. The precursor solution containing CaCl2 was added drop-wise to the one containing NaH2PO4, which was being continuously vortexed at 1000 rpm. For synthesis of CaP-pDNA particles combined with PLL or citrate, the CaCl2 solution contained different concentrations of either PLL (70–150 kDa, Sigma-Aldrich) or citric acid monohydrate (Fisher-Scientific).
The degrees of supersaturation (DS) of solutions precipitating CaP-DNA were calculated using an algorithm based on Debye-Hückel equation[28]:
| (Eq.1) |
where Q is the ionic activity product of the solution, and Ksp is the solubility product of the CaP phase precipitated in this study, hydroxyapatite (Ca5(PO4)3OH, HAp), the negative logarithm of which was taken as equal to 58.65. Activity coefficients were calculated through logγ = − Azi2/(I1/2 + Bai), where zi is the charge number of ion species i, I is the ionic strength of the solution, A is a temperature-dependent constant equal to 0.5115 at 25 °C. B and ai are, like A, constants depending on temperature, dielectric constant of the solution and Debye screening length; ai = 6 × 10⁻⁸ for Ca2+; 9 × 10⁻⁸ for H+; and 4 × 10⁻⁸ for HxPO4x-3/CaH2xPO42x-1 ions. Appropriate dissociation constants for H2O, HxPO4x-3, HxCO3x-2 and HF and association constants for CaHxPO4x-1, CaHxCO3x and Ca---OH were taken into account as functions of pH[28]. Table 1 summarizes the different ionic concentrations used to obtain DS of solutions precipitating CaP-DNA nanoparticles at 20°C and the background ionic strength of 140 mM. Different DS values were obtained by varying [HxPO4x-3] and keeping [Ca2+] constant. Ca/P molar ratio was altered by maintaining constant [Ca2+] to ensure the approximate similarity of CaP yield under different DS conditions.
Table 1.
Different degrees of supersaturation (DS), ionic concentrations, pDNA concentrations, pDNA-CaP binding efficiencies, yield of the solid phase, crystallinity of phases (HAp = hydroxyapatite; DCP = brushite), and initial and final pH values of the solutions from which CaP-pDNA nanoparticles were precipitated.
| DS | Initial [Ca2+] (mM) | Initial [HxPO4x-3] (mM) | Ca/P molar ratio | Initial [pDNA] (μg/ml) | pDNA- CaP binding efficiency (%) | pH of the precipitating solution | pH of the final solution | Yield (g/dm3) | Average crystallite size (nm) |
|---|---|---|---|---|---|---|---|---|---|
| 12.5 | 125 | 0.1 | 1.25 × 10³ | 25 | 25.36 ± 6.56 | 7 | 7 | n.a. | n.a. |
| 15 | 125 | 0.7 | 178 | 25 | 93.3 ± 0.6 | 7 | 7 | 0.5 | 14.5 (HAp) |
| 17.5 | 125 | 4.5 | 27.8 | 25 | 99.47 ± 0.92 | 7 | 6.6 | 6 | 15.4 (HAp) |
| 21 | 125 | 30 | 4.2 | 25 | 97.07 ± 0.61 | 7.3 | 5.8 | 42 | 11.9 (HAp) & 55.4 (DCP) |
2.2. Characterization of CaP-pDNA, CaP-pDNA-PLL and CaP-pDNA-citrate
Scanning Electron Microscopy (SEM) was performed on a JEOL JSM 6320F-FESEM operated at 1 – 4 kV voltage range and 8μA beam current. ImageJ (NIH, Bethesda, MD) was used to derive the particle size and aspect ratio histograms from SEM images. Zeta potential and hydrodynamic diameters of particles in suspension were measured using a Zetasizer Nano-ZS (Malvern) dynamic light scattering (DLS) device and the data were plotted as number distributions to minimize for the effect of intense scattering from large entities. X-Ray Diffraction (XRD) was carried out on a Bruker D2 Phaser diffractometer in 23 – 90° 2θ range. The Scherrer equation applied on the most intense reflections for a given phase in the 2θ range used - (211) at 31.86 ° for HAp and (141) at 29.17 ° for brushite - was used to estimate the average crystallite size from the diffraction peak half-widths in DIFFRAC.EVA software.
2.3. Binding of pDNA to CaP
Binding of pDNA to CaP particles was determined using a Nanodrop 2000 Spectrophotometer (Thermo Scientific). 500 μl of suspension containing CaP-pDNA, CaP-PLL-pDNA or CaP-citrate-pDNA were centrifuged at 4 °C for 1 h at 14,000 rpm. The binding efficiency was determined as the average of three independent measurements using the following equation: , where B is the binding efficiency, pDNAtotal is the total amount of pDNA added to the system, and pDNAsupernantant is the amount of unbound pDNA in the supernatant.
2.4. In vitro transfection studies
K7M2 murine osteosarcoma cells (ATCC) and MC3T3-E1 subclone 4 pre-osteoblastic murine calvarial cells (ATCC) were cultured at 37°C and 5% CO2 in MEM-α (Gibco) and DMEM (Gibco) media, respectively, with 10 % FBS and 1 % antibiotic-antimycotic (Gibco) to prevent bacterial and fungal contamination. Cells were seeded at 5 × 10⁴ cells/well in 24-well plates and transfected 24 hours later with the addition of 1, 0.5 and 0.25 μg of eGFP plasmid loaded onto CaP in suspension. Transfections were performed in triplicate and compared to jetPRIME (Polyplus), a non-liposomal, polycationic commercial transfection agent used according to manufacturer’s instructions. Fluorescence of expressed eGFP was measured using a microplate reader (FLUOstar Omega, BMG LABTECH). The cells were excited at 485 nm and the emissions were detected at 520 nm.
2.5. Immunofluorescent staining and confocal microscopy
Cells were fixed and stained 2 days post-transfection for nucleus, f-actin, eGFP, and CaP. They were fixed for 5 minutes in 4 % paraformaldehyde (PFA) and washed 3 × 10 min in PBS. Cells were blocked at room T for 1 h in blocking solution (2 % bovine serum albumin, 0.5 % Triton-X in PBS). Cells were then incubated in rabbit anti-GFP 1:400 (AbCam) either overnight at 4°C or for 1 h at room temperature. After primary incubation, cells were rinsed 3 x with PBS and 1 x with OsteoImage wash buffer. Alexa 633 secondary antibody (1:400), Alexa Fluor 568 phalloidin (1:400) and OsteoImage reagent (1:100) were then added and incubated for 1 h at room T. After incubation, cells were washed 3 × 5 min with OsteoImage wash buffer. Cells were then incubated in NucBlue® Fixed Cell ReadyProbesTM reagent (Molecular Probes, Life Technologies) for 5 – 10 min, rinsed in PBS and mounted.
2.6. MTT viability assay
MTT (3-(4,5-Dimethylthiazol-2-yl)-2,5-Diphenyltetrazolium Bromide) solution was prepared according to the manufacturer’s instructions (VybrantR MTT Cell Proliferation Assay Kit V-13154). Cells were plated and transfected as described in section 2.5. On days 2 and 5 the assay was performed according to manufacturer’s instructions and absorbance was measured at 540 nm using a microplate reader (FLUOstar Omega, BMG LABTECH).
3. Results and discussion
3.1. Synthesis and characterization of CaP-pDNA, CaP-pDNA-PLL and CaP-pDNA-citrate
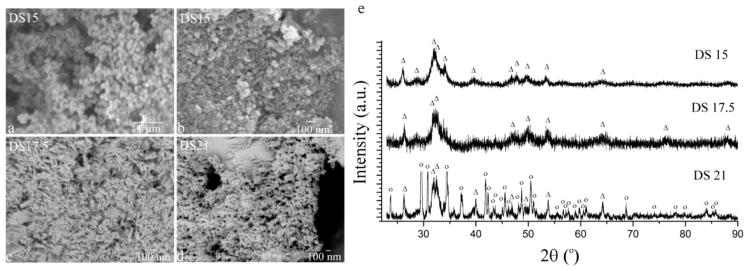
SEM images of bare CaP nanoparticles, CaP nanoparticles complexed with pDNA (CaP-pDNA) and CaP-pDNA nanoparticles synthesized in the presence of citrate or PLL are displayed in Fig. 1. Bare CaP particles were spherical and narrowly dispersed at DS 15, having the average size of 101.2 ± 17.3 nm. As DS increased, so did the proportion of elongated particles in the precipitate. Particles synthesized at DS 17.5 were a mixture of spherical and acicular morphologies, whereas those precipitated at DS 21 were completely acicular. Spherical CaP particles prepared at DS 17.5 were 16.2 ± 3.7 nm in diameter and finer than those made at DS 15. The dimensions of acicular CaP particles prepared at DS 17.5 and 21 equaled 69.3 ± 7.4 × 7.5 ± 1.7 nm and 317 ± 53 × 26.6 ± 6.2 nm, respectively, with the corresponding aspect ratios of 9.2 and 11.9. Overall, CaP particles prepared at DS 17.5 were smaller than those prepared at DS 15. However, contrary to the theoretical expectations, which inversely relate the particle size and supersaturation, particles made at DS 21 were larger than those made at DS 15 and DS 17.5. CaP is typified by very high nucleation rates and is mostly immune to the direct correspondence between DS and nucleation rate applicable to most other precipitates. The fact that CaP crystal growth is largely controlled by particle aggregation, starting already at the sub-nanoscale, makes the prediction of particle size from DS levels in the parent solution a difficult task.
Fig. 1.
(a) Scanning electron micrographs (a–d) and X-ray diffractograms (e) of CaP (a, e) and CaP-pDNA (b–d) nanoparticles synthesized at different DS values. Reflections originating from HAp are denoted with “Δ”, while those derived from brushite are denoted with “o”.
X-ray diffractograms demonstrate the monophasic nature of CaPs made at DS 15 and 17.5 and biphasic nature composed of HAp and brushite when made at DS 21 (Fig. 1e). Precipitation of HAp entails the capture of free hydroxyl ions from the solution and their binding within the crystal lattice, while at this highest concentration of ionic growth units (DS 21) the resulting drop in pH surpasses the buffering capacity of 50 mM HEPES set to pH 7.3. As a result, the first phase to precipitate at DS 21 is HAp; brushite begins to precipitate instead of HAp once the pH drops below ~ 6.8, resulting in a biphasic composition at the final pH of 6.3 (Table 1). Crystallinity of brushite was higher than that of HAp, the latter of which only mildly decreased, from 15.4 to 11.9 nm, as DS increased from 17.5 to 21 (Table 1), this time going in line with the aforementioned theoretical expectations. Still, the independence of crystallinity on DS in the lower DS range reconfirms the complexity of precipitation pathways followed by CaP.
CaP particles prepared at DS 15 remained spherical and monodisperse when complexed with pDNA, but their average size dropped from 101.2 ± 17.3 nm to 15.9 ± 4.4 nm. DNA can act as a nucleation-promoting agent because of its triply charged phosphates that can complex Ca2+ from the solution. Consequently, DNA increased the nucleation rate and decreased the size of the resulting particles. This was also evidenced by the ability of pDNA to decrease the nucleation lag time in metastable CaP solutions; at DS 12, e.g., no precipitation was observed unless pDNA was present, in which case the “crashing” of the solution was immediate. Despite the highly charged nature of DNA, the tendency for primary CaP-pDNA particles to aggregate was obvious from SEM images and was corroborated in the DLS analysis of CaP-pDNA colloids, which resulted in the particle size of 233 ± 32 nm. The particle size distribution was bimodal, with another peak, contributed to by ~ 12 % of particles in the system, being observed at 1.87 ± 0.43 μm, suggesting the coexistence of smaller and larger agglomerates. Elevating the pH to 11 deprotonated the surface to some extent and provided a better electrostatic charge repulsion, dropping the particle size down to 191 ± 30 nm, though indicating that surface charge effects in the absence of steric repulsion are not enough to disperse the primary particles despite their comparatively high surface charge density. CaP-pDNA sols lacked the 10-nm size peak derived from dissolved eGFP plasmids and detected in pure pDNA solutions, demonstrating that pDNA was bound to CaP particles (Fig. 2a). The addition of PLL did not significantly affect the particle size, nor the bimodal distribution, with the major peak at 263 ± 65 nm and the minor one at 1.26 ± 0.56 μm. PLL dispersions displayed the particle size maximum at 4.7 ± 1.3 nm, agreeing with the estimate of the molecular size from the 70 – 150 kDa Mw range: 3.66 – 5.07 nm. The absence of this peak in CaP-pDNA-PLL suggested no phase separation of polymeric and ceramic components. The addition of citrate confirmed its role as a dispersant, as the size of both CaP-pDNA and CaP decreased in direct proportion to its concentration. At low concentrations of citrate, i.e., 10 and 100 μM, the agglomerates of CaP-pDNA are still present. However, at 1 mM, the average particle size decreases down to 10 nm, suggesting the breaking of nanoparticle agglomerates and the resuspension of nanoparticles in the medium. Citrate ions did not redisperse CaP particles as well as CaP-pDNA ones, the reason being the partially dispersive role that pDNA itself plays owing to its highly electrostatically charged nature. As a result, the particle size observed following the addition of 10 mM citrate to CaP only was 170 nm, compared to 28 nm for CaP-pDNA (Fig. 2b).
Fig. 2.
(a) Particle size distributions of pDNA and PLL and of their combinations with CaP obtained using dynamic light scattering at different pH values. (b) The effect of the concentration of citric acid on the average particle size of CaP and CaP-pDNA in suspension.
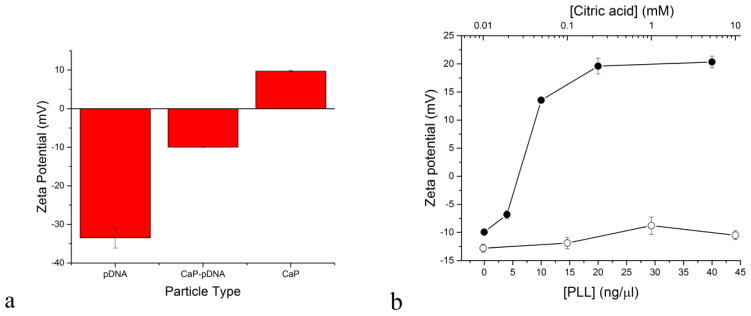
Surface charge is an important determinant of cell permeability and the efficiency of transfection [29]–[31]. As seen from Fig. 3a, at pH 7, zeta (ζ) potential, which is directly indicative of surface charge, was 9.7 ± 0.8 mV for pure CaP sol, − 33.5 ± 2.6 mV for pure pDNA sol, and − 10.7 ± 0.8 mV for CaP-pDNA sol. Together with the absence of the pDNA size peak in the DLS analysis of CaP-pDNA, these results confirm the formation of stable CaP-pDNA complexes. Still, neither did the ζ potential of CaP nor that of CaP-pDNA reach the 15–30 mV metastable range in which moderate colloidal stability could be ensured. With the ζ potential below +− 15 mV, the particles are severely unstable and susceptible to aggregation, as evidenced during the particle size analysis. With the addition of PLL to CaP-pDNA, ζ potential increased due to the polycationic nature of the polymer, indicating its binding to the CaP-DNA complex. Charge reversal from negative to positive takes place at ~ 7 ng/μl, whereas a surface saturation point is reached at ~ 20 ng/μl of PLL, with no further increase in ζ potential occurring with the addition of PLL. In contrast, as expected, the addition of anionic citrate maintains the negative charge on the particles (Fig. 3b). Any co-localization of citrate anions in the double charge layer together with free hydroxyl groups does not induce charge imbalance and retains the negative surface charge of the particle at the shear plane.
Fig. 3.
Zeta potential of pure CaP, pure DNA and CaP-DNA complexes at pH 7 (a). The effect of varying the concentration of PLL (-●-) and citrate (-○-) during the precipitation of CaP-pDNA particles on their zeta potential (b). Data are shown as averages with error bars representing standard deviation.
3.2. In vitro transfection with eGFP using CaP-pDNA
The efficiency of transfection of MC3T3-E1 cells was quantified as the fluorescence intensity of eGFP expressed by the cells. As shown in Fig. 4a, the transfection efficiency of CaP-pDNA exceeds that of the commercial transfection agent, jetPRIME at all but the lowest concentration of pDNA delivered (0.25 μg/well). At 1 and 0.5 μg of pDNA per well, the transfection efficiency of CaP is at most time points by more than an order of magnitude higher than that of jetPRIME, showing that CaP outperforms jetPRIME when high loading capacity is required from the vehicle. In fact, a typical weakness of commercial non-viral carriers is their limited loading capacity; however, when higher concentrations of the carrier were employed to cope with this issue in this study, reduced confluency resulted and was directly proportional to the concentration of the carrier. In contrast, such detrimental effects were not seen in transfections with CaP-pDNA complexes. The percentage of cells transfected using CaP-pDNA on day 2 was 37 ± 5 %, lower than 56 ± 12 % for jetPRIME. However, the increased transfection rate of jetPRIME resulted in lowered cell viability. The number of viable cells on days 2 and 5 was significantly higher in wells containing cells transfected using CaP-pDNA than in those transfected using jetPRIME (Fig. 4b) and there was also no significant decrease in cell viability compared to the control population following transfection with CaP-pDNA (Fig. 4b). Also, whereas increasing the amount of pDNA complexed with jetPRIME resulted in decreased transfection rate, the opposite effect was seen for CaP (Fig. 4a). Still, a saturation point for transfection is reached between 0.5 and 1μg of pDNA per well, with larger concentration of pDNA failing to result in statistically significant increases in the transfection efficiency. Interestingly, the greater the amount of pDNA, the later the fluorescence intensity peaks: on day 2 when 0.25 μg of pDNA is used, day 3 when 0.5 μg is used, and day 4 when 1 μg is used. In all cases, the drop in the fluorescence intensity following its peaking between days 2 and 4 is more gradual than the rise from nanoparticle transfection at day 0. Ca/P molar ratio is another synthesis parameter that affects the properties of CaP precipitates [32]. Ultrahigh Ca/P molar ratios are employed to minimize the effects of Ca2+-pDNA complexation on supersaturation, yet the most optimal Ca/P molar ratio was found to be ~ 170 and was routinely used in CaP-pDNA transfections [17], [33], [34]. The effects of other transfection parameters, including the duration of nanoparticle incubation and minor changes in precursor solution compositions, are listed in the supplementary section. Replacing HEPES from HxPO4x-3 to Ca2+ precursor increased the transfection rate, demonstrating that organic buffers play a more intricate surface or complexing role than merely maintaining steady pH. This is in agreement with previous reports, including the one where the use of organic Tris and of inorganic phosphates as buffers led to precipitation of thoroughly different CaP phases [35]. Eliminating NaCl and precipitating CaP-pDNA at zero background ionic strength also increased the transfection rate, the reason being the absence of Na+ ions, potent nucleation inhibitors when it comes to formation of apatite. The absence of Na+ ions lowers the nucleation lag time and speeds up the precipitation of apatite [36], which may increase the yield and, thus, the transfection capacity of the sol. Drug release from CaP carrier is known to differ depending on whether the release is assessed in SBF or PBS [37]; likewise, the interaction between pDNA and CaP is expected to be affected by even the most minor changes in the ionic strength of the medium. Finally, different cell types transfect with different efficiencies: e.g., MC3T3-E1 more difficultly than HeLa [33], HEK293 easier than primary lymphocytes [38]. Here we demonstrate that osteosarcoma K7M2 cells show an almost four times higher fluorescence intensity than the pre-osteoblastic MC3T3-E1 cells following transfection with CaP nanoparticles (Fig. 4c).
Fig. 4.
(a) Fluorescence intensity as a measure of the transfection of MC3T3-E1 cells depicted as a function of time and of different amounts of two different types of gene delivery carriers added per well (i.e., 5 × 10⁴ cells): CaP synthesized at DS 15 and jetPRIME. (b) Viability of MC3T3-E1 cells transfected using different carriers, including CaP-pDNA-PLL at 20 ng/μl of PLL and CaP-pDNA-citrate at 10 mM of citrate. The amount of jetPRIME and CaP was normalized so as to deliver the identical amount of 0.5 μg of pDNA to each well seeded with cells. (c) Difference in the mean fluorescence intensity as a measure of the transfection of MC3T3-E1 and K7M2 cells on the 3rd day of transfection using CaP-pDNA synthesized at DS 15 and delivering 1 μg pDNA per well. Data are shown as averages with error bars representing standard deviation.
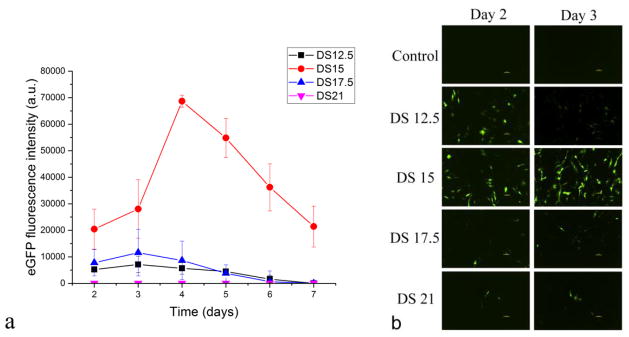
Supersaturation of the solution precipitating CaP-pDNA was optimized to improve the transfection rate. To that end, four different precipitates, whose DS of the parent solution ranged from 12.5 to 21, were compared (Table 1). This range was chosen so as to have the metastable conditions typical for simulated body fluid on the low DS end and conditions yielding abrupt precipitation on the high DS end. Interestingly, as DS increases from 12.5 to 15, a multifold increase in the transfection efficiency occurs (Fig. 5). This is partly due to the 3.6 times higher binding efficiency of pDNA to CaP measured at DS 15 compared to DS 12.5 (Table 1). Further increases in DS, however, lead to decreased transfection efficiency despite almost complete binding of pDNA to CaP synthesized in the DS range of 15 – 21. Transfection using the precipitate yielded at DS 17.5 is, thus, insignificantly higher than that at DS 12.5. Further increases in DS result in little to no transfection, suggesting the optimality of supersaturation conditions at DS = 15, the approximate boundary between the metastable and unstable solutions. The influence of DS on transfection efficiencies can be explained also by morphological differences. DS 15 yields spherical particles and high transfection rate, whereas DS 17.5 and 21 yield acicular particles and low transfection rates, suggesting that spherical particle morphologies are more conducive to transfection than anisotropic ones.
Fig. 5.
(a) The effect of the degree of supersaturation (DS) of the solution precipitating CaP-DNA on the efficiency with which MC3T3-E1 cell line is being transfected using these particles. Data are shown as averages with error bars representing standard deviation. (b) Live fluorescent imaging of cells glowing in green following transfection with eGFP using CaP-pDNA prepared at different DS values.
Synthesis yield under different DS values and Ca/P ratios increased by 1 and 2 orders of magnitude as DS increased from 15 to 17.5 and 21, respectively (Table 1). The fact that transfection using colloids made at DS 15 was with 10–100 times lower yield than using those precipitated at DS 17.5 and 21, and yet was significantly better than using colloids made at any higher or lower DS indicates that particle morphology is more important than the amount of carrier. That this effect is not solely due to a difference is pDNA binding efficiency is seen from Table 1: for CaP synthesized at DS 15, pDNA binding efficiency was 93.3 ± 0.6 %, lower than for those made at DS 17.5 and 21: 99.47 ± 0.92 and 97.07 ± 0.61 %, respectively. Excessive size can prevent particles from undergoing clathrin- and caveolae-mediated endocytosis [39], but that this effect is neither due to the size difference is demonstrated by the comparable longest dimension of particles made under all three DS values > 15.
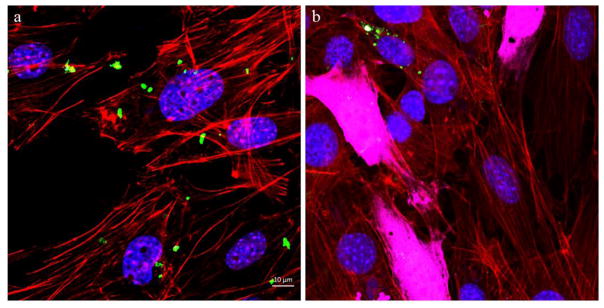
Confocal optical images of MC3T3-E1 cells transfected by CaP-pDNA are shown in Fig. 6. Intracellular uptake of the particles is required before eGFP plasmid can be released into the cytosol and transported to the nucleus for the transcription. Fig. 8a shows the presence of fine nanoparticle conglomerates inside the transfected cells, whereas Fig. 8b demonstrates the subsequent expression of the florescent protein.
Fig. 6.
Confocal optical images of MC3T3-E1 cells subjected to a CaP-pDNA nanoparticle treatment (1μg of pDNA per well) (a) and of transfected MC3T3-E1 cells expressing eGFP (b). The images show CaP-pDNA particles stained in green, f-actin stained in red, eGFP stained in purple, and the cell nuclei stained in blue.
Fig. 8.
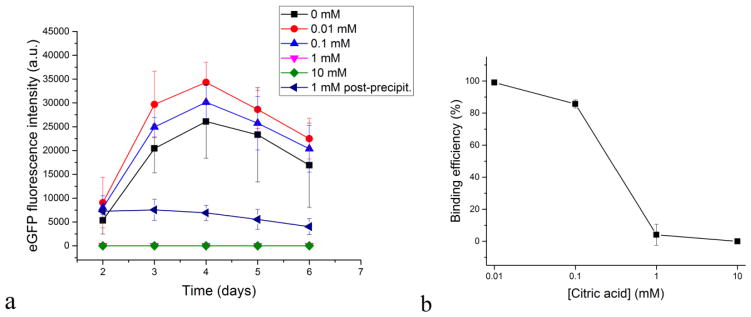
The effect of the addition of citrate in different concentrations to CaP-DNA particles on the fluorescence of MC3T3-E1 cell line transfected with GFP using these particles (a) and pDNA-CaP binding efficiency as a function of the concentration of citric acid (b). Data are shown as averages with error bars representing standard deviation.
3.3. In vitro transfection with eGFP using CaP-pDNA-PLL and CaP-pDNA-citrate
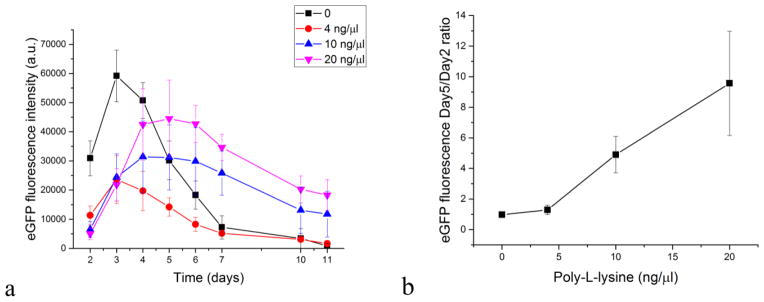
The addition of PLL at 4 – 20 ng/μl did not enhance transfection rates in the first four days following the treatment with CaP-pDNA-PLL nanoparticles. However, after day 4, eGFP expression was consistently higher compared to PLL-free carriers (Fig. 7a). Therefore, the most obvious effect of PLL is to extend the transfection rate over longer periods of time. This long-term effect of PLL on transfection is shown in Fig. 7b where the ratio of fluorescence from eGFP between days 5 and days 2 displays a steady increase as a function of the concentration of PLL added to the CaP-pDNA nanoparticle systems. Owing to its intense positive charge, PLL binds strongly to surfaces and molecules and could hinder the release and unpacking of negatively charged pDNA [5], delaying the peak of transfection to later time points. Excluding CaP from the carrier composition and treating cells with PLL-pDNA resulted in no transfection, demonstrating the essentiality of the role that CaP and its ionic components, predominantly free Ca2+ ions, play in the gene delivery process.
Fig. 7.
The effect of the addition of PLL in different concentrations to CaP-DNA particles on the fluorescence of MC3T3-E1 cell line transfected with GFP using these particles (a) and the ratio between the eGFP fluorescence on days 5 and 2 as a function of the concentration of PLL in CaP-pDNA-PLL (b). Data are shown as averages with error bars representing standard deviation.
The addition of citrate at 0.01 – 10 mM increased the transfection efficiency at lower concentrations (0.01 and 0.1 mM), but dropped it to zero at higher concentrations (1 and 10 mM) (Fig. 8a). As seen from Fig. 2b, citrate disperses CaP-pDNA particles only at concentrations greater or equal to 1 mM, which is the same concentration at and above which no transfection occurs. This is partly due to low pDNA-CaP binding efficiency at 1mM or higher concentrations of citrate. As seen from Fig. 8b, this binding efficiency drops from 99.07 ± 1.01 % for 0.01 mM of citrate to 85.73 ± 2.54 % for 0.1 mM and 4.13 ± 6.50 for 1 mM. With the size of a single DNA plasmid equaling ~ 10 nm (Fig. 2a), this means that breaking CaP agglomerates using citrate anions down to a similar range of sizes (~ 10 nm) obstructs pDNA binding and that moderate agglomeration of CaP is required for transfection to occur. If CaP particles contact cells as singlets, endocytosis may not occur. Another possibility is that cell monolayers come into a lesser contact with CaP-pDNA when the particles are well dispersed and there is no sedimentation. This effect, where agglomeration of nanoparticles is either required for uptake [40], [41] or leads to a better uptake compared to fully dispersed systems [42], has been observed earlier. It suggests that the most potent colloids for transfection are those at the boundary between the unstable and the metastable ranges. Similar to erythrocytes whose ζ potential of −15 mV [43] places them at one such boundary, making them unstable enough to coagulate around an open wound, but also stable enough not to spontaneously form a clot, colloids with a high potential for transfection must be stable enough not to segregate into ineffective flocculates, yet unstable enough to form sediments and fine agglomerates capable of reaching the cell surface and be endocytosed. And if local sedimentation of nanoparticles is required for endocytosis, then perfectly stable colloidal dispersions in transfection would not be that perfect from a practical standpoint [44]. Poor colloidal stability due to aggregation, often cited as the critical weakness of CaPs in gene delivery [45], may, in fact, be the key to their excellent performance in this context, provided that it is controlled to some extent.
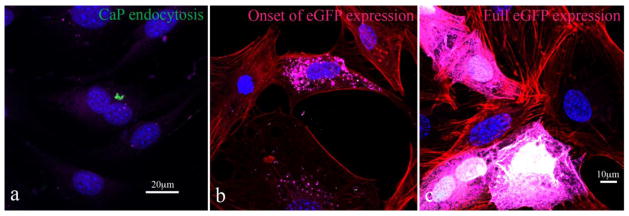
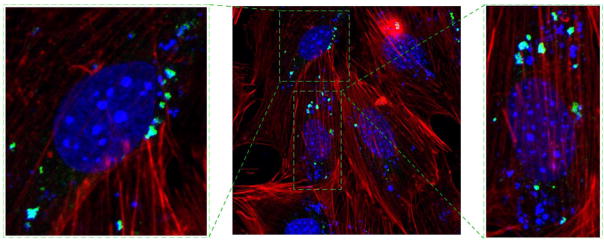
Zeta potential values indicate that citrate disperses CaP-pDNA particles and does not replace DNA from the surface of CaP. Specifically, while citrate produced no significant change in zeta potential of CaP-pDNA, it decreased the zeta potential of pure CaP while retaining its positive value (+ 2 mV at ≥ 1 mM). Interestingly, when 1 mM citrate is added to CaP-pDNA sol following precipitation, transfection is still noticeable, unlike in the case when citrate is present during precipitation of CaP-pDNA. The reason is that post-precipitation addition of citrate does not disperse CaP-DNA particles as much as when the anion is present in the solution during precipitation. Also, the transfection efficiency was better at the lowest concentration of citrate (0.01 mM) than at the highest one (0.1 mM) for which this augmentation effect was observed. This further indicates that moderate, not complete de-agglomeration is needed to maximize the efficiency of transfection using CaP-pDNA. As seen in Fig. 8a, the curve of the function of the transfection rate vs. time maintains the same shape, reaching the maximum at day 4, and is only shifted to higher values as transfection is improved at 0.01 and 0.1 mM of citrate. The ratio between eGFP fluorescence on days 5 and 2 remains constant as the concentration of citrate is increased. This is unlike the effect PLL had on the change of the transfection rate with time (Fig. 7). Transfection with citrate had a higher ratio of transfection on day 5 and day 2 than that with PLL, but was unaffected by concentration. Immunofluorescent images show the timeline of transfection events, from endocytosis of CaP-citrate and CaP-PLL carriers to the onset of eGFP expression to the complete pervasion of the transfected cells with the fluorescent signal (Figs. 9–10). Finally, while the addition of PLL did not significantly decrease cell viability, the addition of citrate did, though only on day 2; by day 5, cell viability recovered and was equal to control populations (Fig. 4b). Citric acid has been previously reported not to be toxic to MC3T3-E1 cells [46]. Therefore, one possibility is that greater transfection enabled by the citrate anion results in moderate, short-term cytotoxicity from which cells fully recover (Fig. 4b) because excessive penetration of DNA into the cell can cause its accumulation in cell membrane and organelles other than nucleus [47] where it may exert a toxic and apoptotic effect on the cell [48]. The decrease in viability may also be due to the augmented differentiation of MC3T3-E1 cells into an osteoblastic phenotype and a corresponding decrease in the proliferation rate [46] in case citric acid plays a similar role as that of ascorbic acid in promoting the differentiation of this particular cell line. This is especially so since osteoblasts are known to express citric acid [49], an essential component of bone microarchitecture.
Fig. 9.
Confocal optical images of MC3T3-E1 cells subjected to a CaP-pDNA-citrate nanoparticle treatment (1μg of pDNA per well) showing the timeline of transfection events: (a) CaP particles (green) are endocytosed and are seen in the vicinity of the nucleus (blue), at which stage they have already delivered their plasmid payload; (b) MC3T3-E1 cells are now transfected and the expression of eGFP (purple) has begun; (c) the expression of eGFP within the transfected MC3T3-E1 cells is now at its maximum and the transfected cells glow throughout their entire volume. The images show CaP-pDNA particles stained in green, f-actin stained in red, eGFP stained in purple and the cell nuclei stained in blue.
Fig. 10.
Confocal optical images showing the intracellularly located CaP-PLL carriers (green) delivering eGFP plasmid (extranuclear blue) to MC3T3-E1 cell nuclei (blue) through the cytoplasmic (red – f-actin cytoskeletal microfilaments).
Conclusion
Owing to their variety of appealing properties, ranging from the high capacity for adsorption of nucleic acids to the ability to launch endosomal escape of plasmids to exceptional biocompatibility and bioresorbability, CaP nanoparticles are considered a viable non-viral gene delivery carrier. However, although CaP was first used as a non-viral vector for gene delivery in 1973[50], insufficient effort has been made since then to optimize its properties for more efficient and consistent transfection. Especially in the last two decades there has been little success in enhancing the efficacy of CaP for this therapeutic application. Although much work has been done to optimize the transfection process [16][33][51]–[53], there is still a vast room for improvement. One of the central limitations is the aggregation propensity of CaP nanoparticles and their low colloidal stability. This difficulty in controlling the particle size using the basic principles of colloid chemistry is a major weak point that disfavors the use of CaP as a transfection agent. It is also thought that the low efficacy with which non-viral vectors enter the cell is the reason why viral vectors still retain the advantage over their non-viral counterparts, including CaP. If the passage across the cell membrane could be improved through precise optimization of CaP nanoparticle properties, it is hoped that the corresponding gene delivery efficacy could be made comparable to that of viral vectors, circumventing at the same time an array of risks and side effects associated with the use of viral agents.
Here we report on the optimization of some of the properties of CaP nanoparticles as colloidal gene carriers by varying selected precipitation and transfection conditions and investigating the effects of two separate additives, citric acid and PLL. As indicated by the DLS analysis, both citrate anion and PLL, along with pDNA, were localized within the hydrodynamic shear plane of CaP nanoparticles. CaP precipitation conditions, including supersaturation ratio, Ca/P molar ratio, ionic strength and other compositional parameters that defined the precursor solutions, all affected transfection in different ways. The same can be said for the variations in the transfection conditions, mainly the concentration of the carrier and of the genomic load, alongside the timescale of the treatment. Susceptibility to changes in properties depending on this plethora of conditions allowed for the optimization of CaP nanoparticles for a superior transfection compared to a commercial reagent, in terms of efficiency, cell viability and dosage flexibility. Plasmid DNA was also shown to act as a promoter of nucleation of CaP. Spherical CaP particle morphologies were more conducive to transfection than the anisotropic ones, while moderate agglomeration of CaP particles positively affected pDNA binding and the overall transfection process. Both types of surface additives, citrate and PLL, exerted positive effects on transfection when their concentrations were precisely optimized: while citrate enhanced transfection when added at low concentrations, PLL extended it over longer periods of time. The exploration of synergy between the two additives will be the subject of further studies.
Supplementary Material
Acknowledgments
NIH R00-DE021416 is acknowledged for support.
Footnotes
Publisher's Disclaimer: This is a PDF file of an unedited manuscript that has been accepted for publication. As a service to our customers we are providing this early version of the manuscript. The manuscript will undergo copyediting, typesetting, and review of the resulting proof before it is published in its final citable form. Please note that during the production process errors may be discovered which could affect the content, and all legal disclaimers that apply to the journal pertain.
References
- 1.Chira S, Jackson CS, Oprea I, Ozturk F, Pepper MS, Diaconu I, Braicu C, Raduly LZ, Calin GA, Berindan-Neagoe I. Progresses towards safe and efficient gene therapy vectors. Oncotarget. 2015 Oct;6(31):30675–30703. doi: 10.18632/oncotarget.5169. [DOI] [PMC free article] [PubMed] [Google Scholar]
- 2.Nayerossadat N, Maedeh T, Ali PA. Viral and nonviral delivery systems for gene delivery. Adv Biomed Res. 2012 Jul;1:27. doi: 10.4103/2277-9175.98152. [DOI] [PMC free article] [PubMed] [Google Scholar]
- 3.Hickman MA, Malone RW, Lehmann-Bruinsma K, Sih TR, Knoell D, Szoka FC, Walzem R, Carlson DM, Powell JS. Gene expression following direct injection of DNA into liver. Hum Gene Ther. 1994 Dec;5(12):1477–1483. doi: 10.1089/hum.1994.5.12-1477. [DOI] [PubMed] [Google Scholar]
- 4.Yoo JJ, Soker S, Lin LF, Mehegan K, Guthrie PD, Atala A. Direct in vivo gene transfer to urological organs. J Urol. 1999 Sep;162(3 Pt 2):1115–1118. doi: 10.1016/S0022-5347(01)68088-1. [DOI] [PubMed] [Google Scholar]
- 5.Aied A, Greiser U, Pandit A, Wang W. Polymer gene delivery: overcoming the obstacles. Drug Discov Today. 2013 Nov;18(21–22):1090–1098. doi: 10.1016/j.drudis.2013.06.014. [DOI] [PubMed] [Google Scholar]
- 6.Rinkenauer AC, Schallon A, Günther U, Wagner M, Betthausen E, Schubert US, Schacher FH. A Paradigm Change: Efficient Transfection of Human Leukemia Cells by Stimuli-Responsive Multicompartment Micelles. ACS Nano. 2013 Nov;7(11):9621–9631. doi: 10.1021/nn402072d. [DOI] [PubMed] [Google Scholar]
- 7.Srinivasan C, Burgess DJ. Optimization and characterization of anionic lipoplexes for gene delivery. J Controlled Release. 2009 May;136(1):62–70. doi: 10.1016/j.jconrel.2009.01.022. [DOI] [PubMed] [Google Scholar]
- 8.Hadjicharalambous C, Kozlova D, Sokolova V, Epple M, Chatzinikolaidou M. Calcium phosphate nanoparticles carrying BMP-7 plasmid DNA induce an osteogenic response in MC3T3-E1 pre-osteoblasts. J Biomed Mater Res A. 2015 Dec;103(12):3834–3842. doi: 10.1002/jbm.a.35527. [DOI] [PubMed] [Google Scholar]
- 9.Sun M, Bernard LP, DiBona VL, Wu Q, Zhang H. Calcium Phosphate Transfection of Primary Hippocampal Neurons. J Vis Exp. 2013 Nov;(81):e50808. doi: 10.3791/50808. [DOI] [PMC free article] [PubMed] [Google Scholar]
- 10.Uskoković V, Uskoković DP. Nanosized hydroxyapatite and other calcium phosphates: Chemistry of formation and application as drug and gene delivery agents. J Biomed Mater Res B Appl Biomater. 2011 Jan;96B(1):152–191. doi: 10.1002/jbm.b.31746. [DOI] [PubMed] [Google Scholar]
- 11.Lee D, Upadhye K, Kumta PN. Nano-sized calcium phosphate (CaP) carriers for non-viral gene deilvery. Mater Sci Eng B. 2012 Feb;177(3):289–302. [Google Scholar]
- 12.Lošdorfer Božič A, Šiber A, Podgornik R. How simple can a model of an empty viral capsid be? Charge distributions in viral capsids. J Biol Phys. 2012 Sep;38(4):657–671. doi: 10.1007/s10867-012-9278-4. [DOI] [PMC free article] [PubMed] [Google Scholar]
- 13.Olton DYE, Close JM, Sfeir CS, Kumta PN. Intracellular trafficking pathways involved in the gene transfer of nano-structured calcium phosphate-DNA particles. Biomaterials. 2011 Oct;32(30):7662–7670. doi: 10.1016/j.biomaterials.2011.01.043. [DOI] [PMC free article] [PubMed] [Google Scholar]
- 14.Varga CM, Wickham TJ, Lauffenburger DA. Receptor-mediated targeting of gene delivery vectors: Insights from molecular mechanisms for improved vehicle design. Biotechnol Bioeng. 2000 Dec;70(6):593–605. doi: 10.1002/1097-0290(20001220)70:6<593::aid-bit1>3.0.co;2-n. [DOI] [PubMed] [Google Scholar]
- 15.Sokolova VV, Radtke I, Heumann R, Epple M. Effective transfection of cells with multi-shell calcium phosphate-DNA nanoparticles. Biomaterials. 2006 Jun;27(16):3147–3153. doi: 10.1016/j.biomaterials.2005.12.030. [DOI] [PubMed] [Google Scholar]
- 16.Li J, Chen YC, Tseng YC, Mozumdar S, Huang L. Biodegradable calcium phosphate nanoparticle with lipid coating for systemic siRNA delivery. J Control Release Off J Control Release Soc. 2010 Mar;142(3):416–421. doi: 10.1016/j.jconrel.2009.11.008. [DOI] [PMC free article] [PubMed] [Google Scholar]
- 17.Giger EV, Puigmartí-Luis J, Schlatter R, Castagner B, Dittrich PS, Leroux JC. Gene delivery with bisphosphonate-stabilized calcium phosphate nanoparticles. J Control Release Off J Control Release Soc. 2011 Feb;150(1):87–93. doi: 10.1016/j.jconrel.2010.11.012. [DOI] [PubMed] [Google Scholar]
- 18.Leeuwenburgh SCG, Ana ID, Jansen JA. Sodium citrate as an effective dispersant for the synthesis of inorganic-organic composites with a nanodispersed mineral phase. Acta Biomater. 2010 Mar;6(3):836–844. doi: 10.1016/j.actbio.2009.09.005. [DOI] [PubMed] [Google Scholar]
- 19.Costello LC, Franklin RB, Reynolds MA, Chellaiah M. The Important Role of Osteoblasts and Citrate Production in Bone Formation: ‘Osteoblast Citration’ as a New Concept for an Old Relationship. Open Bone J. 2012;4 doi: 10.2174/1876525401204010027. [DOI] [PMC free article] [PubMed] [Google Scholar]
- 20.Hu YY, Rawal A, Schmidt-Rohr K. Strongly bound citrate stabilizes the apatite nanocrystals in bone. Proc Natl Acad Sci U S A. 2010 Dec;107(52):22425–22429. doi: 10.1073/pnas.1009219107. [DOI] [PMC free article] [PubMed] [Google Scholar]
- 21.Gyawali D, Nair P, Kim HKW, Yang J. Citrate-based Biodegradable Injectable hydrogel Composites for Orthopedic Applications. Biomater Sci. 2013 Jan;1(1):52–64. doi: 10.1039/C2BM00026A. [DOI] [PMC free article] [PubMed] [Google Scholar]
- 22.Zauner W, Ogris M, Wagner E. Polylysine-based transfection systems utilizing receptor-mediated delivery. Adv Drug Deliv Rev. 1998 Mar;30(1–3):97–113. doi: 10.1016/s0169-409x(97)00110-5. [DOI] [PubMed] [Google Scholar]
- 23.Erbacher P, Roche AC, Monsigny M, Midoux P. The reduction of the positive charges of polylysine by partial gluconoylation increases the transfection efficiency of polylysine/DNA complexes. Biochim Biophys Acta BBA - Biomembr. 1997 Feb;1324(1):27–36. doi: 10.1016/s0005-2736(96)00204-0. [DOI] [PubMed] [Google Scholar]
- 24.Ohsaki M, Okuda T, Wada A, Hirayama T, Niidome T, Aoyagi H. In vitro gene transfection using dendritic poly(L-lysine) Bioconjug Chem. 2002 Jun;13(3):510–517. doi: 10.1021/bc015525a. [DOI] [PubMed] [Google Scholar]
- 25.Choi JH, Kim SO, Linardy E, Dreaden EC, Zhdanov VP, Hammond PT, Cho NJ. Influence of pH and Surface Chemistry on Poly(l-lysine) Adsorption onto Solid Supports Investigated by Quartz Crystal Microbalance with Dissipation Monitoring. J Phys Chem B. 2015 Aug;119(33):10554–10565. doi: 10.1021/acs.jpcb.5b01553. [DOI] [PubMed] [Google Scholar]
- 26.Shen WC, Ryser HJ. Poly(L-lysine) has different membrane transport and drug-carrier properties when complexed with heparin. Proc Natl Acad Sci U S A. 1981 Dec;78(12):7589–7593. doi: 10.1073/pnas.78.12.7589. [DOI] [PMC free article] [PubMed] [Google Scholar]
- 27.Al-Jamal KT, Al-Jamal WT, Wang JTW, Rubio N, Buddle J, Gathercole D, Zloh M, Kostarelos K. Cationic Poly-l-lysine Dendrimer Complexes Doxorubicin and Delays Tumor Growth in Vitro and in Vivo. ACS Nano. 2013 Mar;7(3):1905–1917. doi: 10.1021/nn305860k. [DOI] [PubMed] [Google Scholar]
- 28.Larsen MJ. An investigation of the theoretical background for the stability of the calcium-phosphate salts and their mutual conversion in aqueous solutions. Arch Oral Biol. 1986;31(11):757–761. doi: 10.1016/0003-9969(86)90008-7. [DOI] [PubMed] [Google Scholar]
- 29.Son KK, Tkach D, Patel DH. Zeta potential of transfection complexes formed in serum-free medium can predict in vitro gene transfer efficiency of transfection reagent. Biochim Biophys Acta BBA - Biomembr. 2000 Sep;1468(1–2):11–14. doi: 10.1016/s0005-2736(00)00312-6. [DOI] [PubMed] [Google Scholar]
- 30.Kim DY, Kwon JS, Lee JH, Jin LM, Kim JH, Kim MS. Effects of the Surface Charge of Stem Cell Membranes and DNA/Polyethyleneimine Nanocomplexes on Gene Transfection Efficiency. J Biomed Nanotechnol. 2015 Mar;11(3):522–530. doi: 10.1166/jbn.2015.2060. [DOI] [PubMed] [Google Scholar]
- 31.Rezvani Amin Z, Rahimizadeh M, Eshghi H, Dehshahri A, Ramezani M. The effect of cationic charge density change on transfection efficiency of polyethylenimine. Iran J Basic Med Sci. 2013 Feb;16(2):150–156. [PMC free article] [PubMed] [Google Scholar]
- 32.Lilley KJ, Gbureck U, Wright AJ, Farrar DF, Barralet JE. Cement from nanocrystalline hydroxyapatite: effect of calcium phosphate ratio. J Mater Sci Mater Med. 2005 Dec;16(12):1185–1190. doi: 10.1007/s10856-005-4727-2. [DOI] [PubMed] [Google Scholar]
- 33.Olton D, Li J, Wilson ME, Rogers T, Close J, Huang L, Kumta PN, Sfeir C. Nanostructured calcium phosphates (NanoCaPs) for non-viral gene delivery: influence of the synthesis parameters on transfection efficiency. Biomaterials. 2007 Feb;28(6):1267–1279. doi: 10.1016/j.biomaterials.2006.10.026. [DOI] [PubMed] [Google Scholar]
- 34.Jordan M, Wurm F. Transfection of adherent and suspended cells by calcium phosphate. Methods San Diego Calif. 2004 Jun;33(2):136–143. doi: 10.1016/j.ymeth.2003.11.011. [DOI] [PubMed] [Google Scholar]
- 35.Eiden-Assmann S, Viertelhaus M, Heiss A, Hoetzer KA, Felsche J. The influence of amino acids on the biomineralization of hydroxyapatite in gelatin. J Inorg Biochem. 2002 Aug;91(3):481–486. doi: 10.1016/s0162-0134(02)00481-6. [DOI] [PubMed] [Google Scholar]
- 36.Barrere F, van Blitterswijk CA, de Groot K, Layrolle P. Influence of ionic strength and carbonate on the Ca-P coating formation from SBFx5 solution. Biomaterials. 2002 May;23(9):1921–1930. doi: 10.1016/s0142-9612(01)00318-0. [DOI] [PubMed] [Google Scholar]
- 37.Hamanishi C, Kitamoto K, Tanaka S, Otsuka M, Doi Y, Kitahashi T. A self-setting TTCP-DCPD apatite cement for release of vancomycin. J Biomed Mater Res. 1996 Dec;33(3):139–143. doi: 10.1002/(SICI)1097-4636(199623)33:3<139::AID-JBM3>3.0.CO;2-R. [DOI] [PubMed] [Google Scholar]
- 38.Schallon A, Synatschke CV, Jérôme V, Müller AHE, Freitag R. Nanoparticulate Nonviral Agent for the Effective Delivery of pDNA and siRNA to Differentiated Cells and Primary Human T Lymphocytes. Biomacromolecules. 2012 Nov;13(11):3463–3474. doi: 10.1021/bm3012055. [DOI] [PubMed] [Google Scholar]
- 39.Rejman J, Oberle V, Zuhorn IS, Hoekstra D. Size-dependent internalization of particles via the pathways of clathrin- and caveolae-mediated endocytosis. Biochem J. 2004 Jan;377(Pt 1):159–169. doi: 10.1042/BJ20031253. [DOI] [PMC free article] [PubMed] [Google Scholar]
- 40.Koh AL, Shachaf CM, Elchuri S, Nolan GP, Sinclair R. Electron microscopy localization and characterization of functionalized composite organic-inorganic SERS nanoparticles on leukemia cells. Ultramicroscopy. 2008 Dec;109(1):111–121. doi: 10.1016/j.ultramic.2008.09.004. [DOI] [PMC free article] [PubMed] [Google Scholar]
- 41.Jiang X, Röcker C, Hafner M, Brandholt S, Dörlich RM, Nienhaus GU. Endo- and exocytosis of zwitterionic quantum dot nanoparticles by live HeLa cells. ACS Nano. 2010 Nov;4(11):6787–6797. doi: 10.1021/nn101277w. [DOI] [PubMed] [Google Scholar]
- 42.Albanese A, Chan WCW. Effect of gold nanoparticle aggregation on cell uptake and toxicity. ACS Nano. 2011 Jul;5(7):5478–5489. doi: 10.1021/nn2007496. [DOI] [PubMed] [Google Scholar]
- 43.Jan KM, Chien S. Role of Surface Electric Charge in Red Blood Cell Interactions. J Gen Physiol. 1973 May;61(5):638–654. doi: 10.1085/jgp.61.5.638. [DOI] [PMC free article] [PubMed] [Google Scholar]
- 44.Uskoković V. Entering the era of nanoscience: time to be so small. J Biomed Nanotechnol. 2013 Sep;9(9):1441–1470. doi: 10.1166/jbn.2013.1642. [DOI] [PMC free article] [PubMed] [Google Scholar]
- 45.Xie Y, Chen Y, Sun M, Ping Q. A mini review of biodegradable calcium phosphate nanoparticles for gene delivery. Curr Pharm Biotechnol. 2013 Jan;14(10):918–925. doi: 10.2174/1389201014666131226145441. [DOI] [PubMed] [Google Scholar]
- 46.Guimarães LF, da Fidalgo TKS, Menezes GC, Primo LG, Costa e Silva-Filho F. Effects of citric acid on cultured human osteoblastic cells. Oral Surg Oral Med Oral Pathol Oral Radiol Endod. 2010 Nov;110(5):665–669. doi: 10.1016/j.tripleo.2010.07.003. [DOI] [PubMed] [Google Scholar]
- 47.Orrantia E, Chang PL. Intracellular distribution of DNA internalized through calcium phosphate precipitation. Exp Cell Res. 1990 Oct;190(2):170–174. doi: 10.1016/0014-4827(90)90181-9. [DOI] [PubMed] [Google Scholar]
- 48.Nguyen LT, Atobe K, Barichello JM, Ishida T, Kiwada H. Complex formation with plasmid DNA increases the cytotoxicity of cationic liposomes. Biol Pharm Bull. 2007 Apr;30(4):751–757. doi: 10.1248/bpb.30.751. [DOI] [PubMed] [Google Scholar]
- 49.Costello LC, Chellaiah MA, Zou J, Reynolds MA, Franklin RB. In vitro BMP2 stimulation of osteoblast citrate production in concert with mineralized bone nodule formation. J Regen Med Tissue Eng. 2015 Nov;4(2) doi: 10.7243/2050-1218-4-2. [DOI] [PMC free article] [PubMed] [Google Scholar]
- 50.Graham FL, van der Eb AJ. A new technique for the assay of infectivity of human adenovirus 5 DNA. Virology. 1973 Apr;52(2):456–467. doi: 10.1016/0042-6822(73)90341-3. [DOI] [PubMed] [Google Scholar]
- 51.Jordan M, Schallhorn A, Wurm FM. Transfecting mammalian cells: optimization of critical parameters affecting calcium-phosphate precipitate formation. Nucleic Acids Res. 1996 Feb;24(4):596–601. doi: 10.1093/nar/24.4.596. [DOI] [PMC free article] [PubMed] [Google Scholar]
- 52.Bisht S, Bhakta G, Mitra S, Maitra A. pDNA loaded calcium phosphate nanoparticles: highly efficient non-viral vector for gene delivery. Int J Pharm. 2005 Jan;288(1):157–168. doi: 10.1016/j.ijpharm.2004.07.035. [DOI] [PubMed] [Google Scholar]
- 53.Nouri A, Castro R, Santos JL, Fernandes C, Rodrigues J, Tomás H. Calcium phosphate-mediated gene delivery using simulated body fluid (SBF) Int J Pharm. 2012 Sep;434(1–2):199–208. doi: 10.1016/j.ijpharm.2012.05.066. [DOI] [PubMed] [Google Scholar]
Associated Data
This section collects any data citations, data availability statements, or supplementary materials included in this article.


