Abstract
This study was conducted to assess time-sensitive magnetic resonance (MR) changes in canine blood using low-field MR. Arterial and venous blood samples were collected from eight healthy beagle dogs. Samples were placed in 5-mL tubes and imaged within 3 hours of collection at 1 day intervals from day 1 to day 30. The following sequences were used: T1-weighted (T1W), T2-weighted (T2W), fluid-attenuated inversion recovery (FLAIR), short tau inversion recovery (STIR), and T2-star gradient-echo (T2*-GRE). Visual comparison of the images revealed that four relatively homogenous blood clots and twelve heterogeneous blood clots developed. The margination of the clot and plasma changed significantly on day 2 and day 13. On day 2, heterogeneous blood clots were differentiated into 2 to 3 signal layers in the T2W, T1W, and especially the STIR images. Hypointense signal layers were also detected in the blood clots in STIR images, which have T2 hypo, FLAIR hypo, and T1 hyper intense signals. In all images, these signal layers remained relatively unchanged until day 13. Overall, the results suggest that hematomas are complex on low-field MRI. Accordingly, it may not be feasible to accurately characterize hemorrhages and predict clot age based on low-field MRI.
Keywords: blood, canine, in vitro, low field, magnetic resonance
Introduction
Low-field magnetic resonance imaging (MRI) is used extensively in veterinary medicine for central nervous system imaging, including of the brain and spine [12]. Although there is a trend in academic institutions to increase the field strength, low-field MR is predominantly used in veterinary practice because it is less expensive than human MR systems; however, the lower costs are associated with reduced specifications [12]. This disadvantage makes it difficult to differentiate specific lesions in intracerebral and epidural spaces, such as hemorrhages. The MRI appearance of hemorrhage undergoes variable changes in signal intensity, which are influenced by factors such as the age of the blood [5,16]. The accurate diagnosis of intracranial and epidural hemorrhage is not only challenging in practice, but also especially difficult with the use of low-field MR. The MR signal intensity of hemorrhage is influenced by both intrinsic and extrinsic factors [23]. Some intrinsic factors include the time from the onset of bleeding, and the source, size, and location of the hemorrhage [23]. Extrinsic factors include the pulse sequence and field strength [23]. Many prior studies have addressed the time-dependent appearance of blood on T1-weighted (T1W) and T2-weighted (T2W) MR sequences [4,5,15,16,22]. Past studies have described theoretical and sequential MRI changes in blood in both human in vitro studies, and in those involving experimental intracranial hemorrhage in dog models [4,5,15,16,22]. There are also multiple reports describing intracranial and epidural hemorrhage imaging in veterinary medicine [9,13,20]. One study describes sequential MRI of an intracranial hematoma in a dog [18]. Others have described hemorrhage detection using gradient-echo sequences and changes in T1W and T2W signal intensity in response to the hemoglobin degradation stage [9,19]. Some have suggested that epidural hemorrhage may not follow the same degradation changes as seen in intracranial hemorrhage [13]. Prior literature also suggests that T2-star gradient-echo (T2*-GRE) imaging is particularly sensitive to hemorrhage because certain hemoglobin breakdown products are paramagnetic and therefore create local magnetic field inhomogeneities [9,11]. However, in veterinary practice, the 0.25T low-field magnet creates inconsistencies between hemorrhage changes and its baseline findings on MR imaging. When evaluating canine hemorrhage, it is important to be aware of various MR imaging features to avoid making incorrect diagnoses or miscalculating the time of onset. Therefore, it is necessary to perform sequential imaging of canine blood samples to conduct a clinical study to assess the MR signal intensity changes in low-field MR. Accordingly, the present study was conducted to assess the MR changes in canine blood over time with fluid-attenuated inversion recovery (FLAIR), short tau inversion recovery (STIR), T1W and T2W sequences. The feasibility of T2*-GRE sequence in detecting hemorrhage was also assessed using low-field MR.
Materials and Methods
This study was conducted prospectively between November and December 2013. The research was approved by the Institutional Animal Care and Use Committee (IACUC) of Chonbuk National University (CBU 2014-0002). Arterial and venous blood samples were collected from eight clinically healthy beagle dogs. All eight dogs were female with a mean age of 5.28 ± 0.88 years. The mean body weight was 8.68 ± 0.88 kg. Immediately after blood collection, the CBC (Vet ABC; Heska, USA), blood gas (IDEXX loboratories, USA), %MHb (NOVA CO-Oximeter; Nova Biomedical, USA), prothrombin time, and activated partial thromboplastin time (Coag DX Analyzer; IDEXX Laboratories) of the anticoagulated blood samples were measured. The blood was left undisturbed in sealed plastic sample tubes and allowed to clot. A phantom sample that contained multiple samples surrounded by an agarose bath was also prepared to prevent ghost artifacts. All phantom blood samples were imaged at room temperature. For 30 days, the samples were stored at 36℃, except during MR imaging. MRI was performed using a 0.25 T (Vet-MR Grande; Esaote, Italy) system and a solenoid Knee coil. The phantoms were placed horizontally and five sequences were used to acquire images of the phantom blood sample at 1 day intervals for 30 days. The sequences included transverse T2W image (T2WI; turbo spin-echo; 4260/90; TR/TE), T1W image (T1WI; spin-echo; 860/18; TR/TE), T2*-GRE (1105/22; TR/TE), FLAIR (7140/90/17500; TR/TE/IR), STIR (5250/80/120; TR/TE/IR). The acquisition parameters of the MR imaging are shown in Table 1. The transverse plane was oriented perpendicular to the floor of the sample. The slices were 3.5 mm thick for vertical plane images with a 0.4 mm gap. The digital imaging and communications in medicine (DICOM) images from the blood samples were acquired daily from day 0 to 30. The samples' signal intensity was subjectively graded as null, hypointense, isointense, hyperintense and heterogeneous relative to the signal intensity of the agarose gel (Fig. 1). The region of interest was the selected blood clot region of samples on the images. A radiologist compared the DICOM images from day 0 to 30 side by side using PACS software (INFINITT Healthcare, Korea) to assess visual differences in signal intensity. The reader subjectively selected the window width and level at which to view each sequence. The same width and level were used for each sequence to compare subsequent images from day 0 to 30.
Table 1. Acquisition parameters for transverse imaging.
TR, repetition time; TE, echo time; FOV, field of view; NEX, number of acquisitions; TI, time of inversion; TSE T2, turbo spin-echo T2-weighted; SE T1, spin-echo T1-weighted; FLAIR, fluid-attenuated inversion recovery; STIR, short tau inversion recovery; T2*-GRE, T2-star gradient-echo.
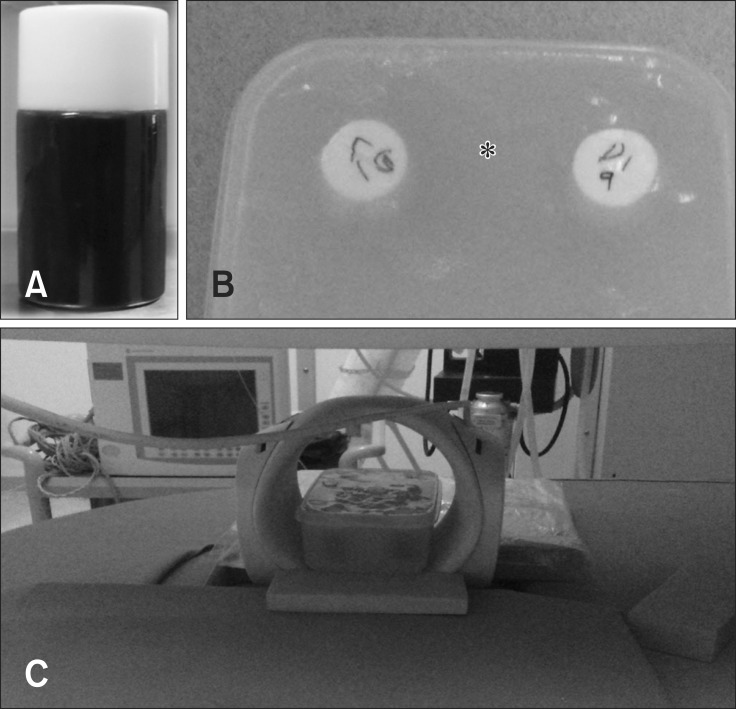
Fig. 1. (A) Blood filled sample tube. (B) Phantom sample container surrounded by agarose bath (asterisk) to avoid ghost artifact. (C) 0.25 T MR system and a solenoid Knee coil.
Results
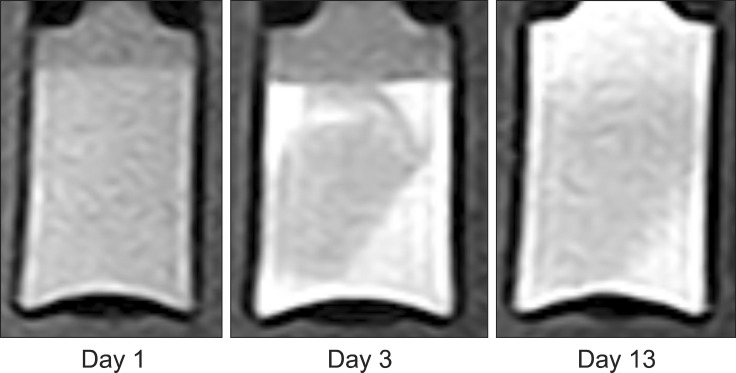
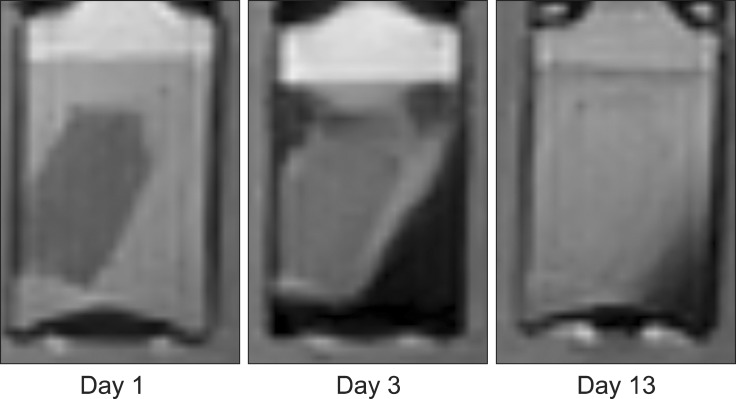
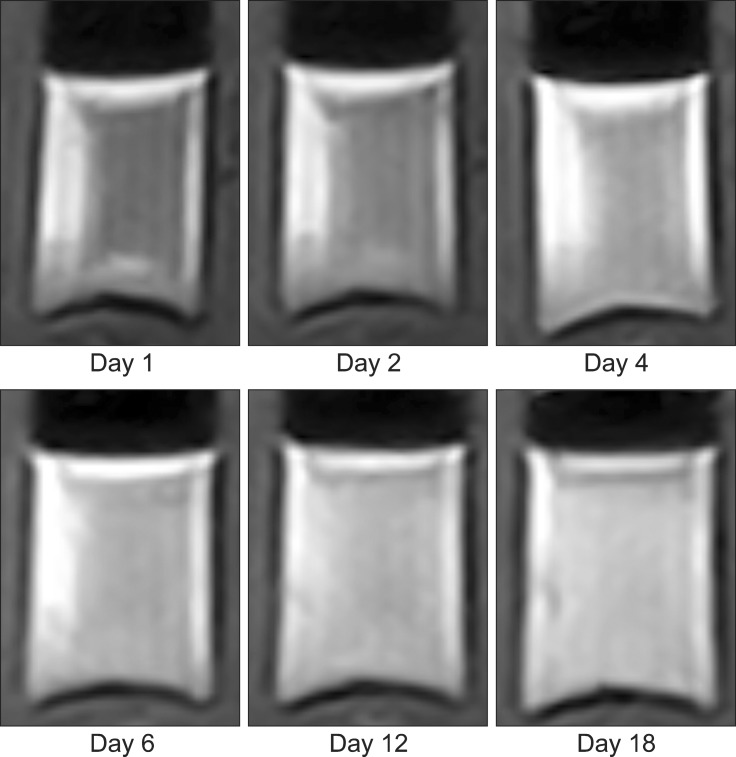
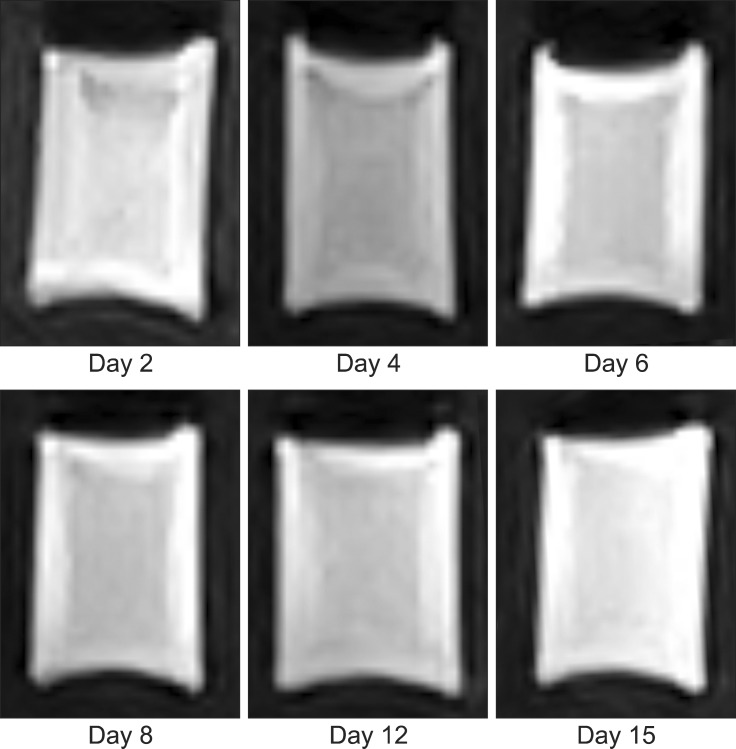
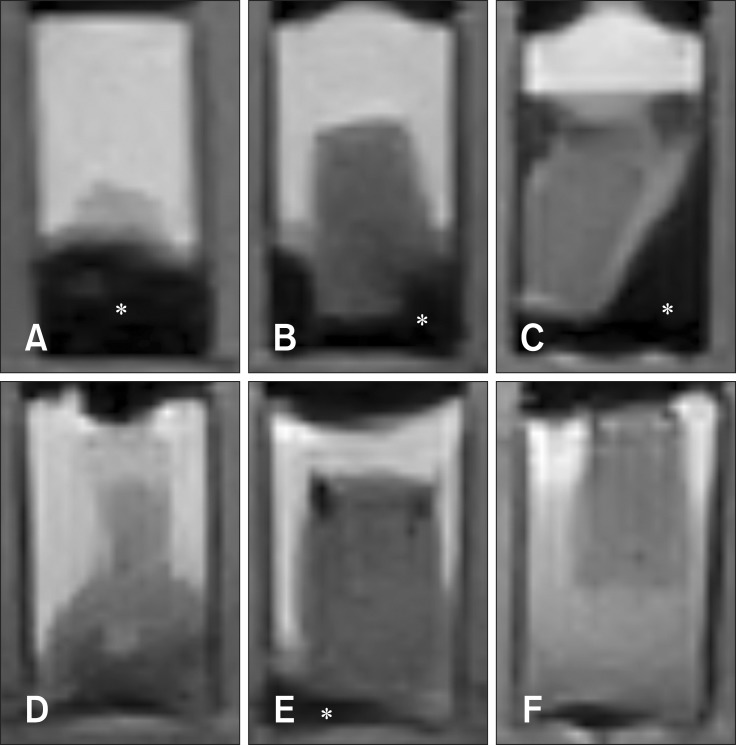
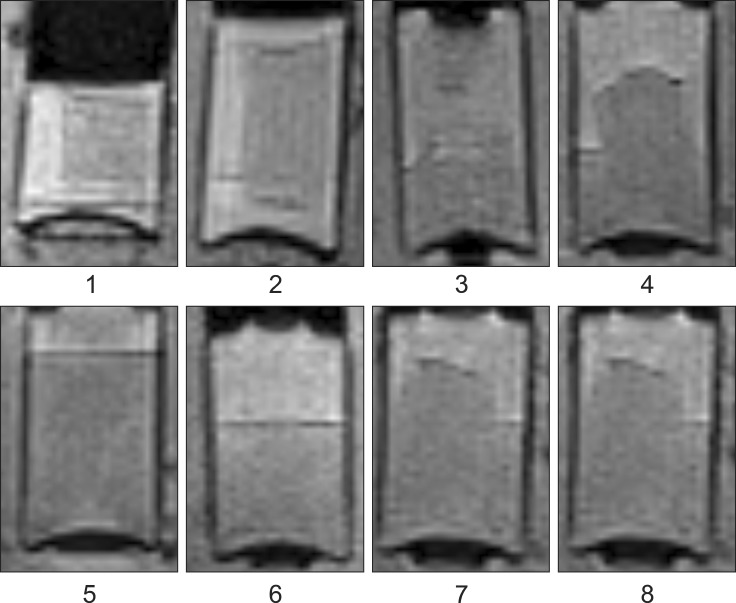
Four homogenous, six mildly heterogeneous, and six completely heterogeneous blood clots were made in sample tubes. Less than 3 h after their development, there was poor signal layer discrimination. However, in many blood samples, the serum and clot could be differentiated on the first day (Figs. 2 and 3). By day 3 to 4, there were multiple MRI signal layers with a maximum of four layers detected in STIR sequences. By day 2, new focal signal layers developed in the clot in eight arterial blood samples and two venous blood samples on T1W, STIR, and T2W sequences. Compared with the unchanged clot region, these layers displayed hyperintensity in T1WI, hypointensity in T2WI, and hypo to null intensity in STIR (Figs. 4 and 5). On day 3, the new signal layers reached maximum hypointensity, which was apparent ventrolaterally in the T2W sequence (Fig. 6). There were no subjective changes in clot signal intensity between days 3 and 13 in any of the sequences. Around day 13, there was again poor discrimination of the signal layers in the blood clot. On FLAIR images, the blood clots consistently displayed hyperintensity (Fig. 7). The changes in chronological signal intensity of each sequence are summarized in Table 2. All of the arterial blood clot samples showed new partial hyperintensity in T1WI, and hypo to null signal intensity in STIR. In contrast, the majority of the venous blood clot samples did not show these changes (Fig. 8). There were no significantly hypointense signals in any of the blood clots from days 1 to 30 in the T2*-GRE sequences (Fig. 9).
Fig. 2. Dog 1 arterial blood sample at day 1. (A) Transverse T2-weighted. (B) T1-weighted. (C) Fluid attenuated inversion recovery (FLAIR). (D) Short tau inversion recovery (STIR). (E) T2-star gradient-echo (T2*-GRE). Note the partial development of hypo to null intensity (asterisk) in STIR images.
Fig. 3. Dog 1 venous blood sample at day 1. (A) Transverse T2-weighted. (B) T1-weighted. (C) FLAIR. (D) STIR. (E) T2*-GRE.
Fig. 4. Transverse T1-wegithed images of dog 5 arterial blood sample with time. Note the developing partial hyperintensity in the blood clot at day 3.
Fig. 5. Transverse STIR images of dog 5 arterial blood sample with time. Note the developing partial hypo to null intensity in the blood clot at day 3.
Fig. 6. Transverse T2-weighted images of dog 2 venous blood sample with time.
Fig. 7. Transverse FLAIR images of dog 2 venous blood sample with time.
Table 2. Summary of chronological signal intensity change of in vitro canine blood.
T1W, T1-weighted; T2W, T2-weighted.
Fig. 8. Transverse STIR images of dog 3 (A, arterial; D, venous), 4 (B, arterial; E, venous), 5 (C, arterial; F, venous) blood sample with time. Note the difference in the degree of developed hypo to null intensity (asterisk) between arterial and venous blood samples.
Fig. 9. Transverse T2*-GRE images of dog 1 to 8 arterial blood samples at day 3. There is no significant susceptibility artifact visible in any samples.
Discussion
The MR appearance of canine blood sample with a 0.25 T low-field magnet was presented in this study. One prior study using human blood and human blood products revealed that there is a T1 time change of human blood, and a long plasma T2 time [6]. Other reports have suggested that multiple factors affect the MR signal intensity, including the protein concentration of the hematoma, the paramagnetic form of hemoglobin, and the hematoma's internal structure [17]. Previous sequential MR signal changes have been reported from animal intracranial hemorrhage models in the low-field; however, that study was performed with 0.6 T and 1.5 T magnets [22]. That report suggested that the MR field strength may be one of the factors influencing the rate of development and regression of hypo-intensity in long TR/TE scans [22].
It is well known that MRI hemorrhage is complex, variable, and dependent on the biodegradation of hemoglobin over time [1,5,6,15,21]. These variable MR appearances of hemorrhage can cause misdiagnosis of the lesion or miscalculation of the time frame. Typically, the MRI findings of hemorrhage depend on when the hemorrhage occurred relative to when the animal was imaged, the magnet's field strength, the imaging sequences obtained, the oxygen content of the blood (arterial vs. venous), and the location of the hemorrhage (parenchymal vs. subdural). In the circulating blood, hemoglobin alternates between the oxyhemoglobin state and the deoxyhemoglobin state. The heme iron in both oxy- and deoxyhemoglobin is in the ferrous (Fe2+) state. When hemoglobin is removed from the high oxygen environment of the circulation, the heme iron undergoes oxidative denaturation to the ferric state (Fe3+), forming methemoglobin [5]. Interestingly, a partial new layer in the MR signal developed in the blood clots by day 3 to 4. The signal changes that were observed include hyper intensity in T1W, and hypo intensity in TSE. The T2W findings were consistent with the guidelines of parenchymal hemorrhage in MR [1,5,6,10,23]. However, there were no significant changes in signals in the blood clots in T1W and T2W during days 4 to 30. These findings imply that it is likely very difficult to determine the onset time of a chronic stage hemorrhage using MRI. STIR sequences allowed for a T2-weighted image type with uniform loss of the fat signal. The IR sequence is an easily conducted study that involves a 180° prepulse prior to the 90° excitation pulse. The relaxation time of fat is known for all magnet strengths. Therefore, it is easy to determine the time of inversion (TI) for a specific magnetic field strength [5]. There were unexpected subjective partial changes in the blood clots to hypo intense or null signals in STIR images by days 3 to 4. This phenomenon may be explained by changes of intracellular hemoglobin (Hb) to deoxy Hb, or intracellular methemoglobin (MetHb) to extracellular MetHb by red cell lysis. The short T1 relaxation times of deoxy Hb and Met Hb are similar to the T1 relaxation time of fat. Therefore, the degraded Hb signal may be suppressed in STIR images. Because fat inversion time is close to that of extracellular methemoglobin, the fat signal could theoretically be suppressed [7,14].
FLAIR sequences showed hyper-intense signals in all blood clots, and there were no significant time-related signal intensity changes over 30 days. There are several hypotheses regarding hyper-intense signals, including the effects on both T1 and T2 relaxation, one of which addresses the role of protein in the blood [2].
T2*-GRE sequences are known to be useful in detecting and delineating hemorrhages and are therefore recommended in patients with suspected intracranial hemorrhage [1,22]. However, our results are controversial because there was no significant susceptibility effect on arterial or venous blood samples throughout the serial scans. Although low-field MR has less susceptibility artifacts than high-field MR, we expected that hemorrhage detection would be possible in T2*-GRE sequences in both arterial and venous blood samples [3,8,12]. There were significant differences between the arterial and venous blood clots in time-related signal intensity changes. Unfortunately, histopathologic examination of the blood clot samples did not reveal significant structural or compositional differences. A few reports have provided possible explanations for the different time-related MR changes in arterial and venous blood clots, including the deoxyhemoglobin concentration [22]. However, the absence of hypointensity development on T2WI or hyperintensity on T1WI in venous blood clots has yet to be confirmed. One interesting finding involved the time-related partial signal intensity changes in blood clots. To the best of our knowledge, there have been few prior reports describing these time-related partial signal intensity changes in blood clots imaged with MR. One report that involved MR imaging of intracranial canine hematomas describes the development of hypo-intensity on T2WI by day 2 [18]. This report also described development of peripheral hyper-intensity on T2WI by day 5, which was believed to be an edematous lesion [18].
This study suggests that signal changes in hemorrhages may not follow the guidelines for hemorrhage interpretation in T1W or T2W images using the 0.25 T low-field magnet. Based on the results of this study, it is likely that accurate hemorrhage characterization and clot age prediction are not feasible and T2*-GRE imaging is less useful in hemorrhage detection using 0.25 T low-field MR. Additional in vivo studies are needed to fully understand the chronological low-field MR signal intensity changes in hemorrhages.
Acknowledgments
This research was supported by the Basic Science Research Program through the National Research Foundation of Korea (NRF), funded by the Ministry of Education (grant No. NRF-2013R1A1A4AO1007690).
Footnotes
Conflict of Interest: There is no conflict of interest.
References
- 1.Atlas SW, Mark AS, Grossman RI, Gomori JM. Intracranial hemorrhage: gradient-echo MR imaging at 1.5 T. Comparison with spin-echo imaging and clinical applications. Radiology. 1988;168:803–807. doi: 10.1148/radiology.168.3.3406410. [DOI] [PubMed] [Google Scholar]
- 2.Bakshi R, Kamran S, Kinkel PR, Bates VE, Mechtler LL, Janardhan V, Belani SL, Kinkel WR. Fluid-attenuated inversion-recovery MR imaging in acute and subacute cerebral intraventricular hemorrhage. AJNR Am J Neuroradiol. 1999;20:629–636. [PMC free article] [PubMed] [Google Scholar]
- 3.Bellon EM, Haacke EM, Coleman PE, Sacco DC, Steiger DA, Gangarosa RE. MR artifacts: a review. AJR Am Roentgenol. 1986;147:1271–1281. doi: 10.2214/ajr.147.6.1271. [DOI] [PubMed] [Google Scholar]
- 4.Bradley WG., Jr MR appearance of hemorrhage in the brain. Radiology. 1993;189:15–26. doi: 10.1148/radiology.189.1.8372185. [DOI] [PubMed] [Google Scholar]
- 5.Brooks RA, Di Chiro G, Patronas N. MR imaging of cerebral hematomas at different field strengths: theory and applications. J Comput Assist Tomogr. 1989;13:194–206. doi: 10.1097/00004728-198903000-00002. [DOI] [PubMed] [Google Scholar]
- 6.Cohen MD, McGuire W, Cory DA, Smith JA. Society for Pediatric Radiology John Caffey Award. MR appearance of blood and blood products: an in vitro study. AJR Am J Roentgenol. 1986;146:1293–1297. doi: 10.2214/ajr.146.6.1293. [DOI] [PubMed] [Google Scholar]
- 7.Dürr HR, Lienemann A, Stäbler A, Küehne J, Refior HJ. MRI of posttraumatic cyst-like lesions of bone after a greenstick fracture. Eur Radiol. 1997;7:1218–1220. doi: 10.1007/s003300050278. [DOI] [PubMed] [Google Scholar]
- 8.Farahani K, Sinha U, Sinha S, Chiu LC, Lufkin RB. Effect of field strength on susceptibility artifacts in magnetic resonance imaging. Comput Med Imaging Graph. 1990;14:409–413. doi: 10.1016/0895-6111(90)90040-i. [DOI] [PubMed] [Google Scholar]
- 9.Fulkerson CV, Young BD, Jackson ND, Porter B, Levine JM. MRI Characteristics of cerebral microbleeds in four dogs. Vet Radiol Ultrasound. 2012;53:389–393. doi: 10.1111/j.1740-8261.2011.01910.x. [DOI] [PubMed] [Google Scholar]
- 10.Gavin PR, Bagley RS. Practical Small Animal MRI. 1st ed. Ames: Wiley-Blackwell; 2009. p. 60. [Google Scholar]
- 11.Hodshon AW, Hecht S, Thomas WB. Use of the T2*‐ weighted gradient recalled echo sequence for magnetic resonance imaging of the canine and feline brain. Vet Radiol Ultrasound. 2014;55:599–606. doi: 10.1111/vru.12164. [DOI] [PubMed] [Google Scholar]
- 12.Konar M, Lang J. Pros and cons of low-field magnetic resonance imaging in veterinary practice. Vet Radiol Ultrasound. 2011;52(Suppl 1):S5–S14. doi: 10.1111/j.1740-8261.2010.01780.x. [DOI] [PubMed] [Google Scholar]
- 13.Mateo I, Lorenzo V, Foradada L, Muñoz A. Clinical, pathologic, and magnetic resonance imaging characteristics of canine disc extrusion accompanied by epidural hemorrhage or inflammation. Vet Radiol Ultrasound. 2011;52:17–24. [PubMed] [Google Scholar]
- 14.Pang KK, Tsai YS, Chang HC, Hsu KN. Methemoglobin suppression in a 0.3 Tesla magnet: an in vitro and in vivo study. Acad Radiol. 2010;17:624–627. doi: 10.1016/j.acra.2009.12.014. [DOI] [PubMed] [Google Scholar]
- 15.Parizel PM, Makkat S, Van Miert E, Van Goethem JW, van den Hauwe L, De Schepper AM. Intracranial hemorrhage: principles of CT and MRI interpretation. Eur Radiol. 2001;11:1770–1783. doi: 10.1007/s003300000800. [DOI] [PubMed] [Google Scholar]
- 16.Swensen SJ, Keller PL, Berquist TH, McLeod RA, Stephens DH. Magnetic resonance imaging of hemorrhage. AJR Am J Roentgenol. 1985;145:921–927. doi: 10.2214/ajr.145.5.921. [DOI] [PubMed] [Google Scholar]
- 17.Taber KH, Hayman LA, Herrick RC, Kirkpatrick JB. Importance of clot structure in gradient‐echo magnetic resonance imaging of hematoma. J Magn Reson Imaging. 1996;6:878–883. doi: 10.1002/jmri.1880060607. [DOI] [PubMed] [Google Scholar]
- 18.Tamura S, Tamura Y, Tsuka T, Uchida K. Sequential magnetic resonance imaging of an intracranial hematoma in a dog. Vet Radiol Ultrasound. 2006;47:142–144. doi: 10.1111/j.1740-8261.2006.00120.x. [DOI] [PubMed] [Google Scholar]
- 19.Thomas WB, Adams WH, McGavin MD, Gompf RE. Magnetic resonance imaging appearance of intracranial hemorrhage secondary to cerebral vascular malformation in a dog. Vet Radiol Ultrasound. 1997;38:371–375. doi: 10.1111/j.1740-8261.1997.tb02100.x. [DOI] [PubMed] [Google Scholar]
- 20.Tidwell AS, Specht A, Blaeser L, Kent M. Magnetic resonance imaging features of extradural hematomas associated with intervertebral disc herniation in a dog. Vet Radiol Ultrasound. 2002;43:319–324. doi: 10.1111/j.1740-8261.2002.tb01011.x. [DOI] [PubMed] [Google Scholar]
- 21.Unger EC, Glazer HS, Lee JK, Ling D. MRI of extracranial hematomas: preliminary observations. AJR Am J Roentgenol. 1986;146:403–407. doi: 10.2214/ajr.146.2.403. [DOI] [PubMed] [Google Scholar]
- 22.Weingarten K, Zimmerman RD, Deo-Narine V, Markisz J, Cahill PT, Deck MD. MR imaging of acute intracranial hemorrhage: findings on sequential spin-echo and gradient-echo images in a dog model. AJNR Am J Neuroradiol. 1991;12:457–467. [PMC free article] [PubMed] [Google Scholar]
- 23.Zimmerman RD, Heier LA, Snow RB, Liu DP, Kelly AB, Deck MD. Acute intracranial hemorrhage: intensity changes on sequential MR scans at 0.5 T. AJR Am J Roentgenol. 1988;150:651–661. doi: 10.2214/ajr.150.3.651. [DOI] [PubMed] [Google Scholar]


