SUMMARY
Uropathogenic Escherichia coli secrete siderophores during human infections. Although siderophores are classically defined by their ability to bind ferric ions, the virulence-associated siderophore yersiniabactin was recently found to bind divalent copper ions during urinary tract infections. Here we use a mass spectrometric approach to determine the extent of non-ferric metal interactions by yersiniabactin and its TonB-dependent outer membrane importer FyuA. In addition to copper, iron and gallium ions, yersiniabactin was also observed to form stable nickel, cobalt, and chromium ion complexes. In E. coli, copper(II) and all other non-ferric yersiniabactin complexes were imported by FyuA in a TonB-dependent manner. Among metal-yersiniabactin complexes, copper(II) yersiniabactin is predicted to be structurally distinctive and was the only complex not to competitively inhibit ferric yersiniabactin import. These results are consistent with yersiniabactin as part of a metallophore system able to prioritize ferric complex uptake in high copper environments.
Keywords: Uropathogenic Escherichia coli, siderophores, metal transport
INTRODUCTION
Numerous bacterial pathogens synthesize and secrete chemically diverse specialized metabolites called siderophores, which are defined by their ability to bind ferric iron (Fe(III)) and counter the effects of nutritional immunity by the host1, 2. Most Gram-negative bacteria must first actively transport ferric-siderophore complexes to the periplasm through dedicated outer membrane transporters powered by the TonB complex, which transduces energy from the cytoplasmic proton motive force3–5. These ferric siderophore complexes, or the iron released from them, are subsequently transported to the cytoplasm through inner membrane ATP-binding cassette transporters6–9.
Although only a single siderophore system is necessary for iron-dependent growth in iron-chelated culture conditions, uropathogenic E. coli (UPEC) isolates can express multiple siderophore systems consisting of enterobactin (which is genetically conserved in all E. coli) in combination with salmochelin, aerobactin and/or yersiniabactin10. Among these, the yersiniabactin (Ybt) siderophore system is the most frequently-carried, non-conserved siderophore system in UPEC10, 11. Genes encoding Ybt biosynthetic proteins, an outer membrane import protein (fyuA), putative inner membrane transporters (ybtP,Q), and a transcription factor (ybtA) are present on the non-conserved 30 kilobase multi-operon Yersinia High Pathogenicity Island (HPI)6, 12, 13. Yersinia HPI genes are dramatically upregulated during experimental mouse cystitis and Ybt has also been directly detected in the urine of UTI patients infected with Ybt-expressing pathogens14–16. Together these findings are consistent with a pathogenic gain-of-function conferred by yersiniabactin siderophore system expression.
Recent observations demonstrating that Ybt binds both copper and iron ions during both human and experimental animal cystitis suggest that the Ybt system confers a gain-of-function through interactions with non-ferric metal ions16, 17. Chemical diversity among siderophores may thus reflect differential “tuning” of these chelators to bind metal ions other than Fe(III), including divalent ions such as Cu(II). In intracellular compartments where copper is used as an antibacterial agent, Ybt may protect pathogenic bacteria by sequestering copper and catalyzing superoxide dismutation17, 18. To date, it has been unclear whether Cu(II)-Ybt is also an additional transport substrate for FyuA, the TonB-dependent outer membrane Fe(III)-Ybt importer4, 6, 19. If non-iron yersiniabactin complexes with physiologic metals are imported, yersiniabactin may possess a previously unappreciated metallophore function beyond its classic iron scavenging activity.
In this study, we used a liquid chromatography mass spectrometry (LC-MS) based screen to unambiguously identify stable Ybt complexes with non-ferric metal ions. We found that Ybt forms stable complexes with multiple physiologically relevant trivalent and divalent metal ions that are predicted to use similar coordination sites. A combined bacterial genetic and quantitative mass spectrometric approach showed that these complexes can be imported into E. coli by the TonB-dependent transporter FyuA. Of the non-ferric complexes examined, only Cu(II)-Ybt did not competitively inhibit Fe(III)-Ybt uptake. Together these results are consistent with a metallophore-like function for the yersiniabactin system that prioritizes iron uptake in copper-rich intracellular compartments where Cu(II)-Ybt may reach high concentrations.
RESULTS
Mass spectrometric screen for stable metal-Ybt complexes
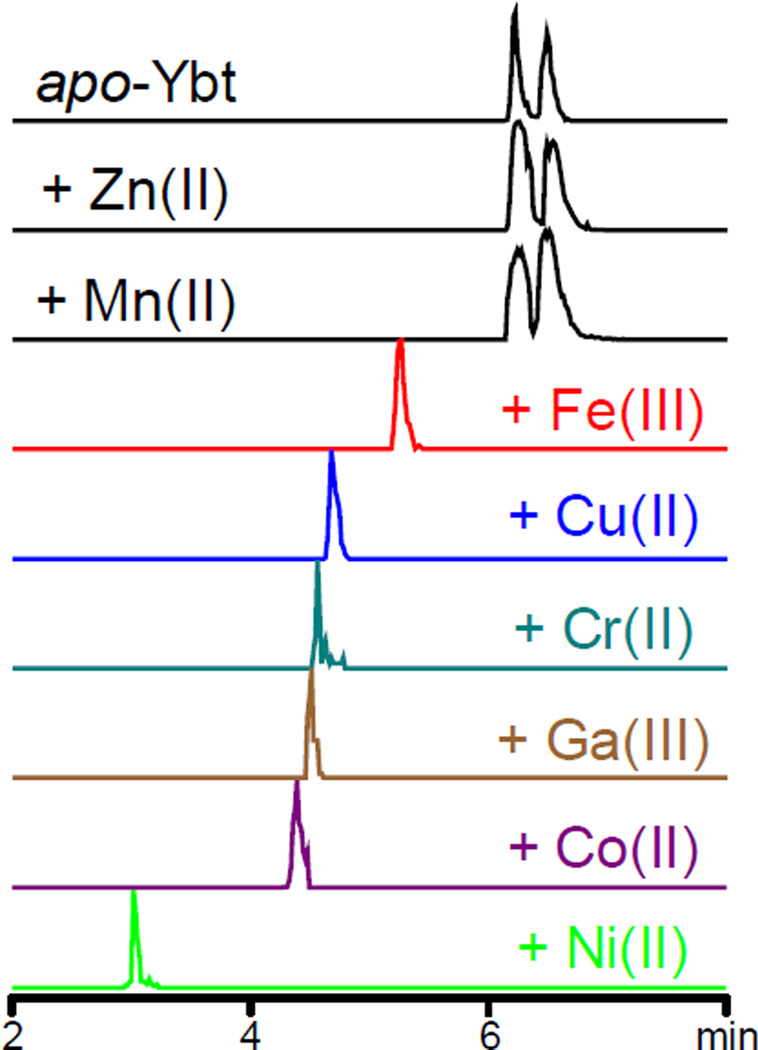
To identify stable metal-Ybt complexes, we used a previously described mass spectrometric screen (liquid chromatography-constant neutral loss; LC-CNL) to detect metal-Ybt complexes in aqueous solutions containing apo-Ybt at pH 7 and metal salts in molar excess (10mM final concentration)16. We selected transition metal species with known physiologic roles such as zinc(II), manganese(II), nickel(II) and cobalt(II)2, and chromium(II). The established Ybt ligands iron(III), copper(II), and gallium(III) served as positive controls. LC-CNL ion chromatograms from Ybt solutions containing chromium, cobalt and nickel revealed new peaks with mass spectra and retention times that differ from apo-Ybt or other known metal-Ybt complexes. No new peaks were observed from Ybt solutions containing zinc and manganese (Fig 1). When HPLC was performed without acid modifier to avoid possible acidic dissociation of complexes, no new peaks corresponding to zinc or manganese complexes were observed (data not shown). A molar excess of Zn(II) furthermore did not alter 0.1 µM apo-Ybt and Fe(III)-Ybt peaks areas (Supplementary Fig 1). Detection of chromium, cobalt and nickel-Ybt complexes suggest a broader range of Ybt ligands beyond the previously identified Fe(III), Cu(II) and Ga(III) ions. While these results do not rule out the existence of Ybt complexes with zinc or manganese, isolated complexes with these metals may not be sufficiently stable or sensitive to be detected under these conditions.
Figure 1. Mass spectrometric neutral loss screen reveals multiple stable metal-Ybt complexes.
Liquid chromatography-constant neutral loss (LC-CNL) chromatograms reveal new chromatographic peaks corresponding to different stable metal Ybt complexes in solutions combining apo-Ybt (top) and different metal ions. The established Ybt ligands iron, copper, and gallium were used as positive controls while Ybt solutions containing chromium, cobalt and nickel revealed new peaks that differ from apo-Ybt or other known metal-Ybt complexes. Ybt solutions containing zinc and manganese did not reveal new peaks.
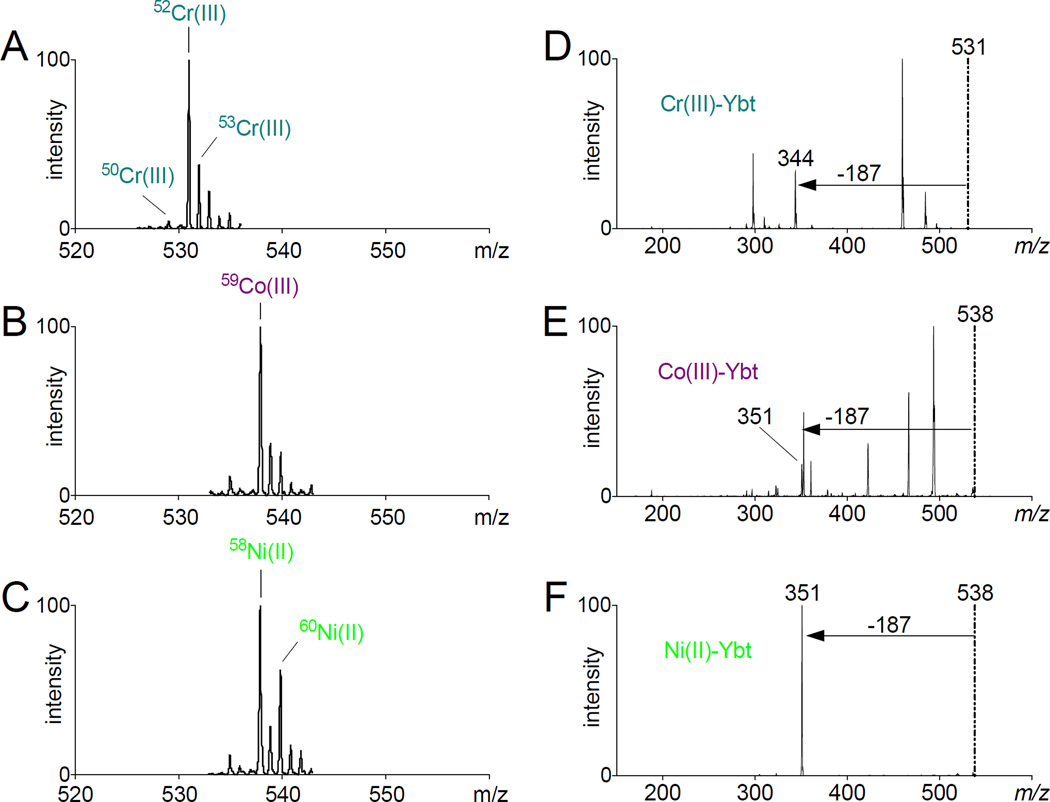
To obtain more detailed structural information about the new products observed in the LC-CNL screen, we subjected the new peaks from chromium, cobalt and nickel-containing Ybt samples to MS and MS/MS analyses. The chromium-Ybt mass spectrum showed a dominant peak at m/z 531 and prominent M-2 and M+1 peaks at m/z 529 and 532 respectively. These are 49 a.m.u. higher than the Ybt [M+H]+ ion with M-2 and M+1 isotopes, consistent with a singly charged chromium complex of the form [Ybt-2H + Cr(III)]+. The mass spectrum isotope distribution was consistent with the natural abundance of 50Cr, 52Cr and 53Cr isotopes at 4%, 84% and 10% respectively (Fig 2A). MS/MS fragmentation of the monoisotopic peak at m/z 531 revealed a prominent 187 a.m.u. neutral loss alongside other fragments. One such fragment was a 46-a.m.u. neutral loss, which is consistent with a thioformaldehyde loss (Fig 2D), from the thiazoline ring bearing the terminal carboxylic acid. The cobalt-Ybt mass spectrum revealed a base peak at m/z 538 without additional prominent isotope peaks. At 56 a.m.u. higher than the Ybt [M+H]+ ion, this ion was consistent with a singly charged cobalt complex of the form [Ybt-2H + Co(III)]+ (Fig 2B). The lack of a prominent isotope peak was consistent with cobalt, whose only stable isotope is 59Co. MS/MS analysis of the monoisotopic peak at m/z 538 revealed a fragmentation pattern with a 187-a.m.u. neutral loss as well as other fragments, including a 44-a.m.u. neutral loss consistent with loss of CO2 from the terminal carboxyl group (Fig 2E). Ambient oxidizing conditions together with possible stabilization of the trivalent forms by Ybt likely contributed to trivalent cobalt and chromium complex formation despite their addition as divalent salts. Nickel-Ybt mass spectrum also features a dominant peak at m/z 538 but also exhibits a prominent M+2 peak at m/z 540. At 56 a.m.u. higher than the Ybt [M+H]+ ion with a prominent M+2 isotope, this is consistent with a singly charged nickel complex of the form [Ybt-H + Ni(II)]+. The observed isotope pattern matches the natural 58Ni and 60Ni abundances of 68% and 26% respectively (Fig 2C). The monoisotopic m/z 538 peak MS/MS spectrum was dominated by a 187 a.m.u. neutral loss (Fig 2F).
Figure 2. MS and MS/MS spectral analyses reveal non-ferric metal-Ybt complexes.
(A) MS spectrum of chromium-Ybt exhibits a base peak at m/z 531 consistent with Cr(III) and its natural abundance 50Cr, 52Cr and 53Cr isotopes. (B) MS spectrum of cobalt-Ybt exhibits a base peak at m/z 531 consistent with 59Co(III). (C) MS spectrum of nickel-Ybt exhibits a base peak at m/z 538 and a prominent M+2 peak consistent with Ni(II) and its 58Ni and 60Ni isotopes. (D, E, F) Tandem MS/MS spectra for each complex confirms the dominant neutral loss of 187 m/z units observed with previously characterized metal-Ybt species.
Additional compositional information was achieved by stable isotope labeling and ICP-MS. 13C-isotope labeling shifted all new products 21 m/z units higher than unlabeled complexes, consistent with yersiniabactin’s 21 carbon atoms16. Subsequent MS/MS analysis revealed a shifted dominant MS/MS neutral loss of 195 mass units, corresponding to loss of a fragment containing eight carbons (Supplementary Fig 2). All metal-Ybt complexes identified above were stable following chromatographic purification on the basis of LC-MS and UV/visible absorption profiles. We further validated metal-Ybt complex identifications using ICP-MS to measure the dominant metal species in HPLC-purified specimens. Through ICP-MS analysis, we found that the metal ion corresponding to the metal-Ybt sample was the dominant metal ion. Together, these data support Ybt’s ability to bind and form stable metal complexes with Fe(III), Cu(II), Cr(III), Ga(III), Co(III), and Ni(II).
Theoretical structural modeling supports a distinctive Cu(II)-Ybt structure
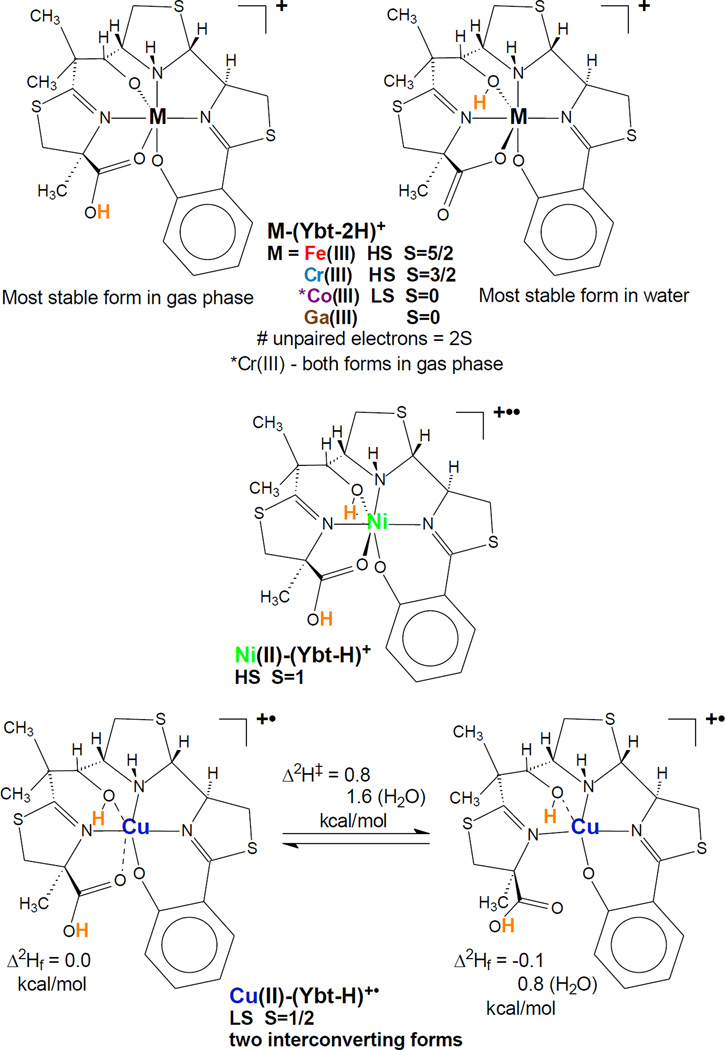
To address the physical plausibility of new yersiniabactin complexes we used a quantum-based density function theory (DFT) approach17 to simulate each complex in both the gas-phase (mass spectrometer) and in solution (H2O). We validated this approach by comparing the calculated neutral Fe(III)-Ybt complex structure to the experimentally-determined Fe(III)-Ybt X-ray crystal structure20. Both structures were virtually identical, supporting the validity of the DFT approach (Supplementary Fig. 3). We then simulated the stable metal-Ybt complexes observed in the mass spectrometer: Cu(II)-, Co(III)-, Ni(II)-, Fe(III)-, Cr(III)-, and Ga(III)-Ybt. All complexes are predicted to share a common square planar core involving the salicylate oxygen and the three nitrogens of yersiniabactin. Although thioethers have been shown to interact with copper ions in some proteins (through methionine21), forcing these interactions in DFT simulations eliminated the nitrogen interactions and led to markedly less stable isomers. With the notable exception of Cu(II)-Ybt, all other complexes were predicted to share the hexa-coordinate octahedral configuration previously observed for Fe(III)-Ybt20. Cu(II)-Ybt is distinguished by two elongated axial ligand bonds to the aliphatic alcohol and terminal carboxyl groups. Cu(II)-Ybt has a second energetically competitive form that lacks the axial cupric to carbonyl bond (Fig. 3) rendering that form penta-coordinate with an open coordination site.
Figure 3. Density function theory (DFT) models structurally differentiate Cu(II)-Ybt complexes.
Metal ion bonds predicted by DFT calculations of Ybt complexes with Fe(III), Cr(III), Ga(III), Ni(II), Co(III), and Cu(II). Spin states are indicated (S, total spin; HS, high spin; LS, low spin). In Cu(II)-Ybt, axial Cu-O bonds are relatively stretched (0.15 – 0.20 nm indicated by dashed lines) and interconvert with a competitive penta-coordinate form. Calculated position of charging proton(s) for mono-cationization (ESI in the mass spectrometer) are indicated in bold orange.
The MS/MS fragmentation data is consistent with the calculated gas phase structures (relevant to MS experimental conditions) for each complex. Gas phase structures vary for M(III)-Ybt mono-positive complexes, which were calculated to have the charging proton on the terminal carbonyl oxygen of the axial carboxylate ligand rather than the secondary alcohol. Overall, the calculated structures agree with the available experimental data. All the chromatographically isolated metal yersiniabactin complexes observed here are predicted to be stable by DFT simulation. Among these complexes, Cu(II)-Ybt is predicted to be the most structurally and electronically distinctive.
FyuA and YbtPQ are required for Fe(III)-Ybt dependent growth in UPEC
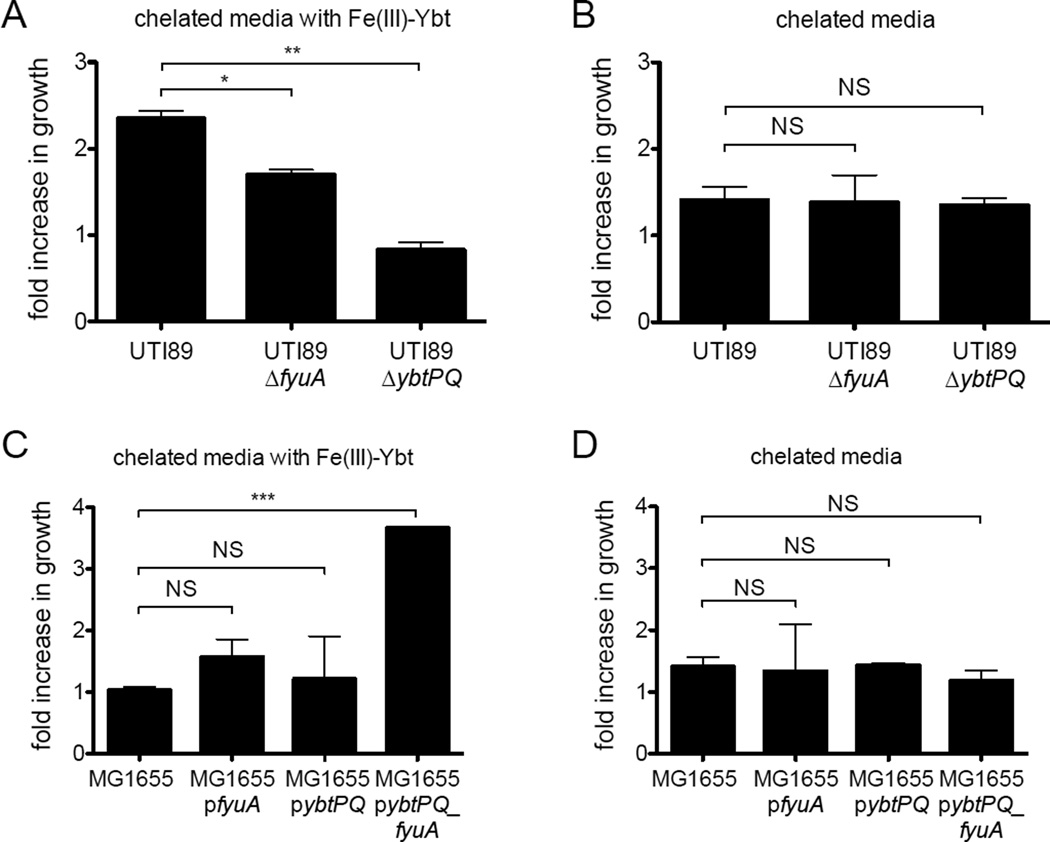
To confirm the role of UPEC-encoded FyuA and YbtPQ in E. coli Fe(III)-Ybt utilization, we measured growth of the model UPEC strain UTI89 and the Yersinia HPI-null K12 strain MG1655 with purified Fe(III)-Ybt as the sole iron source in otherwise nutrient-rich media. E. coli strains were grown in nutrient-rich YESCA (yeast extract-casamino acids) media containing 1 µM purified Fe(III)-Ybt and the iron chelator EDDHA, which sequesters non-siderophore-bound Fe(III). Wild type UTI89 growth exceeded that of UTI89ΔfyuA and UTI89ΔybtPQ in the presence (Fig 4A), but not absence (Fig 4B) of Fe(III)-Ybt. Plasmid-complemented UTI89ΔfyuA and UTI89ΔybtPQ showed restored growth to wild type UTI89 levels (Supplementary Fig 4). In the Yersinia HPI-null MG1655 strain background, which lacks yersiniabactin transport genes, Fe(III)-Ybt-dependent growth required simultaneous ectopic expression of FyuA and YbtPQ (Fig 4C,D). These results show that FyuA and YbtPQ are sufficient for Fe(III)-Ybt-dependent growth in both UPEC and K12 E. coli. The inability of FyuA alone to promote Fe(III)-Ybt-dependent growth in MG1655 is consistent with the current model in which FyuA delivers Fe(III)-Ybt to the periplasmic, not cytoplasmic space.
Figure 4. FyuA and YbtPQ are necessary for Fe(III)-Ybt-dependent growth in pathogenic (UTI89) and non-pathogenic (MG1655) E. coli.
(A) Fe(III)-Ybt-dependent growth is limited in UTI89 mutants lacking FyuA and YbtPQ. In this condition, Fe(III)-Ybt is added to a rich media in which bioavailable ferric ions are chelated with EDDHA. (B) UTI89 strains are indistinguishable in the absence of Fe(III)-Ybt. (C) MG1655 pybtPQ_fyuA, which constitutively express both FyuA and YbtPQ, gains Fe(III)-Ybt-dependent growth. (D) MG1655 strains are indistinguishable in the absence of Fe(III)-Ybt. Fold increase in growth represents the ratio of CFU at end point over start point for each strain. Results are shown as mean ± s.d.; n=3; *P<0.05, **P<0.01, **P<0.001.
FyuA imports intact Fe(III)-Ybt complexes in a TonB-dependent manner
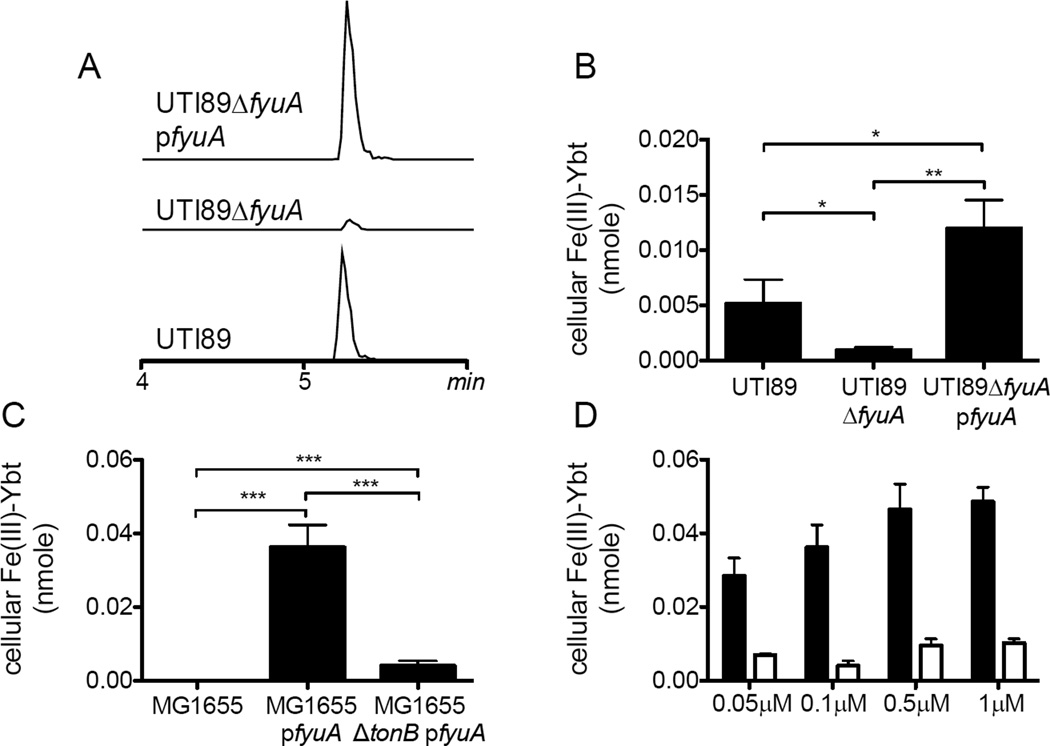
To determine whether E. coli use FyuA to import Fe(III)-Ybt complexes, we used stable isotope dilution mass spectrometry (LC-MS/MS) to directly localize exogenously-supplied metal-yersiniabactin complexes. With this approach, Fe(III)-Ybt could be quantified in UTI89 cell extracts following a 30 minute exposure to 0.1 µM purified Fe(III)-Ybt (Fig 5A,B). These cell-associated Fe(III)-Ybt levels were nearly eliminated in UTI89ΔfyuA and were restored by genetic complementation in UTI89ΔfyuA pfyuA. This complementing plasmid further conferred robust cellular Fe(III)-Ybt localization in MG1655 (Fig 5C). Because Fe(III)-Ybt can form a stable FyuA-bound complex19, we examined localization in MG1655ΔtonB background, which lacks the energy transduction system required for active transport to the periplasm. Cell-associated Fe(III)-Ybt was significantly lower in MG1655ΔtonB pfyuA than in MG1655 pfyuA. Furthermore, cell-associated Fe(III)-Ybt in MG1655ΔtonB pfyuA lacked the dose-dependent relationship observed in MG1655 pfyuA (Fig 5D). Overall, these observations support the model in which FyuA is sufficient to transport intact Fe(III)-Ybt through the Gram negative outer membrane in a TonB-dependent manner.
Figure 5. Direct LC-MS/MS detection of cell-associated Fe(III)-Ybt in FyuA-expressing UTI89 and MG1655.
Bacteria grown in Fe(III)-Ybt-containing media were extracted to quantify cell-associated Fe(III)-Ybt using LC-MS/MS with a 13C-labeled Fe(III)-Ybt internal standard. (A) Representative LC-MS/MS chromatograms of cell-associated Fe(III)-Ybt scaled to internal standard peaks. (B) Cell-associated Fe(III)-Ybt was abolished in an FyuA-deficient mutant and restored by genetic complementation. (C) Exogenous FyuA expression in MG1655 significantly increased cell-associated Fe(III)-Ybt levels while expression in a MG1655ΔtonB resulted in lower levels. (D) A positive Fe(III)-Ybt dose-response relationship was observed in MG1655 pfyuA (black bars) but not MG1655ΔtonB pfyuA (white bars). Results are shown as nanomoles, mean ± s.d.; n=3; ***P<0.001.
FyuA imports Cu(II)-Ybt and other non-ferric complexes in a TonB-dependent manner
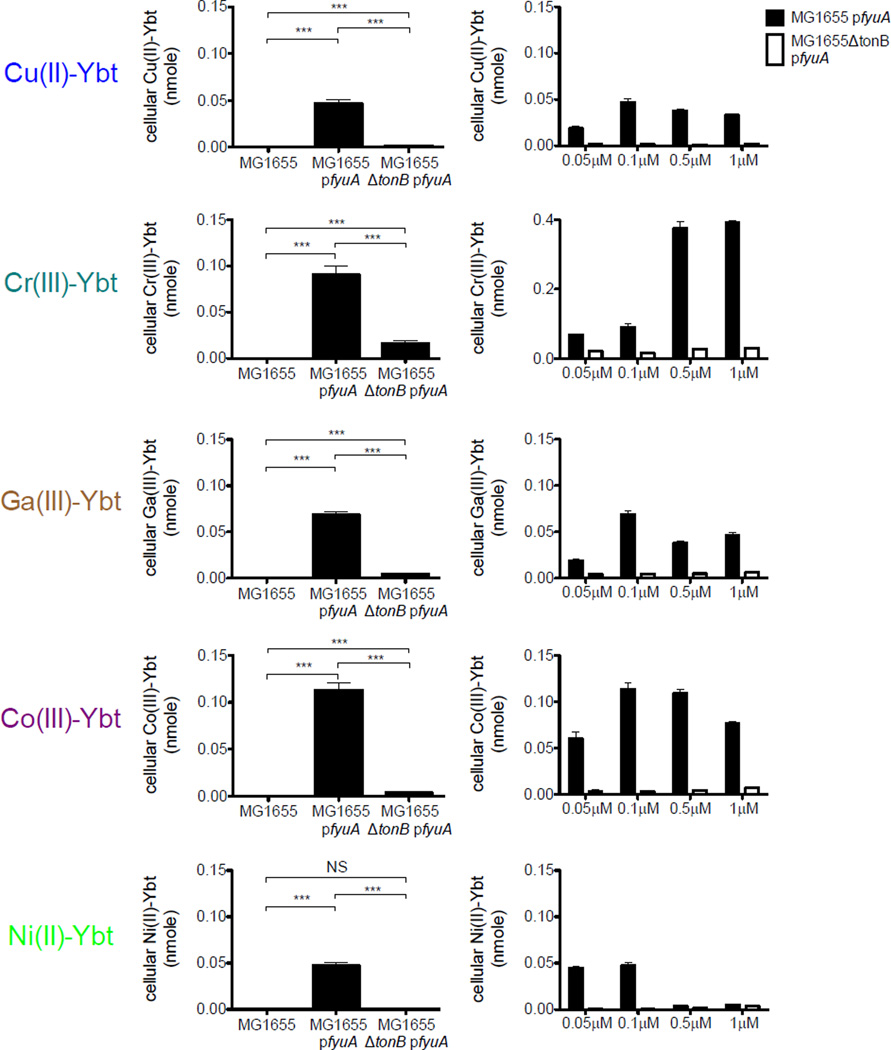
To determine whether E. coli can use FyuA to import non-iron Ybt complexes, we used LC-MS/MS to directly localize exogenously-supplied yersiniabactin complexes. With this approach, non-iron Ybt complexes could be quantified in bacterial cell extracts following a 30-minute exposure to 0.1 µM purified metal-Ybt (Fig 6, left). These cell-associated metal-Ybt levels were nearly absent in wild type MG1655 while MG1655 pfyuA conferred robust cellular metal-Ybt localization at similar molar quantities (Fig 6, left). To investigate non-iron Ybt interactions with FyuA, we examined localization in MG1655ΔtonB pfyuA. Cell-associated Ybt complexes were significantly lower in MG1655ΔtonB pfyuA than in MG1655 pfyuA. Furthermore, cell-associated metal-Ybt in MG1655ΔtonB pfyuA lacked the dose-dependent relationship observed in MG1655 pfyuA (Fig 6, right). Interestingly, we found cell-associated Cu(II)-, Ga(III)-, Co(III)- and Ni(II)-Ybt levels rise and then decrease in MG1655 pfyuA with increasing metal-Ybt concentrations in the media (Fig 6, right). These distinctive transport features at higher concentrations may reflect higher order interactions with FyuA or variable intracellular metal-Ybt instability. Overall, these observations support a model in which FyuA imports non-iron Ybt complexes through TonB-mediated active transport. While this was expected for Ga(III), a classic non-physiologic ferric ion mimic, import of physiologically relevant metals raises the possibility that these are imported by FyuA during infections.
Figure 6. FyuA and TonB-dependent uptake of Cu(II)-Ybt and other non-ferric complexes.
Cell-associated metal-Ybt complexes were measured in E. coli MG1655 strains. (left) Ectopic FyuA expression significantly increased cell-associated metal-Ybt levels but this increase was significantly lower in a tonB-null mutant background. (right) tonB-null mutants exhibited lower cell-associated Ybt complexes over a range of applied media concentrations. Black bars indicate MG1655 pfyuA while white bars indicate MG1655ΔtonB pfyuA. Results are shown as nanomoles, mean ± s.d.; n=3; *P<0.05, **P<0.01 and ***P<0.001.
Cu(II)-Ybt does not competitively inhibit Fe(III)-Ybt uptake
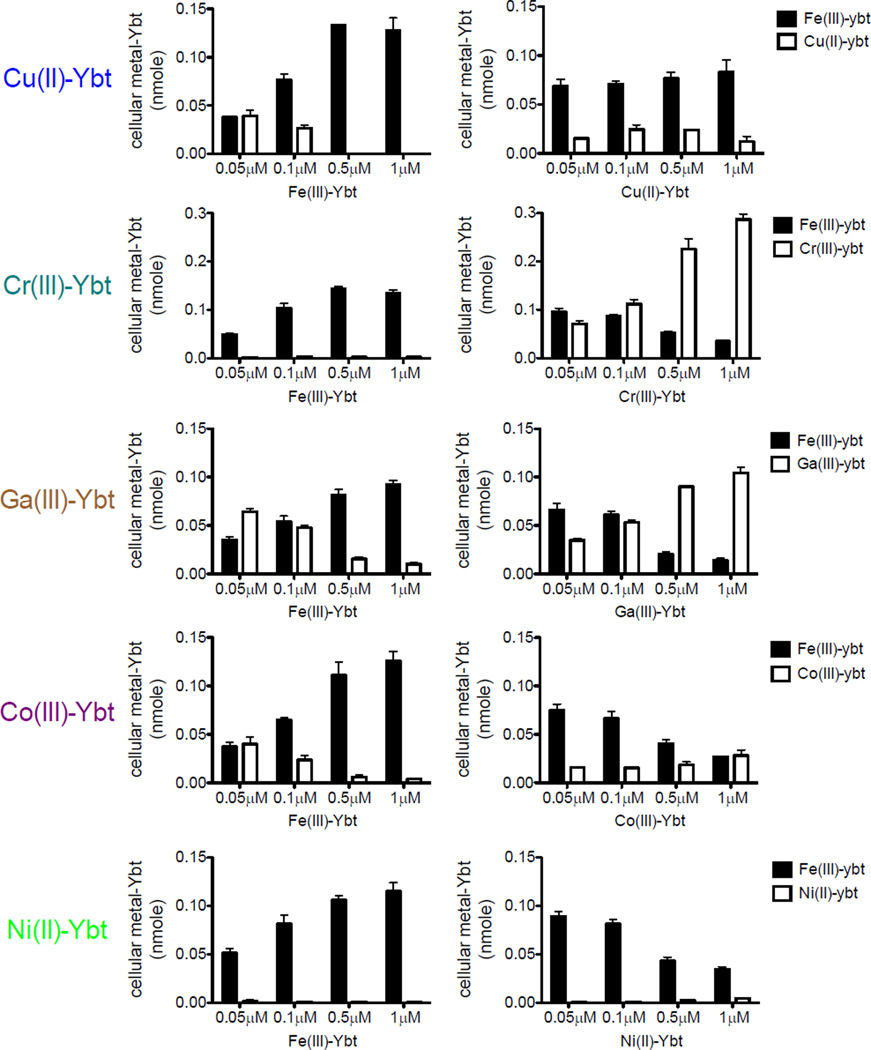
The specific molecular sequence of events by which FyuA imports yersiniabactin complexes is incompletely understood. To determine whether ferric and non-ferric-Ybt complexes are imported through a similar pathway and whether Fe(III)-Ybt is a preferred substrate, we measured import by MG1655 pfyuA exposed to both complexes under competitive conditions. Ectopic expression in MG1655 allows consistent FyuA expression for all experimental conditions, whereas native FyuA expression in UTI89 is subject to an incompletely understood regulatory network for yersiniabactin genes12. In this experimental system, increasing Fe(III)-Ybt concentrations in media containing 0.1 µM of each non-ferric-Ybt complex inhibited non-metal Ybt complex import (Fig 7, left) in the order Ni(II)~Cr(III) > Cu(II)~Co(III) > Ga(III). This is consistent with competitive inhibition of non-ferric yersiniabactin complex uptake by Fe(III)-Ybt, again suggesting a common uptake mechanism for all metal-yersiniabactin complexes.
Figure 7. Cu(II)-Ybt does not competitively inhibit Fe(III)-Ybt uptake.
MG1655 strains ectopically expressing FyuA were grown in rich media with the indicated concentrations of Fe(III)-Ybt and 0.1µM non-iron Ybt complexes (left) or the indicated concentrations of non-iron Ybt complexes and 0.1µM Fe(III)-Ybt (right). Fe(III)-Ybt levels are represented in black with non-ferric Ybt complexes in white. Results are shown as nanomoles, mean ± s.d.; n=3
When Fe(III)-Ybt was instead held constant at 0.1 µM and non-ferric-Ybt concentrations increased, all non-ferric-Ybt complexes with the notable exception of Cu(II)-Ybt competitively inhibited Fe(III)-Ybt import. Of note, while Ni(II)-Ybt inhibited Fe(III)-Ybt transport, cellular Ni(II)-Ybt levels remained low (Fig 7, right). Overall, Cu(II)-Ybt exhibited the most distinctive dose-response relationship, with diminished cell-associated Cu(II)-Ybt at higher concentrations and no discernable ability to inhibit Fe(III)-Ybt uptake. Distinctive transport properties of Cu(II)-Ybt may reflect contributions from differential FyuA binding, transport rate, and/or periplasmic dissociation. While the physiologically relevant Cu(II)-Ybt concentration range is unknown, Cu(II)-Ybt may reach high levels in the intracellular compartments of mammalian cells18, making FyuA’s ability to sustain import of scarce Fe(III)-Ybt a possible adaptation to this environment. This ability may reflect an interaction between FyuA and the distinctive Cu(II)-Ybt structure predicted above (Fig 3).
DISCUSSION
This study uses direct mass spectrometric detection to show that Ybt is a promiscuous trivalent and divalent metal chelator, forming stable complexes with physiologically relevant metal ions Fe(III), Cu(II), Ni(II), Co(III), and Cr(III). FyuA imports each stable Ybt complex in a TonB-dependent manner in the absence of other Yersinia HPI-encoded proteins. Fe(III)-Ybt competitively inhibits non-ferric Ybt uptake, consistent with a shared transport mechanism. Cu(II)-Ybt, however, does not competitively inhibit Fe(III)-Ybt import and exhibits maximal import at low (0.1 µM) extracellular concentrations. Together these findings provide new evidence for metal-selectivity by the yersiniabactin system (Fig 8) while demonstrating a new experimental framework for characterizing siderophore system metal specificity.
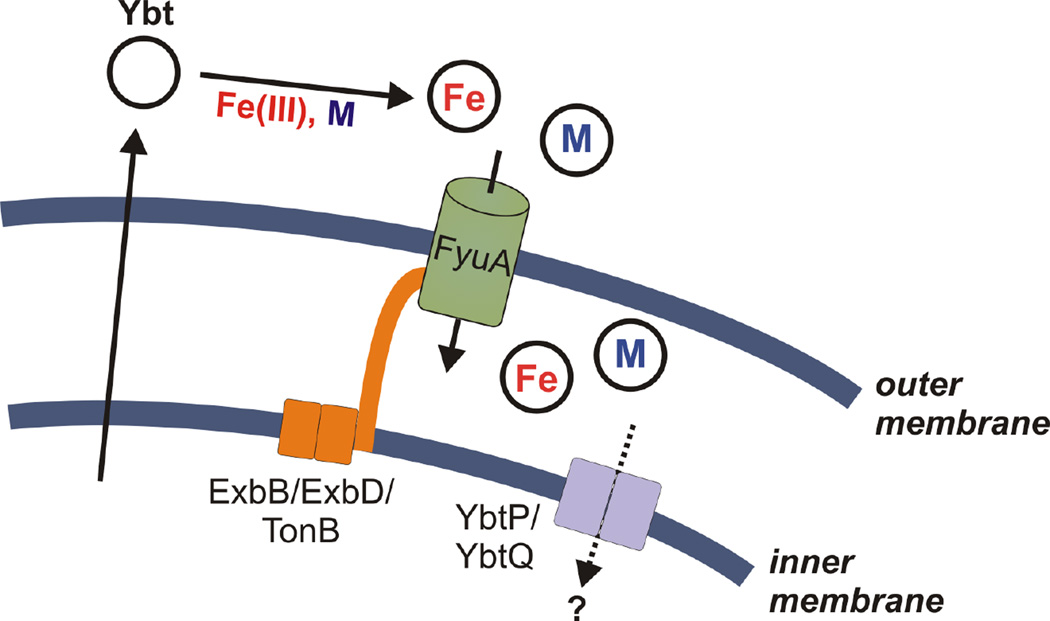
Figure 8. Metal-Ybt transport model.
Extracellular apo-Ybt interacts with Fe(III) (red) and select transition metals (light blue). Stable metal-Ybt complexes are transported through the outer membrane receptor, FyuA, in a TonB-dependent manner. The precise interactions between metal-Ybt and the inner membrane transporters YbtPQ, is not known.
Uropathogenic E. coli must adapt to numerous physiologic environments during infection pathogenesis. In these environments, the host may deliberately decrease the availability of iron and other transition metals to restrict microbial growth (nutritional immunity) and may increase copper availability as a microbicidal effector2, 18, 22, 23. Within an intracellular vesicle such as the macrophage phagolysosome, UPEC are confined to a small volume (~1.2×10⁻¹⁵ L)24 where iron is likely to be scarce while copper ions may be abundant. Yersiniabactin secretion within this space would therefore be expected to result in high local Cu(II)-Ybt concentrations. The distinctive ability of FyuA to maintain Fe(III)-Ybt import in the presence of excess Cu(II)-Ybt (Fig. 7) suggests that the yersiniabactin import system may have adapted to copper-rich intracellular compartments. Specifically, the yersiniabactin system distinguishes yersiniabactin bound to copper versus iron to avoid the toxic metal (copper) while still importing the nutritionally valuable one (iron). This is in agreement with previous works showing Ybt-mediated copper resistance in intracellular compartments17, 18, as well as observations by Braud et al., where expression of the siderophores pyoverdine and pyochelin by Pseudomonas aeruginosa increased copper resistance25. Further investigation is necessary to determine where these compartments might exist during urinary tract pathogenesis.
Cu(II)-Ybt’s distinctive ability to be transported at low concentrations without inhibiting Fe(III)-Ybt transport (Fig. 7) suggests a specific molecular interaction with Cu(II)-Ybt. While the nature of this interaction is currently unclear, DFT calculations raise the possibility that the distinctive “open” pentacoordinate form (Fig. 3) of Cu(II)-Ybt could enable protein interactions with the free carboxylic acid, the open axial Cu coordination site, or both. Copper specificity in E. coli ectopically expressing FyuA (Fig. 7) suggests that this protein may be the relevant discriminator. This could occur through an unrecognized allosteric site or through an intermediate site occupied during transport. Although TonB-dependent transporters (TBDT) have been the subject of multiple structural analyses, a better mechanistic understanding of their transport will be necessary to discern precisely how Cu(II)-Ybt-specificity is achieved3, 26.
Outside of endosomal compartments where copper availability and yersiniabactin concentrations are low, the yersiniabactin system may function as a copper scavenging (chalkophore) system27 (Fig. 6, 7). Yersiniabactin’s ability to form stable, FyuA-importable complexes with physiologically relevant copper, nickel, cobalt, and chromium ions may supply trace nutrients for pathogens beyond iron. Because bacterial metalloproteomes are incompletely understood; the full extent of transition metal demands exhibited by pathogenic bacteria at various stages of infection are unclear28. The lack of stable zinc and manganese Ybt complexes are notable. Recent work by Bobrov et al. linked Ybt to a distinctive, non-TonB-dependent zinc import pathway in Yersinia pestis involving the Yersinia HPI gene ybtX29. However as MG1655 lacks ybtX, our transport results do not implicate this gene in transport of the stable metal-Ybt complexes observed here. As with Bobrov et al., we were unable to observe stable Zn(II)-Ybt and further found that Zn(II) does not interfere with Fe(III)-Ybt formation. The selectivity of Ybt to bind Fe(III) despite excess Zn(II) may be advantageous for UPEC infecting males where it may encounter excess zinc in prostate glands30–32. Future studies of the UPEC metalloproteome will help fully discern roles for yersiniabactin-delivered metals in UTI pathogenesis.
The results described here suggest an approach to define siderophore-associated metallomes. Prior studies have demonstrated siderophore-mediated uptake of certain non-ferric metals in other siderophore systems using spectrometric and radiolabeling approaches25, 33–35. The quantitative mass spectrometry approach developed here allows us to directly compare siderophore interactions with a wide range of non-radioactive metals. Although this method is insensitive to transient or unstable Ybt complexes, weak complexes would appear to be of less biological significance unless stabilized by an additional component such as a binding protein.
EXPERIMENTAL
Bacterial strains, plasmids and culture conditions
The uropathogenic E. coli isolate UTI89 and the non-uropathogenic K-12 E. coli isolate MG1655 were used in this study36, 37. Strains were grown in LB agar (Becton, Dickson and Company), LB broth (Becton, Dickson and Company), YESCA (Yeast extract-Casamino acids) broth or M63 minimal media10 with antibiotics as appropriate. Ampicillin (100 µg/mL, Goldbio), kanamycin (50 µ/mL, Goldbio) were used for plasmid selection. In-frame deletions in UTI89 and MG1655 were made using the standard red recombinase method, using pKD4 or pKD13 as a template38. Deletions were confirmed using PCR with flanking primers. Antibiotic resistance insertions were removed by transforming the strains with pCP20 expressing the FLP recombinase. Plasmids were made using the pTrc99a vector39 and cloning in genes using standard PCR and recombination techniques.
Yersiniabactin and 13C-Yersiniabactin preparation
Apo-Ybt was generated from UTI89ΔentB grown in M63 minimal medium supplemented with 0.2% glycerol (v/v) and 10mg/ml niacin (Sigma) as previously described16. 13C-Ybt was produced by growing the UTI89Δfur strain in media supplemented with 13C-labeled glycerol as previously described16. Metal-Ybt complexes were generated by adding metals salts to culture supernatant to a final concentration of 10mM. The metal salts added were iron(III) chloride, copper(II) sulfate, nickel(II) nitrate, cobalt(II) chloride, chromium(II) chloride, gallium(III) nitrate, zinc(II) sulfate or manganese(II) chloride (Sigma), respectively. Metal-treated supernatants were incubated for 2 hours at 4 degrees and then applied to a methanol conditioned C18 silica column (Sigma). Samples were eluted with 80% methanol. Lyophilizer was used to concentrate the eluate overnight. Dried samples were resuspended in 20% methanol and further purified through high-performance liquid chromatography using C18 silica column (Whatman Partisil). The following gradient was used: Solvent A (0.1% (v/v) formic acid) was held constant at 80%, and solvent B (100% (v/v) acetonitrile in 0.1% formic acid (v/v)) was held constant at 20% for 2 min, then solvent B was increased to 100% by 20 min. Metal-Ybt containing fractions were collected, dried down using a lyophilizer and resuspended in deionized water. Isotope labeled metal-Ybt complexes were confirmed by LC-MS at corresponding masses.
Complex validation by ICP-MS
HPLC-purified metal-Ybt complexes were dried down using a lyophilizer and resuspended in ultrapure water and trace metal grade nitric acid (Fisher). Final concentration of nitric acid was 2% v/v. Samples were diluted 1:10 using 2% nitric acid solution, and metal concentrations were analyzed by high resolution ICP-MS (Agilent 7500 ICP-MS). Machine was calibrated using Environmental calibration standard (Agilent) and PerkinElmer Pure Plus ICP-MS standard (PerkinElmer).
Yersiniabactin complex preparations
Absorption spectra were measured using a quartz cuvette on a standard UV/Vis spectrometer (Beckman Coulter DU800). The Fe(III)-Ybt absorption spectra local maximum observed at 385 nm matched the previously reported local maximum40. Extinction coefficients using Beer’s law for each Ybt complex were determined using their distinctive local absorption maxima (Table 1) relative to absolute concentration determined by ICP-MS assuming the observed 1:1 (metal:Ybt) stoichiometry. These extinction coefficient values were used to determine metal-Ybt complex concentrations.
Table 1.
Calculated metal-Ybt extinction coefficient values
| metal-Ybt | local maximum (nm) | extinction coefficient |
|---|---|---|
| Fe(III)-Ybt | 385 | 5295 |
| Cu(II)-Ybt | 350 | 4578 |
| Cr(III)-Ybt | 350 | 3948 |
| Ga(III)-Ybt | 345 | 6448 |
| Co(III)-Ybt | 370 | 4076 |
| Ni(II)-Ybt | 355 | 5902 |
LC-MS
LC-MS analyses were conducted using a Shimadzu UFLC-equipped AB-Sciex 4000 QTrap operated in positive ion mode using the Turbo V ESI ion source and a Thermo LCQ Deca as previously described16. The samples were injected onto a Fused-core phenylhexyl column (100 × 2 mm, 2.7-µm particle, Ascentis Express, Supelco) with a flow rate of 0.4 ml per min. The following gradient was used: Solvent A (0.1% (v/v) formic acid) was held constant at 98%, and solvent B (90% (v/v) acetonitrile in 0.1% formic acid (v/v)) was held constant at 2% for 2 min, then solvent B was increased to 65% by 10 min and then to 98% by 12 min. The ion spray voltage was set to 5 kV. The heater temperature was 500 °C. The declustering potential, nebulizer gas (G1), auxiliary gas (G2) and collision energy were set at 110V, 40V, 35V and 35V, respectively.
LC-CNL analysis
The UFLC-4000 QTrap was used with settings described above to identify compounds with a common neutral fragment loss of 187 m/z units as shown previously16. The collision energy was set to 35 V, and the first mass analyzer (Q1) was set to scan from m/z 200 to 800 a.m.u., whereas the second mass analyzer (Q3) simultaneously scanned at 187 m/z units less than Q1. To identify 13C-labeled metal-Ybt samples, settings were changed to scan for 195-a.m.u. neutral loss.
Theoretical calculations
Theoretical calculations were performed to characterize the potential-energy surface (PES) associated with fragmentation and reaction as previously described17. Conformer spaces for precursors (cupric and ferric complexes with Ybt), and intermediates were explored by Monte Carlo/MMFF molecular mechanisms/dynamics methods. From these results, structures of precursors, intermediates, and scans for associated transition states were explored by using the PM3 semi-empirical algorithm41, both in Spartan42, for Linux v. Two (Wave function, Inc.). DFT (Density Functional Theory, part of Gaussian 03 and 09 suites, Gaussian Inc.) calculations were performed by using the PBE0 functional43, 44 (PBE1PBE in Gaussian parlance) with basis sets Def2-SVP and Def2-TZVP45. Minima and transition states were optimized at the level PBE1PBE/Def2-SVP and confirmed by vibrational frequency analysis. In addition, connections of transition states to minima were examined by inspection, projections along normal reaction coordinates, and path calculations as necessary. Single-point energies were calculated at level PBE1PBE/Def2-TZVP, and scaled thermal-energy corrections were applied using scaling factors for B3LYP/6-31G(d,p)46. Solvent-based single-point energies were calculated at the same level by using the CPCM polarizable conductor calculation model for water and using the Universal Force Field for atomic radii47. The hybrid functional and basis sets were chosen on basis of performance with transition metal complexes48, 49. DFT was selected for high-level calculations on pragmatic reasons because it requires overall less computational overhead than ab initio methods and performs adequately50–52. All results are reported in kcal/mol as enthalpies of formation relative to a selected, suitable precursor.
Yersiniabactin neutral has 4 labile protons and 12 Lewis base sites: 3N, 3S, 4O, and 2 classes of positions on the terminal salicylate moiety. The N, S, and O atoms are potential complexation sites with the metal ion. Yersiniabactin can interact with the metal ions using combinations of the Lewis base sites and variable coordination numbers to the metal. We chose as starting geometry for the ferric complex that based on the crystal structure: hexacoordinate octahedral involving complexion with 3N and 3O20 with high-spin Fe(III), S=5/2. Starting with yersiniabactin having the protons of the three hydroxyl moieties removed and complexed with ferric ion, we added sequentially protons, optimized, and determined enthalpies to which was added the next proton to that state of the complex and procedure repeated until the singly-charged positive-ion state was achieved. For other metal complexes, we substituted the metal cations for ferric, optimized geometries similarly, and determined optimum molecular-orbital spin state. For the other metals: Cu(II), S=1/2; Co(III), S=0: Ga(III), S=0, Ni(II), S=1, Cr(III), S=3/2.
Fe(III)-Ybt dependent growth
Following overnight growth in YESCA media, strains were normalized for starting OD600 in YESCA with 2mM EDDHA (Complete Green Company) and grown for 1 hour in 37 degrees while shaking. 1µM HPLC-purified Fe(III)-Ybt was added to strains and grown for 9 hours in 37 degrees while shaking. Bacterial growth was measured using OD600 readings as well as viable colony forming unit (CFU) measurements. Fold increase in growth was determined by calculating the ratio of CFU at end point over start point for every strain examined.
Cell-associated metal-Ybt
Following overnight growth in YESCA media, strains were diluted to OD600 of 0.8 in YESCA. HPLC-purified metal-Ybt was added to strains and grown for 30 minutes in 37 degrees while shaking. In case of multiple metal-Ybt complexes, metal-Ybt mixture in a cell-free control was conducted to check for changes in relative metal-Ybt ratios. Bacteria were pelleted at 7500 g for 10 minutes (Eppendorf) and washed with 1× PBS (Sigma). Bacteria were resupsended in 100% ethanol (Sigma) and pelleted at 20000 g for 10 minutes (Eppendorf). Supernatant was collected and dried overnight using a vacuum concentrator. Samples were resuspended in ultrapure water and applied to a conditioned C18 silica column with added 13C-labled Fe(III)-Ybt internal standard. Metal-Ybt quantification was carried out in the multiple reaction monitoring mode using known collision-induced dissociation fragmentations and 13C-labeled Fe(III)-Ybt internal standards.
Statistical Analyses
Statistics and graphs were generated using GraphPad Prism 5 (GraphPad software). Student’s t-test was used to compare growth differences and cell-associated metal-Ybt levels between paired strains.
Supplementary Material
Acknowledgments
J.P.H. holds a Career Award for Medical Scientists from the Burroughs Wellcome Fund and acknowledges National Institute of Diabetes and Digestive and Kidney Diseases grant R01DK099534. Mass spectrometry was supported by United States Public Health Service grants P41-RR00954, P60-DK20579, P30-DK56341 and P30HL101263. ICP-MS was supported by the Nano Research Facility at Washington University in St. Louis. Computations for this study were performed using the facilities of the Washington University Center for High Performance Computing and by the Washington University Computational Chemistry Facility, supported by NSF grant #CHE-0443501.
Footnotes
The authors have no conflicts of interest to declare.
REFERENCES
- 1.Miethke M, Marahiel MA. Microbiology and Molecular Biology Reviews. 2007;71:413–451. doi: 10.1128/MMBR.00012-07. [DOI] [PMC free article] [PubMed] [Google Scholar]
- 2.Hood MI, Skaar EP. Nature Reviews Microbiolgy. 2012;10:525–537. doi: 10.1038/nrmicro2836. [DOI] [PMC free article] [PubMed] [Google Scholar]
- 3.Noinaj N, Guillier M, Barnard TJ, Buchanan SK. Annu Rev Microbiol. 2010:43–60. doi: 10.1146/annurev.micro.112408.134247. [DOI] [PMC free article] [PubMed] [Google Scholar]
- 4.Perry RD, Fetherston JD. Microbes Infect. 2011;13:808–817. doi: 10.1016/j.micinf.2011.04.008. [DOI] [PMC free article] [PubMed] [Google Scholar]
- 5.Chu BC, Garcia-Herrero A, Johanson TH, Krewulak KD, Lau CK, Peacock RS, Slavinskaya Z, Vogel HJ. Biometals. 2010;23:601–6111. doi: 10.1007/s10534-010-9361-x. [DOI] [PubMed] [Google Scholar]
- 6.Fetherston JD, Bertolino VJ, Perry RD. Mol Microbiol. 1999;32:289–299. doi: 10.1046/j.1365-2958.1999.01348.x. [DOI] [PubMed] [Google Scholar]
- 7.Raymond KN, Dertz EA, Kim SS. Proc Natl Acad Sci U S A. 2003;100:3584–3588. doi: 10.1073/pnas.0630018100. [DOI] [PMC free article] [PubMed] [Google Scholar]
- 8.Schalk IJ. J Inorg Biochem. 2008;102:1159–1169. doi: 10.1016/j.jinorgbio.2007.11.017. [DOI] [PubMed] [Google Scholar]
- 9.Brem D, Pelludat C, Rakin A, Jacobi CA, Heesemann J. Microbiology. 2001;147:1115–1127. doi: 10.1099/00221287-147-5-1115. [DOI] [PubMed] [Google Scholar]
- 10.Henderson JP, Crowley JR, Pinkner JS, Walker JN, Tsukayama P, Stamm WE, Hooton TM, Hultgren SJ. PloS Pathogens. 2009;5 doi: 10.1371/journal.ppat.1000305. [DOI] [PMC free article] [PubMed] [Google Scholar]
- 11.Mabbetta AN, Uletta GC, Wattsa RE, Treea JJ, Totsikaa M, Onga C-lY, Wooda JM, Monaghanb W, Lookec DF, Nimmod GR, Svanborge C, Schembria MA. International Journal of Medical Microbiology. 2009 [Google Scholar]
- 12.Fetherston JD, Bearden SW, Perry RD. Mol Microbiol. 1996;22:315–325. doi: 10.1046/j.1365-2958.1996.00118.x. [DOI] [PubMed] [Google Scholar]
- 13.Perry RD, Balbo PB, Jones HA, Fetherston JD, DeMoll E. Microbiology. 1999:1181–1190. doi: 10.1099/13500872-145-5-1181. [DOI] [PubMed] [Google Scholar]
- 14.Reigstad CS, Hultgren SJ, Gordon JI. The Journal of Biological Chemistry. 2007;282:21259–21267. doi: 10.1074/jbc.M611502200. [DOI] [PubMed] [Google Scholar]
- 15.Hagan EC, Lloyd AL, Rasko DA, Faerber GJ, Mobley HLT. PloS Pathogens. 2010;6 doi: 10.1371/journal.ppat.1001187. [DOI] [PMC free article] [PubMed] [Google Scholar]
- 16.Chaturvedi KS, Hung CS, Crowley JR, Stapleton AE, Henderson JP. Nat Chem Biol. 2012 doi: 10.1038/nchembio.1020. [DOI] [PMC free article] [PubMed] [Google Scholar]
- 17.Chaturvedi KS, Hung CS, Giblin DE, Urushidani S, Austin AM, Dinauer MC, Henderson JP. ACS Chem Biol. 2013;9:551–561. doi: 10.1021/cb400658k. [DOI] [PMC free article] [PubMed] [Google Scholar]
- 18.White C, Lee J, Kambe T, Fritsche K, Petris MJ. J Biol Chem. 2009;284:33949–33956. doi: 10.1074/jbc.M109.070201. [DOI] [PMC free article] [PubMed] [Google Scholar]
- 19.Lukacik P, Barnard TJ, Keller PW, Chaturvedi KS, Seddiki N, Fairman aW, Noinaj N, Kirby TL, Henderson JP, Steven AC, Hinnebusch BJ, Buchanan SK. PNAS. 2012;109:9857–9862. doi: 10.1073/pnas.1203472109. [DOI] [PMC free article] [PubMed] [Google Scholar]
- 20.Miller MC, Parkin S, Fetherston JD, Perry RD, Demoll E. J Inorg Biochem. 2006;100:1495–1500. doi: 10.1016/j.jinorgbio.2006.04.007. [DOI] [PubMed] [Google Scholar]
- 21.Zaitseva I, Zaitsev V, Card G, Moshkov K, Bax B, Ralph A, Lindley P. JBIC Journal of Biological Inorganic Chemistry. 1996;1:15–23. [Google Scholar]
- 22.Fu Y, Chang FM, Giedroc DP. Acc Chem Res. 2014;47:3605–3613. doi: 10.1021/ar500300n. [DOI] [PMC free article] [PubMed] [Google Scholar]
- 23.Subashchandrabose S, Hazen TH, Brumbaugh AR, Himpsl SD, Smith SN, Ernst RD, Rasko DA, Mobley HL. Proc Natl Acad Sci U S A. 2014;111:18327–18332. doi: 10.1073/pnas.1415959112. [DOI] [PMC free article] [PubMed] [Google Scholar]
- 24.Winterbourn CC, Hampton MB, Livesey JH, Kettle AJ. J Biol Chem. 2006;281:39860–39869. doi: 10.1074/jbc.M605898200. [DOI] [PubMed] [Google Scholar]
- 25.Braud A, Geoffroy V, Hoegy F, Mislin GL, Schalk IJ. Environ Microbiol Rep. 2010;2:419–425. doi: 10.1111/j.1758-2229.2009.00126.x. [DOI] [PubMed] [Google Scholar]
- 26.Ma Z, Jacobsen FE, Giedroc DP. Chem Rev. 2009;109:4644–4681. doi: 10.1021/cr900077w. [DOI] [PMC free article] [PubMed] [Google Scholar]
- 27.Kenney GE, Rosenzweig AC. ACS Chem Biol. 2012;7:260–268. doi: 10.1021/cb2003913. [DOI] [PMC free article] [PubMed] [Google Scholar]
- 28.Cvetkovic A, Menon AL, Thorgersen MP, Scott JW, Poole FL, 2nd, Jenney FE, Jr, Lancaster WA, Praissman JL, Shanmukh S, Vaccaro BJ, Trauger SA, Kalisiak E, Apon JV, Siuzdak G, Yannone SM, Tainer JA, Adams MW. Nature. 2010;466:779–782. doi: 10.1038/nature09265. [DOI] [PubMed] [Google Scholar]
- 29.Bobrov AG, Kirillina O, Fetherston JD, Miller MC, Burlison JA, Perry RD. Mol Microbiol. 2014;93:759–775. doi: 10.1111/mmi.12693. [DOI] [PMC free article] [PubMed] [Google Scholar]
- 30.Zaichick V, Sviridova TV, Zaichick SV. Int Urol Nephrol. 1997;29:565–574. doi: 10.1007/BF02552202. [DOI] [PubMed] [Google Scholar]
- 31.Zhang DY, Azrad M, Demark-Wahnefried W, Frederickson CJ, Lippard SJ, Radford RJ. ACS Chem Biol. 2014 doi: 10.1021/cb500617c. [DOI] [PMC free article] [PubMed] [Google Scholar]
- 32.Kelleher SL, McCormick NH, Velasquez V, Lopez V. Adv Nutr. 2011;2:101–111. doi: 10.3945/an.110.000232. [DOI] [PMC free article] [PubMed] [Google Scholar]
- 33.Braud A, Hannauer M, Mislin GL, Schalk IJ. J Bacteriol. 2009;191:3517–3525. doi: 10.1128/JB.00010-09. [DOI] [PMC free article] [PubMed] [Google Scholar]
- 34.Emery T. Biochemistry. 1971;10:1483–1488. doi: 10.1021/bi00784a033. [DOI] [PubMed] [Google Scholar]
- 35.Ecker DJ, Emery T. J Bacteriol. 1983;155:616–622. doi: 10.1128/jb.155.2.616-622.1983. [DOI] [PMC free article] [PubMed] [Google Scholar]
- 36.Chen SL, Hung CS, Xu J, Reigstad CS, Magrini V, Sabo A, Blasiar D, Bieri T, Meyer RR, Ozersky P, Armstrong JR, Fulton RS, Latreille JP, Spieth J, Hooton TM, Mardis ER, Hultgren SJ, Gordon JI. Proc Natl Acad Sci U S A. 2006;103:5977–5982. doi: 10.1073/pnas.0600938103. [DOI] [PMC free article] [PubMed] [Google Scholar]
- 37.Mulvey MA, Schilling JD, Hultgren SJ. Infect Immun. 2001;69:4572–4579. doi: 10.1128/IAI.69.7.4572-4579.2001. [DOI] [PMC free article] [PubMed] [Google Scholar]
- 38.Datsenko KA, Wanner BL. PNAS. 2000;97:6640–6645. doi: 10.1073/pnas.120163297. [DOI] [PMC free article] [PubMed] [Google Scholar]
- 39.Amann E, Ochs B, Abel KJ. Gene. 1988;69:301–315. doi: 10.1016/0378-1119(88)90440-4. [DOI] [PubMed] [Google Scholar]
- 40.Drechsel H, Stephan H, Lotz R, Haag H, Zähner H, Hantke K, Jung G. European journal of organic chemistry. 1995:1727–1733. [Google Scholar]
- 41.Acevedo O, Jorgensen WL. Acc Chem Res. 2010;43:142–151. doi: 10.1021/ar900171c. [DOI] [PMC free article] [PubMed] [Google Scholar]
- 42.Ohlinger WS, Klunzinger PE, Deppmeier BJ, Hehre WJ. J Phys Chem A. 2009;113:2165–2175. doi: 10.1021/jp810144q. [DOI] [PubMed] [Google Scholar]
- 43.Fromager E. J Chem Phys. 2011;135:244106. doi: 10.1063/1.3671384. [DOI] [PubMed] [Google Scholar]
- 44.Zawada A, Kaczmarek-Kedziera A, Bartkowiak W. J Mol Model. 2012;18:3073–3086. doi: 10.1007/s00894-011-1312-0. [DOI] [PMC free article] [PubMed] [Google Scholar]
- 45.Morschel P, Janikowski J, Hilt G, Frenking G. J Am Chem Soc. 2008;130:8952–8966. doi: 10.1021/ja078242n. [DOI] [PubMed] [Google Scholar]
- 46.Bailey WC. J Mol Spectrosc. 1998;190:318–323. doi: 10.1006/jmsp.1998.7604. [DOI] [PubMed] [Google Scholar]
- 47.Cossi M, Rega N, Scalmani G, Barone V. J Comput Chem. 2003;24:669–681. doi: 10.1002/jcc.10189. [DOI] [PubMed] [Google Scholar]
- 48.Rydberg P, Olsen L. J Phys Chem A. 2009;113:11949–11953. doi: 10.1021/jp9035716. [DOI] [PubMed] [Google Scholar]
- 49.Ansbacher T, Srivastava HK, Martin JM, Shurki A. J Comput Chem. 2010;31:75–83. doi: 10.1002/jcc.21277. [DOI] [PubMed] [Google Scholar]
- 50.Scott AP, L R. J. Phys. Chem. 1996;100:16502–16513. [Google Scholar]
- 51.Shephard MJ, Paddon-Row MN. J. Phys. Chem. 1995;99:3101–3108. [Google Scholar]
- 52.Turecek F. J. Phys. Chem. 1998;102 [Google Scholar]
Associated Data
This section collects any data citations, data availability statements, or supplementary materials included in this article.


