

SUMMARY
Homeostatic mechanisms stabilize neural circuit function by keeping firing rates within a set-point range, but whether this process is gated by brain state is unknown. Here, we monitored firing rate homeostasis in individual visual cortical neurons in freely behaving rats as they cycled between sleep and wake states. When neuronal firing rates were perturbed by visual deprivation, they gradually returned to a precise, cell-autonomous set-point during periods of active wake, with lengthening of the wake period enhancing firing rate rebound. Unexpectedly, this resetting of neuronal firing was suppressed during sleep. This raises the possibility that memory consolidation or other sleep-dependent processes are vulnerable to interference from homeostatic plasticity mechanisms.
Graphical abstract
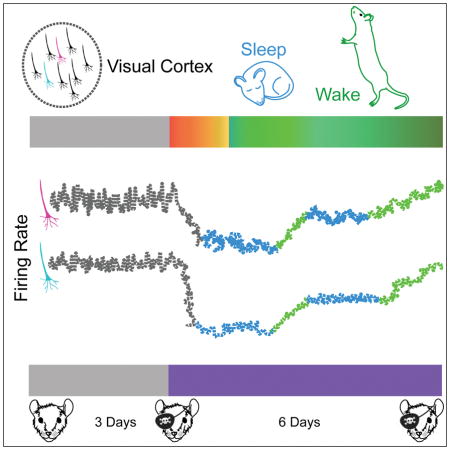
INTRODUCTION
Neocortical networks must generate and maintain stable activity patterns despite perturbations induced by learning and experience-dependent plasticity, and this stability must be maintained across distinct behavioral states with very different sensory drive and modulatory tone. There is abundant theoretical and experimental evidence that network stability is achieved through homeostatic plasticity mechanisms that adjust synaptic and neuronal properties to stabilize some measure of average activity (Turrigiano et al., 1998; Abbott and Nelson, 2000; Turrigiano and Nelson, 2004). This process has been extensively studied in primary visual cortex (V1), where chronic visual deprivation induces an initial drop in activity (Kaneko et al., 2008; Mrsic-Flogel et al., 2007, Keck et al., 2013) and ensemble average FRs (Hengen et al., 2013), but over time activity is restored to baseline despite continued deprivation. During this process it is unknown whether individual neurons regulate firing around a cell-autonomous set-point, or whether FR homeostasis is implemented only at the network level (as in vitro work suggests, Slomowitz et al., 2015). Further, it is unknown whether homeostatic plasticity in vivo is gated in some way by behavioral state. To address these questions we followed FR homeostasis in individual V1 neurons in freely behaving animals during a 9-day visual deprivation paradigm, as animals cycled between natural periods of sleep and wake.
The role of sleep and wake states in the induction of neocortical plasticity remains controversial. Cortical activity patterns, sensory drive, modulatory tone, and induction of plasticity all differ between sleep and wake (Frank and Cantera, 2014; Steriade and Timofeev, 2003; Jones, 2005). We showed previously that FR homeostasis restores ensemble average firing when measured during sleep or wake (Hengen et al., 2013), indicating that once homeostatic adjustments have occurred, they serve to stabilize the same network across these distinct internal states. However, this study did not address whether the induction of homeostatic plasticity might be confined to sleep or wake. An influential theory, the synaptic homeostasis hypothesis (SHY), asserts that Hebbian synaptic potentiation during waking increases FRs, and homeostatic mechanisms then restore FRs to baseline during subsequent sleep (Tononi and Cirelli, 2014). The SHY hypothesis thus makes the strong prediction that FR homeostasis will only be observed during sleep (Tononi and Cirelli, 2014). In contrast, another influential theory about the function of sleep, the sleep replay hypothesis (Abel et al., 2013), is agnostic about when FR homeostasis should occur. Although a number of experiments have been undertaken to test SHY (Frank and Cantera, 2014; Tononi and Cirelli, 2014), the key prediction of this hypothesis – that FR homeostasis triggered by a perturbation to the circuit should occur only during sleep – has never been tested.
Here we track firing of individual V1 neurons over many days during the induction of homeostatic plasticity. We find that prolonged monocular deprivation (MD) first depresses the firing of individual V1 neurons, but FRs then return precisely to the neuron’s own baseline despite continued deprivation, indicating that neocortical neurons in vivo regulate firing around an individual set-point. Further, we find that FR homeostasis is indeed gated by sleep/wake states, but the relationship is opposite what has been proposed (Tononi and Cirelli, 2014): sleep inhibits, rather than promotes, FR homeostasis. Thus it is the waking brain state that enables the expression of homeostatic plasticity. This exclusion of FR homeostasis from sleep states raises the intriguing possibility that memory consolidation or some other sleep-dependent process (Ji and Wilson, 2007, Wang et al., 2011) is vulnerable to interference from homeostatic plasticity mechanisms.
RESULTS
Chronic Monitoring of Firing Rates in Rodent V1
Monocular lid suture (MD) beginning after ~P23 induces a biphasic response in the contralateral monocular portion of V1 (V1m), in which activity is suppressed over the first two days through the induction of LTD and other depressive mechanisms (Smith et al., 2009); the consequent reduction in firing then activates a set of homeostatic plasticity mechanisms that restore firing to baseline over the next several days (Hengen et al., 2013; Keck et al., 2013; Mrsic-Flogel et al., 2007; Kaneko et al., 2008). To follow this process as it unfolds, we recorded extracellular signals continuously from both hemispheres of V1m in freely behaving animals for 9 days, beginning at P24, with MD commencing at P26. This paradigm allowed us to compare activity from the deprived and control hemispheres of V1m from the same animals. To identify individual cells we could follow throughout the experiment we conducted PCA-based clustering on the entire dataset from each electrode channel (2–60 million spikes/channel) (Fig. 1A, B). Single units were identified based on statistical measures of cluster quality and isolation (L-Ratio, Mahalanobis Distance, Isolation), as well as the presence of an absolute refractory period, and regular spiking units (RSUs, ~90% pyramidal) were identified based on waveform and spiking characteristics as described (Hengen et al., 2013; Cardin et al., 2007; Niell and Stryker, 2008). We considered single units identified in this way to be continuously recorded if spikes within the cluster were present for at least 80% of the 9-day recording period, as described in Methods and supplemental experimental procedures. All data and analysis reported here are from RSUs.
Figure 1. Firing of individual neurons in V1 followed continuously for nine days in freely behaving rats.

A) PCA clustering of spike waveforms from a single electrode across 9 days of recording. A subset of points is shown for clarity. On this wire, two clusters were identified algorithmically as separable single units (labeled by the pink/yellow spectrum and blue/purple spectrum). Points within a cluster are colored according to the day the spike was acquired. WavePC1 and Wave PC2 are the first two principal components of waveforms. WaveFFT is a weighted sum of the Fast Fourier Transform of waveforms. B) Cluster centroids were calculated and color-coded for each day of recording and overlaid on the cluster projections shown in (A). C) Mean waveform trace per 24h of recording was calculated for each of the two clusters, and color-coded as in (A). D) Mean waveform traces in (C) are peak-scaled and overlaid to demonstrate stability of waveforms for Cells 1 and 2. E) The sum of squared errors (SSE) for each continuous unit was calculated for all possible comparisons of the 9 waveforms, averaged across continuous units, and plotted (Continuous). This was compared to the SSE obtained when waveforms from continuous units were randomly shuffled and reassigned to mock units (Random Pairs). F) RSUs recorded for 9 days from control hemisphere of a representative animal. Here and below, gray and white bars represent 12h of dark and light, respectively. *** = p < 0.001. See also Figure S1 and S6.
A subset (approximately half) of RSUs, 4–15 units/16 channel array, could be continuously recorded, and the fraction of neurons that were “lost” during the experiment was similar for the control and deprived hemispheres (Chi-square test, p = 0.51). PCA-based clustering showed that these RSUs remained distinguishable throughout the recordings (Fig. 1A), and the centroid of clusters and the spike waveforms varied little across days (Fig. 1B–D, Fig. S1). To quantify this stability we produced peak-scaled average waveforms from each unit for each day (24h) of the recording, calculated the summed square error (SSE) of all possible comparisons between these average waveforms across days, and compared this to the error for randomly shuffled (peak normalized) units; the mean SSE was ~5 fold lower for continuously recorded RSUs (p<0.0001, n = 99 neurons, Fig 1E).
Due to the duration of these recordings, we were able to isolate sparsely firing units that, for shorter recordings, would not have generated enough spikes to constitute a robust cluster. As a result and consistent with prior evidence, V1m RSUs had average FRs that varied over many orders of magnitude (Hromadka et al., 2008; O’Connor et al., 2010; Roxin et al., 2011), from as slow as 0.02 Hz to as fast as 20 Hz (Fig. 1F, 3E). Despite this impressive range of average FRs, for individual neurons under control conditions average FRs remained remarkably stable throughout these long recordings (Fig. 1F, Fig. 3C–E).
Figure 3. Neurons return to an individual FR set-point during prolonged monocular deprivation.

A) Example plot of two simultaneously recorded neurons from the deprived hemisphere, showing FRs over three days of baseline and six days of monocular deprivation (MD). Eyelid suture was performed at arrow. B) The average, baseline-normalized FR plot of 44 neurons recorded from 6 animals during MD. Shaded area represents SEM. Gold arrow indicates time of lid suture. Dashed green line indicates a baseline-normalized FR of 1.0. C) FR changes in individual neurons during MD. For each control (gold) or deprive (purple) neuron mean FR on baseline day 3 (X-axis) was plotted against mean FR during early MD (MD2, Y-axis). D) Same as in (C), but for baseline vs late MD (~MD5, Y-axis). Inset: difference in rate between baseline and early or late MD, calculated for each neuron and then averaged by condition. E) Cumulative distribution of FRs for control neurons. Rank in the distribution was determined at baseline and color-coded for each neuron according to scale at right; the unique color of each neuron was carried forward in the cumulative distributions for early and late MD. F) Same as in (E), but for neurons from the deprived hemisphere. Inset: change in rank order. For each neuron the absolute difference in rank order between control and early or late MD was calculated, and this difference was averaged across conditions and expressed as % change from baseline. ** = p <0.01, **** = p<0.001.
Average FRs are Stable Across Behavioral States
The stability of V1m FRs over many days in freely behaving animals (Fig. 1F, 3E) raises the question of whether average firing is modulated by behavioral state or environmental factors. The reported effects of sleeping and waking on neocortical firing properties in freely behaving animals have been inconsistent, with some studies finding little effect on average firing (Evarts et al., 1962; Aton et al., 2009; Grossmark et al., 2012; Hengen et al., 2013), and others reporting differences of 25% or more (Abasolo et al., 2015; Steriade et al., 2001; Sullivan et al., 2014); generally these studies either followed the same neurons across very few epochs of each state or followed different ensembles across many epochs. Here we were able to compare the firing properties of the same neurons across many iterations of sleep and wake.
To differentiate wake and sleep states, we performed polysomnography using local field potentials, EMG, and video recordings to separate activity into epochs of sleep (rapid eye movement, REM; and slow-wave, non-REM; sleep), as well as epochs of quiet and active wake (Fig. 2A, Frank et al., 2001). As expected (Witting et al., 1993), animals slept more in the light (~7/12 hrs) than the dark (~5/12 hrs)(Fig. S2C–F), and in both phases cycled between many brief bouts of sleep and wake, with the average bout length being 17.98±0.55 and 18.21±0.67 minutes, respectively. Consistent with a previous report (Hengen et al., 2013), when FRs of individual neurons were normalized and averaged, there was no difference between states, although there was a non-significant trend towards slower rates during NREM (ANOVA = 0.08; Fig. 2B, Fig. S2A). Further, average firing was not strongly modulated by light or dark (Fig 2D, S2B); while this may seem counterintuitive, it is consistent with previous reports from rodent V1 (Fiser et al., 2004). Although state transitions produced small differences in the spike amplitudes of individual neurons, spike waveforms remained constant and single units remained distinguishable in Eigenspace across different behavioral states (Fig. S3).
Figure 2. Effects of sleep and wake states on cortical unit activity.

A) Polysomnography was used to identify behavioral states. Local field potential (LFP) spectral density plot (0 to 15 Hz; bottom) is shown for three state transitions. LFPs, EMGs, and motion recording were combined to identify vigilance states. B) The FR of each neuron in the various states was normalized to its rate during REM, and values were averaged across control neurons. C) The coefficient of variation (CV) was calculated for each neuron in each state and then averaged. D) Normalized average FRs were calculated as in (B), but for light and dark. E) The FR of a given cell in one state was plotted against its FR in another (i.e. Active versus Quiet wake; top left). The blue line is the unity line. ** = P < 0.01. See also Figure S2 and S3.
To further analyze the effects of state on FR we plotted the average firing of individual neurons during one state against their firing in another (Fig. 2E); values clustered around the unity line for Active vs Quiet Wake and for Wake (active and quiet) vs Sleep (REM and non-REM), indicating little difference in the average behavior of individual neurons as they transition between these states (Fig. 2E). In contrast, the same analysis for non-REM and REM states showed considerable variability in the behavior of the same individual neurons, with a subset of neurons showing higher rates during REM, as reported previously (Evarts et al., 1962; Rudolph et al., 2007). Finally, although average FRs between Sleep and Wake were not significantly different, the coefficient of variation (CV) of firing was significantly higher in the two waking states (Fig. 2C), which agrees with some previous data (Evarts et al., 1962, but see Scholvinck et al., 2015). These data show that despite differences in the pattern (Fig. 2A) and variance (Fig. 2C) of activity, the mean (set point) FRs of RSUs in V1 are largely independent of behavioral state.
Neocortical Neurons Have an Individual FR Set-Point
Two distinct mechanisms could account for previous descriptions of FR homeostasis in cortical networks. First, largely cell-autonomous plasticity mechanisms could generate an individual FR set point for each neuron, where this set-point value can vary widely (Fig. 1F, 3). Alternatively, the FR of individual neurons may be free to move within the distribution as long as both the ensemble average and the distribution of FRs (Hengen et al., 2013), is maintained. While in vitro data has supported this later possibility (Slomowitz et al., 2015), the answer in intact neocortical networks is unknown.
To distinguish between these possibilities we examined the FRs of individual neurons during the process of FR homeostasis. In juvenile rats, prolonged MD beginning at postnatal day 26 induces a drop in V1 ensemble average firing in the deprived hemisphere that reaches a nadir on the second day of deprivation (i.e. MD2); FRs then slowly return to baseline over the next several days (Hengen et al., 2013). Here we used this paradigm to examine the behavior of individual neurons as FRs rebound (Fig. 3A, B). Individual neurons in the deprived hemisphere showed the same drop and rebound as reported previously for the ensemble average (Hengen et al., 2013), with some variability in the time course from neuron to neuron (Fig. 3A). When individual FRs were normalized to baseline and averaged across animals (n = 44) the same pattern was apparent: firing dropped by ~60% by the end of MD2 (early MD), and then returned to baseline by MD5-6 (late MD; Fig. 3B).
Many individual neurons appeared to return very closely to their own baseline firing by late MD (Fig. 3A). To quantify this behavior across the entire population of continuously recorded neurons from the deprived hemisphere, we first plotted the FR of each neuron during the baseline period against its FR during early MD. This revealed that neurons were clustered around the unity line in the control hemisphere, while neurons in the deprived hemisphere were clustered below the unity line, indicating depression of firing across the population (Fig. 3C; here and below control n = 35 neurons from 5 animals, and deprived n = 44 neurons from 6 animals). In contrast, when baseline firing was plotted against firing during late MD, both control and deprived neurons were clustered around the unity line, indicating that FRs of deprived neurons had increased across the population and were statistically indistinguishable from control values (Fig. 3D). To determine how closely individual neurons returned to their own baseline we calculated the % difference between initial and final FRs for each neuron, and then averaged these values for early and late MD. Despite the huge range of initial FRs, deprived neurons returned to within (on average) ~15% of their baseline, measured 6 days earlier (Fig. 3D, inset). Notably this difference was similar for control neurons followed over the same time period (Fig. 3D, inset; deprived not different from control, p = 0.72).
To probe this further we plotted the cumulative distribution of average FRs for baseline, early MD, and late MD for both control (Fig. 3E) and deprived (Fig. 3F) neurons; neurons were color-coded by their initial position in the distribution (during baseline). The distribution for neurons from the control hemisphere did not shift significantly during either early or late MD (Fig. 3E, p < 0.11), whereas for the deprived hemisphere the distribution shifted to the left during early MD (p < 0.03), and shifted back to overlay the control distribution by late MD (Fig. 3F; p = 0.60). Control neurons appeared to change their order in the distribution little over time; to quantify this we calculated the change in rank order of individual neurons between baseline and early or late MD. Deprived neurons changed their order in the distribution more during early MD than control neurons (Fig. 3F, inset, p< 0.003), but by late MD had returned closer to their original order, and were not different from control (p = 0.99). Taken together these data show that, in contrast to what has been reported in culture (Slomowitz et al., 2015), neocortical neurons in vivo return quite precisely to an individual FR set point.
FR Homeostasis is Gated by Sleep/Wake States
During the process of FR homeostasis animals cycle between many brief bouts of sleep and wake, allowing us to ask whether or not FR homeostasis occurs continuously regardless of state (Fig. 4A, B). We began by calculating the average change in firing across each epoch type – REM, non-REM, Quiet wake and Active wake - during the rebound period (late MD2- late MD5). For each neuron we extracted all epochs of a given state during the rebound period (Fig. 4C, in this example, Active wake, colored boxes), expressed time as % of time in epoch (to normalize epochs of different lengths), normalized the FR, and then averaged firing across all epochs (Fig. 4D). Values were averaged across all control (Fig. 4E, n = 35) or all deprived (Fig. 4F, n = 44) neurons for each of the 4 states. For control neurons, there was little change across any epoch type, consistent with overall FR stability in the control hemisphere (Fig. 1F, 3E). Surprisingly, for deprived neurons the increase in firing was not evenly distributed across states but instead occurred primarily during Active wake (Fig. 4F). Further, when the fold change across epoch types was averaged and plotted for control and deprived neurons, only the Active wake condition was significantly different between control and deprived (Fig. 4G, p < 0.05). To confirm that this result was not influenced by our inclusion of only RSUs that could be followed for 9 days, we performed the same analysis on all single units from the deprived hemisphere that could be detected during the rebound period (116 RSUs from 6 animals). The results were consistent with those obtained from continuously recorded neurons: the only condition in which FRs changed significantly was Active wake (Fig. S4C).
Figure 4. Homeostatic rebound in FR occurs during active waking.

The rebound in firing of deprived neurons during late MD could happen continuously across behavioral states (A), or could be a discontinuous process that is gated by behavioral state (B). C) Schematic of state-dependent analysis of changes in FR during the rebound period of MD. (Left) Inset: example neuron from deprived hemisphere, showing drop and rebound during MD; gray box indicates the region expanded in plot below, with firing (30 s bins) colored according to the animal’s behavioral state. All instances of a state are identified (boxed regions), and D) data normalized on X and Y axes for each epoch; examples correspond to the colored boxes in (C). Data are then averaged (bottom purple panel) to produce the plots in (E) and (F). E) Fold change in firing across behavioral states for control neurons during late MD2-5. F) Same as in (B) but for deprived neurons. Inset compares fold changes across conditions. G) Quantification of the fold change in firing across epoch types for control and deprived neurons. H) Same analysis as in (F), but for L vs. D. * = p<0.05. See also Figure S4.
The rebound in firing spans several L/D cycles. To determine whether the increase in firing during Active wake epochs was modulated by environmental factors such as L/D or Zeitgeber time, we next divided the Active wake epochs into those occurring during either the L or the D phase. The firing of deprived neurons increased across Active wake epochs from both the L and D phases (Fig. 4H), suggesting that the wake-driven increase in firing is largely independent of circadian cycle or other environmental factors.
While the average length of sleep and wake epochs is ~18 minutes, there is a broad distribution of epoch durations, ranging from <1 minute to several hours (Fig. 5A). If FR homeostasis happens continuously during each active waking epoch, longer epochs should reveal a greater increase in FRs. To analyze this we divided epochs from the rebound period into quintiles by length, and plotted the average epoch length for each quintile against the fold change in firing. The activity of deprived neurons was stable across even the longest REM or non-REM epochs (Fig. 5B, one-way ANOVA, p > 0.90). For Quiet wake there was a non-significant trend for firing to increase during longer epochs; and finally, for Active wake the increase in firing was significantly larger for longer epochs (Fig. 5C, p = 0.007). This was confirmed through an independent analysis by sliding a 6h window across the data and examining the correlation between the % time spent awake and the change in firing; during rebound, there was a significant positive correlation for deprived but not control neurons (Fig. S5, p < 0.05).
Figure 5. Relationship between behavioral state duration and homeostatic rebound.

A) An example area plot of behavioral states from a single animal during a 24h day (12:12 light/dark), illustrating the variability in epoch length. Gray bar denotes dark period. B, C) The distribution of epoch lengths was divided into quintiles and the relationship between epoch length and fold change in firing during the rebound (quantified as in Fig. 4E, F) plotted for REM and non-REM sleep (B) or Active and Quiet wake (C). D) Example of extended waking protocol during the rebound, showing interspersed prolonged and natural waking epochs. E) Plot of fold change in firing during rebound for deprived neurons during prolonged (~1 hr duration) and natural (~5 min duration) waking epochs. Extended waking had no effect on firing of neurons in the control hemisphere (Control). ** = p <0.01; * = p<0.05.
To directly test whether length of active waking epochs modulates the amount of FR rebound we used a gentle handling paradigm (Kopp et al., 2006; Meerlo et al., 2008; Colavito et al., 2013) to extend the length of spontaneously occurring waking epochs during 24h of the rebound period. To avoid stress due to cumulative sleep deprivation we extended the length of every other natural waking epoch to one hour, then allowed the animal to sleep, wake, and sleep normally before extending the next waking epoch (Fig. 5D). We compared extended waking epochs (~1 hr duration) to interspersed natural waking epochs (4.6 mins ± 0.8 s duration). Consistent with our data showing that the amount of rebound is correlated with the length of natural waking epochs (Fig. 5C), we found that extended waking increased the amount of FR rebound in neurons from the deprived hemisphere (n = 24 neurons from 3 animals, p = 0.0013 compared to control hemisphere), while interspersed natural waking bouts, whose duration was comparable to the second shortest quintile of distribution times (Fig 5C), had no effect on firing (p = 0.78).
Some studies (Vyazovskiy et al., 2008, 2009) but not others (Grosmark et al., 2012) have observed an increase in firing across waking epochs. Our analyses of control neurons did not reveal such an increase (Fig. 4E, 5B); to determine if such an effect might be apparent for long epochs of wake or sleep, we identified 4-hr periods during the rebound that were either sleep- or wake-dense, meaning animals were asleep or awake for >65% of the epoch (Fig. 6A, Vyazovskiy et al., 2009). There was considerable variability in the behavior of neurons; when the change in firing across these wake- or sleep-dense periods for an ensemble of neurons was examined, individual epochs could result in a net increase, a net decrease, or no net change in firing (Fig. 6B). When this behavior was quantified and averaged for all such wake- and sleep-dense epochs for control neurons, there was no net change in firing during these long wake-dense episodes, nor was there a decrease in firing during sleep (Fig. 6C, n = 10 wake and 37 sleep episodes). In contrast, for deprived neurons during the rebound period, there was an increase in firing during wake-dense (p < 0.05) but not sleep-dense episodes (Fig. 6C, n = 23 wake and 34 sleep episodes).
Figure 6. Baseline firing is stable during long sleep and wake episodes.

A) We identified 4 hr periods that were sleep- or wake-dense (>65% sleep or wake), and quantified changes in firing for control neurons, or deprived neurons during the rebound period. Area plot from one animal showing the distribution of sleep and wake across a 24h period. Example sleep dense and wake dense blocks are identified in the gray boxes (blocks start at time “t” and end at “t+4”). B) Sleep and wake dense periods did not have consistent effects on the FRs of ensembles of single units in the control hemisphere. Example blocks demonstrate that both wake and sleep dense blocks could exhibit increasing rates, no net change, and decreasing rates. C) Quantification of FR changes averaged across all sleep- or wake-dense blocks. In control conditions (filled), firing is stable across both sleep- and wake-dense blocks of time. During MD, in the deprived hemisphere (open), FRs increased only in wake-dense periods. See also Figure S5.
These data show a selective increase in firing during Active waking epochs during the homeostatic rebound phase of MD. The above analysis does not preclude the possibility that abrupt increases in firing at transitions between states also contribute to the FR rebound. To examine this we measured changes in FR during state transitions, by comparing the FR during the last 30 s of one state to the FR during the first 30 s of the next state (Fig. 7A). We confined this analysis to behaviorally relevant state transitions (defined as those that made up >5% of all transitions). This analysis revealed little sign of discontinuities in firing between states, and no differences between control and deprived neurons (Fig. 7B, C, n = 35 control and 44 deprived neurons). These data indicate that the rebound in firing in the deprived hemisphere cannot be accounted for by abrupt increases in firing during transitions between vigilance states. Thus FR homeostasis is driven by an increase in firing during active wake epochs.
Figure 7. FR changes during state transitions.

A) Example of the firing activity of one neuron in 5-second bins (dots), colored by state. To consider the transition from NREM (purple) to REM (green), we calculated the ratio of the first thirty seconds of REM firing to the last thirty seconds of NREM firing (gray boxes). B) Quantification of the transition ratio (Rate B/Rate A) for all four states. The starting state (Rate A) is indicated at the top of each panel, and the ending state (Rate B) is color-coded. State transitions that represented less than five percent of all transitions were excluded from this plot for simplicity (e.g. REM to active waking). No state transitions differed significantly between control and deprived conditions (including those not plotted).
DISCUSSION
In this study we follow the firing of identified neocortical neurons as they undergo homeostatic plasticity in freely behaving animals in order to answer two key questions: whether neurons have an individual FR set-point around which their average firing is regulated, and whether the plasticity mechanisms that drive this process are gated by the behavioral state of the animal. We find that, even though the average FR of regular spiking (~90% pyramidal) neurons in V1 can differ by several orders of magnitude, each neuron maintains its average firing around an individual set-point, and returns very precisely to this set point when firing is perturbed by visual deprivation. Surprisingly, we also find that FR homeostasis in vivo is induced intermittently, during periods when the animal is awake and active. Thus this critical form of brain plasticity is suppressed during sleep and works to restore network stability only during waking states.
There is strong evidence that neocortical pyramidal neurons in vivo express a cell-autonomous form of homeostatic plasticity, synaptic scaling (Desai et al., 2002; Goel and Lee, 2007; Maffei and Turrigiano, 2008, Lambo et al., 2013), and that synaptic scaling contributes to the recovery in firing during prolonged MD (Hengen et al., 2013; Keck et al., 2013; Kaneko et al., 2008; Toyoizumi et al., 2014). Thus, the simplest explanation for how individual FRs are precisely restored during FR homeostasis is that this process is driven predominately by cell-autonomous plasticity mechanisms, and that there is a broad distribution of individual FR set points across neocortical neurons. Our data agree with previous findings that neocortical neurons have a wide distribution of mean firing rates (Hromadka et al., 2008; O’Connor et al., 2010; Roxin et al., 2011), but go further to suggest that this distribution is actively mantained by homeostatic mechanisms that regulate mean firing around cell-autonomous set points. Interesting and open questions are why neocortical neurons have such a wide range of firing rate set points, and how these set points are constructed at the cellular level.
Hebbian (correlation-based) plasticity and homeostatic plasticity cooperate to refine neocortical circuitry, but how they interact is unclear. In particular it is unknown whether they can operate simultaneously during experience-dependent plasticity, or whether they must be temporally segregated from one another to avoid interference. It has been suggested that Hebbian plasticity occurs primarily during waking when animals are actively sampling their environment, while homeostatic plasticity occurs during sleep when brain activity is disconnected from ongoing experiences (Tononi and Cirelli, 2014). Possible reasons to segregate the two forms of plasticity is potential interference due to activation of overlapping signaling cascades (Vitureira and Goda, 2013), or competition for control over postsynaptic strength parameters (Toyoizumi et al., 2014). Despite these theoretical considerations there has been little direct evidence for or against the notion that homeostatic plasticity is gated by sleep. Supposed molecular correlates of Hebbian and homeostatic plasticity vary with sleep and wake (Cirelli et al., 2004), but it is difficult to map these global changes onto specific plasticity mechanisms within neocortical circuits (Nelson and Turrigiano, 2008).
The most direct evidence for sleep-driven homeostatic plasticity is that the frequency (but not amplitude) of miniature excitatory postsynaptic currents (mEPSCs) was higher in brain slices harvested from animals during the dark phase (wake-dense) than the light phase (sleep-dense; Liu et al., 2010); however, the relationship between changes in mEPSC frequency and synaptic strength is unclear, and neocortical synaptic scaling is generally reported to affect mEPSC amplitude (and thus postsynaptic strength) rather than mEPSC frequency (Turrigiano, 2012). A similar experimental paradigm was used to show that neocortical FRs were higher after a wake-dense period and lower after a sleep-dense period, consistent with the idea that net synaptic potentiation during wake drives an increase in firing, while net synaptic downscaling during sleep drives a decrease in firing (Vyazovskiy et al., 2009). In contrast, here we find no net change in firing across wake or sleep under baseline conditions. The root cause of this difference is unclear, but could be due to brain region or other methodological differences. Our data argue against the notion that simply being awake in a familiar environment is sufficient to drive Hebbian potentiation of synapses and an increase in FRs.
The strongest test of whether homeostatic plasticity is gated by behavioral state is to provide a perturbation sufficient to trigger homeostatic compensation, and then determine when this compensation occurs. We used a firmly established paradigm (monocular deprivation) to first depress FRs, and then continuously monitored the process of FR homeostasis over the next several days as FRs returned to baseline. Surprisingly, the expression of homeostasis was not continuous, nor did it emerge during sleep as the SHY hypothesis predicts. Instead, we found that FRs were stable during sleep, and increased significantly only during epochs of active wake. Longer active wake epochs induced more homeostatic compensation, as did artificially extending the length of wake epochs. Recordings from the control hemisphere (where FRs were stable) showed that the same behavioral state changes had no effect on the FRs of neurons whose activity had not been depressed. Although the increase in firing occurs during active wake epochs, when averaged across many hours of recording FRs are not different between sleep and wake even during the rebound phase of MD (Hengen et al., 2013). This is because sleep and wake epochs are short and interspersed, so each increase in firing that happens during a wake epoch will also elevate activity during the next sleep epoch. Our data show that, during FR homeostasis, FRs rise slightly during each epoch of active waking, and this increase in firing is then maintained during subsequent epochs of REM and non-REM sleep but does not increase further until the next epoch of active waking. Thus the cellular and circuit changes that drive the homeostatic increase in firing are able to keep firing elevated across distinct behavioral states.
How active waking enables FR homeostasis is unclear, but one possibility is that a change in neuromodulatory tone specific to the active waking state (Constantinople and Bruno, 2011; Steriade et al., 1993) is permissive for the expression of homeostatic plasticity. Alternatively, it could be that vascular changes during sleep (Xie et al., 2013) suppress FR homeostasis by washing out some permissive diffusible factor (such as TNF alpha, Steinmetz and Turrigiano, 2010; Stellwagen and Malenka, 2006; Kaneko et al., 2008). While it is not clear whether active waking enables FR homeostasis or sleep suppresses it, the fact that FR homeostasis was largely excluded from REM, non-REM, and quiet waking suggests the former possibility is the most likely.
Homeostatic plasticity is thought to be a slow, transcription-dependent process (Goold and Nicoll, 2010; Ibata et al., 2008), so it is quite surprising that it can be turned off and on in a matter of minutes. It is possible that we only see significant compensation during longer waking epochs because of the time-dependence of activating a transcription-dependent process, although this time-scale (~10 minutes) is still quite rapid for turning transcription on and off (Flavell and Greenberg, 2008). Alternatively, it could be that the induction mechanisms underlying homeostatic compensation are turned on continuously when FRs are perturbed from the set point, and plasticity is gated at the level of the expression mechanism(s). For example, the final step in the expression of synaptic scaling up is the enhanced accumulation of synaptic glutamate receptors (Gainey et al., 2009); it is possible that homeostatic plasticity is gated at this final step, such that the receptor accumulation process is primed but enabled only during the active waking state.
It seems unlikely that expression of homeostatic plasticity is excluded from sleep because all forms of Hebbian plasticity must be temporally segregated from all forms of homeostatic plasticity. While some forms of plasticity within V1 require sleep for their expression (Aton et al., 2013; Aton et al., 2014), LTP and LTD-like mechanisms are also likely to be driven by changes in visual experience during active exploratory states (Sawtell et al., 2003; Nelson and Turrigiano, 2008), where our data show they would be co-active with homeostatic mechanisms. The exclusion of FR homeostasis from sleep instead raises the possibility that homeostatic plasticity interferes with a process exclusive to sleep (Abel et al., 2013).
EXPERIMENTAL PROCEDURES
All surgical techniques and experimental procedures were conducted in accordance with the Brandeis University IACUC and NIH guidelines.
In vivo data collection and spike-sorting
Extracellular recordings, experimental design, and data collection were as described previously (Hengen et al., 2013); additionally, bilateral EMG wires were implanted deep in the nuchal muscle. Data were collected continuously for nine days from 11 juvenile Long-Evans rats of both sexes. Three days of baseline activity were collected prior to a 6d MD protocol.
Waveforms were identified via a threshold method (−4 standard deviations), and individual spike characteristics were quantified for dimensionality reduction (MClust version 4.3, A. D. Redish, http://redishlab.neuroscience.umn.edu/MClust/MClust.html). These characteristics were then passed to a clustering algorithm (Harris et al., 2000). Researchers were blind to experimental condition during all spike sorting and related analyses.
Briefly, we considered a cell to be continuously recorded when 1) clustering data from the entire experiment yielded a single unit, 2) biophysical properties were consistent with single units (i.e. refractory period), 3) spike shapes were uniform across the experiment (Fig. 1D, E), and 4) the signal to noise ratio was consistently high. We used rate and SSE to determine when a cell was “lost” (Fig. S6A, B). Both methods revealed the same results (Fig. 4F; Fig. S4A, B, E).
Polysomnography
Arousal state was manually scored using custom software (MATLAB). Briefly, the LFP spectral power (0.3–15 Hz) was extracted from three channels across two hemispheres and averaged. EMG signals were bandpass filtered (10–200 Hz). EMG and LFP data were synchronized with video recordings and researchers identified state transitions using standard guidelines (Coleman et al., 2004).
Analysis of FRs within Epochs
Spike times of neurons were divided into discrete epochs of behavioral state. Activity during each epoch was separated into 100 bins to normalize time, and then normalized to its own activity in the first 25% of a given epoch (such that each epoch for each neuron started at 1.0). All epochs of a given state were then averaged for each neuron, and all neurons were then averaged within a condition (i.e. control, rebound).
Extended waking
Natural waking epochs were extended to 1 hour between ZT0 on MD3 and ZT0 on MD4, using a gentle handling paradigm. Animals were monitored for a naturally occurring wake epochs, and then gentle interventions were used to extend every other wake epoch to 60 minutes. Animals were allowed to sleep in between extended and natural wake epochs.
Statistics
The data are reported as mean ± SEM for the number of neurons or animals indicated, unless otherwise noted. Statistical tests were as follows. One way single factor ANOVA followed by a posthoc Tukey test was used for comparing multiple means. For paired data (i.e. the same cell, or the same animal ensemble average, compared at different times) paired t-tests were used. For data that were not clearly normally distributed the non-parametric Mann-Whitney U test was used. For all tests with multiple comparisons a Bonferroni correction was used. To compare cumulative distributions a Kolmogorov-Smirnov test was used. Statistical significance was considered to be p<0.05, unless otherwise noted.
Supplementary Material
Highlights.
Individual neocortical neurons were followed continuously during visual deprivation
Control neurons have stable mean firing rates across behavioral states
Perturbation by visual deprivation reveals a cell-autonomous firing rate set-point
Homeostatic recovery of firing is enabled by wake and inhibited by sleep states
Acknowledgments
Supported by R01EY014439 and R37NS092635(GGT) and K99NS089800-01 (KBH). We thank A. Kashanchi and E. Zheng for technical help with sleep/wake coding, and D.B. Katz, M. Frank, P. Garrity, E. Marder, L. Griffith, and S. Jadhav for useful discussions and suggestions.
Footnotes
AUTHOR CONTRIBUTIONS
Conceptualization, K.B.H., G.G.T.; Methodology, K.B.H., G.G.T., S.V.H.; Software, K.B.H., S.V.H., A.T.P., J.N.M; Formal Analysis, K.B.H., S.V.H., A.T.P., G.G.T.; Investigation, K.B.H., A.T.P., J.N.M; Data Curation, K.B.H., A.T.P.; Writing – Original Draft, K.B.H., G.G.T.; Writing – Review & Editing, K.B.H., G.G.T., S.V.H.; Visualization, K.B.H.; Resources, G.G.T., S.V.H.; Funding Acquisition, G.G.T., K.B.H.
Publisher's Disclaimer: This is a PDF file of an unedited manuscript that has been accepted for publication. As a service to our customers we are providing this early version of the manuscript. The manuscript will undergo copyediting, typesetting, and review of the resulting proof before it is published in its final citable form. Please note that during the production process errors may be discovered which could affect the content, and all legal disclaimers that apply to the journal pertain.
References
- Abasolo D, Simons S, Morgado da Silva R, Tononi G, Vyazovskiy VV. Lempel-Ziv complexity of cortical activity during sleep and waking in rats. J Neurophysiol. 2015;113:2742–2752. doi: 10.1152/jn.00575.2014. [DOI] [PMC free article] [PubMed] [Google Scholar]
- Abbott LF, Nelson SB. Synaptic plasticity: taming the beast. Nat Neurosci. 2000;3:1178–1183. doi: 10.1038/81453. [DOI] [PubMed] [Google Scholar]
- Abel T, Havekes R, Saletin JM, Walker MP. Sleep, plasticity and memory from molecules to whole-brain networks. Curr Biol. 2013;23:R774–788. doi: 10.1016/j.cub.2013.07.025. [DOI] [PMC free article] [PubMed] [Google Scholar]
- Aton SJ, Broussard C, Dumoulin M, Seibt J, Watson A, Coleman T, Frank MG. Visual experience and subsequent sleep induce sequential plastic changes in putative inhibitory and excitatory cortical neurons. Proc Natl Acad Sci U S A. 2013;110:3101–3106. doi: 10.1073/pnas.1208093110. [DOI] [PMC free article] [PubMed] [Google Scholar]
- Aton SJ, Seibt J, Dumoulin M, Jha SK, Steinmetz N, Coleman T, Naidoo N, Frank MG. Mechanisms of sleep-dependent consolidation of cortical plasticity. Neuron. 2009;61:454–466. doi: 10.1016/j.neuron.2009.01.007. [DOI] [PMC free article] [PubMed] [Google Scholar]
- Aton SJ, Suresh A, Broussard C, Frank MG. Sleep promotes cortical response potentiation following visual experience. Sleep. 2014;37:1163–1170. doi: 10.5665/sleep.3830. [DOI] [PMC free article] [PubMed] [Google Scholar]
- Burrone J, Murthy VN. Synaptic plasticity: rush hour traffic in the AMPA lanes. Curr Biol. 2001;11:R274–277. doi: 10.1016/s0960-9822(01)00137-3. [DOI] [PubMed] [Google Scholar]
- Cardin JA, Palmer LA, Contreras D. Stimulus feature selectivity in excitatory and inhibitory neurons in primary visual cortex. J Neurosci. 2007;27:10333–10344. doi: 10.1523/JNEUROSCI.1692-07.2007. [DOI] [PMC free article] [PubMed] [Google Scholar]
- Cirelli C, Gutierrez CM, Tononi G. Extensive and divergent effects of sleep and wakefulness on brain gene expression. Neuron. 2004;41:35–43. doi: 10.1016/s0896-6273(03)00814-6. [DOI] [PubMed] [Google Scholar]
- Clopath C, Busing L, Vasilaki E, Gerstner W. Connectivity reflects coding: a model of voltage-based STDP with homeostasis. Nat Neurosci. 2010;13:344–352. doi: 10.1038/nn.2479. [DOI] [PubMed] [Google Scholar]
- Coleman CG, Lydic R, Baghdoyan HA. M2 muscarinic receptors in pontine reticular formation of C57BL/6J mouse contribute to rapid eye movement sleep generation. Neuroscience. 2004;126:821–830. doi: 10.1016/j.neuroscience.2004.04.029. [DOI] [PubMed] [Google Scholar]
- Constantinople CM, Bruno RM. Effects and mechanisms of wakefulness on local cortical networks. Neuron. 2011;69:1061–1068. doi: 10.1016/j.neuron.2011.02.040. [DOI] [PMC free article] [PubMed] [Google Scholar]
- Desai NS, Cudmore RH, Nelson SB, Turrigiano GG. Critical periods for experience-dependent synaptic scaling in visual cortex. Nat Neurosci. 2002;5:783–789. doi: 10.1038/nn878. [DOI] [PubMed] [Google Scholar]
- Evarts EV, Bental E, Bihari B, Huttenlocher PR. Spontaneous discharge of single neurons during sleep and waking. Science. 1962;135:726–728. doi: 10.1126/science.135.3505.726. [DOI] [PubMed] [Google Scholar]
- Fiser J, Chiu C, Weliky M. Small modulation of ongoing cortical dynamics by sensory input during natural vision. Nature. 2004;431:573–578. doi: 10.1038/nature02907. [DOI] [PubMed] [Google Scholar]
- Flavell SW, Greenberg ME. Signaling mechanisms linking neuronal activity to gene expression and plasticity of the nervous system. Annu Rev Neurosci. 2008;31:563–590. doi: 10.1146/annurev.neuro.31.060407.125631. [DOI] [PMC free article] [PubMed] [Google Scholar]
- Frank MG, Cantera R. Sleep, clocks, and synaptic plasticity. Trends Neurosci. 2014;37:491–501. doi: 10.1016/j.tins.2014.06.005. [DOI] [PMC free article] [PubMed] [Google Scholar]
- Frank MG, Issa NP, Stryker MP. Sleep enhances plasticity in the developing visual cortex. Neuron. 2001;30:275–287. doi: 10.1016/s0896-6273(01)00279-3. [DOI] [PubMed] [Google Scholar]
- Gainey MA, Hurvitz-Wolff JR, Lambo ME, Turrigiano GG. Synaptic scaling requires the GluR2 subunit of the AMPA receptor. J Neurosci. 2009;29:6479–6489. doi: 10.1523/JNEUROSCI.3753-08.2009. [DOI] [PMC free article] [PubMed] [Google Scholar]
- Goel A, Lee HK. Persistence of experience-induced homeostatic synaptic plasticity through adulthood in superficial layers of mouse visual cortex. J Neurosci. 2007;27:6692–6700. doi: 10.1523/JNEUROSCI.5038-06.2007. [DOI] [PMC free article] [PubMed] [Google Scholar]
- Goold CP, Nicoll RA. Single-cell optogenetic excitation drives homeostatic synaptic depression. Neuron. 2010;68:512–528. doi: 10.1016/j.neuron.2010.09.020. [DOI] [PMC free article] [PubMed] [Google Scholar]
- Grosmark AD, Mizuseki K, Pastalkova E, Diba K, Buzsaki G. REM sleep reorganizes hippocampal excitability. Neuron. 2012;75:1001–1007. doi: 10.1016/j.neuron.2012.08.015. [DOI] [PMC free article] [PubMed] [Google Scholar]
- Harris KD, Henze DA, Csicsvari J, Hirase H, Buzsaki G. Accuracy of tetrode spike separation as determined by simultaneous intracellular and extracellular measurements. J Neurophysiol. 2000;84:401–414. doi: 10.1152/jn.2000.84.1.401. [DOI] [PubMed] [Google Scholar]
- Hengen KB, Lambo ME, Van Hooser SD, Katz DB, Turrigiano GG. FR homeostasis in visual cortex of freely behaving rodents. Neuron. 2013;80:335–342. doi: 10.1016/j.neuron.2013.08.038. [DOI] [PMC free article] [PubMed] [Google Scholar]
- Hromadka T, Deweese MR, Zador AM. Sparse representation of sounds in the unanesthetized auditory cortex. PLoS Biol. 2008;6:e16. doi: 10.1371/journal.pbio.0060016. [DOI] [PMC free article] [PubMed] [Google Scholar]
- Ibata K, Sun Q, Turrigiano GG. Rapid synaptic scaling induced by changes in postsynaptic firing. Neuron. 2008;57:819–826. doi: 10.1016/j.neuron.2008.02.031. [DOI] [PubMed] [Google Scholar]
- Ji D, Wilson MA. Coordinated memory replay in the visual cortex and hippocampus during sleep. Nat Neurosci. 2007;10:100–107. doi: 10.1038/nn1825. [DOI] [PubMed] [Google Scholar]
- Jones BE. From waking to sleeping: neuronal and chemical substrates. Trends Pharmacol Sci. 2005;26:578–586. doi: 10.1016/j.tips.2005.09.009. [DOI] [PubMed] [Google Scholar]
- Kaneko M, Stellwagen D, Malenka RC, Stryker MP. Tumor necrosis factor-alpha mediates one component of competitive, experience-dependent plasticity in developing visual cortex. Neuron. 2008;58:673–680. doi: 10.1016/j.neuron.2008.04.023. [DOI] [PMC free article] [PubMed] [Google Scholar]
- Keck T, Keller GB, Jacobsen RI, Eysel UT, Bonhoeffer T, Hubener M. Synaptic scaling and homeostatic plasticity in the mouse visual cortex in vivo. Neuron. 2013;80:327–334. doi: 10.1016/j.neuron.2013.08.018. [DOI] [PubMed] [Google Scholar]
- Lambo ME, Turrigiano GG. Synaptic and intrinsic homeostatic mechanisms cooperate to increase L2/3 pyramidal neuron excitability during a late phase of critical period plasticity. J Neurosci. 2013;33:8810–8819. doi: 10.1523/JNEUROSCI.4502-12.2013. [DOI] [PMC free article] [PubMed] [Google Scholar]
- Liu ZW, Faraguna U, Cirelli C, Tononi G, Gao XB. Direct evidence for wake-related increases and sleep-related decreases in synaptic strength in rodent cortex. J Neurosci. 2010;30:8671–8675. doi: 10.1523/JNEUROSCI.1409-10.2010. [DOI] [PMC free article] [PubMed] [Google Scholar]
- Maffei A, Turrigiano GG. Multiple modes of network homeostasis in visual cortical layer 2/3. J Neurosci. 2008;28:4377–4384. doi: 10.1523/JNEUROSCI.5298-07.2008. [DOI] [PMC free article] [PubMed] [Google Scholar]
- Mrsic-Flogel TD, Hofer SB, Ohki K, Reid RC, Bonhoeffer T, Hubener M. Homeostatic regulation of eye-specific responses in visual cortex during ocular dominance plasticity. Neuron. 2007;54:961–972. doi: 10.1016/j.neuron.2007.05.028. [DOI] [PubMed] [Google Scholar]
- Nelson SB, Turrigiano GG. Strength through diversity. Neuron. 2008;60:477–482. doi: 10.1016/j.neuron.2008.10.020. [DOI] [PMC free article] [PubMed] [Google Scholar]
- Niell CM, Stryker MP. Highly selective receptive fields in mouse visual cortex. J Neurosci. 2008;28:7520–7536. doi: 10.1523/JNEUROSCI.0623-08.2008. [DOI] [PMC free article] [PubMed] [Google Scholar]
- O’Connor DH, Peron SP, Huber D, Svoboda K. Neural activity in barrel cortex underlying vibrissa-based object localization in mice. Neuron. 2010;67:1048–1061. doi: 10.1016/j.neuron.2010.08.026. [DOI] [PubMed] [Google Scholar]
- Roxin A, Brunel N, Hansel D, Mongillo G, van Vreeswijk C. On the distribution of FRs in networks of cortical neurons. J Neurosci. 2011;31:16217–16226. doi: 10.1523/JNEUROSCI.1677-11.2011. [DOI] [PMC free article] [PubMed] [Google Scholar]
- Rudolph M, Pospischil M, Timofeev I, Destexhe A. Inhibition determines membrane potential dynamics and controls action potential generation in awake and sleeping cat cortex. J Neurosci. 2007;27:5280–5290. doi: 10.1523/JNEUROSCI.4652-06.2007. [DOI] [PMC free article] [PubMed] [Google Scholar]
- Sawtell NB, Frenkel MY, Philpot BD, Nakazawa K, Tonegawa S, Bear MF. NMDA receptor-dependent ocular dominance plasticity in adult visual cortex. Neuron. 2003;38:977–985. doi: 10.1016/s0896-6273(03)00323-4. [DOI] [PubMed] [Google Scholar]
- Scholvinck ML, Saleem AB, Benucci A, Harris KD, Carandini M. Cortical state determines global variability and correlations in visual cortex. J Neurosci. 2015;35:170–178. doi: 10.1523/JNEUROSCI.4994-13.2015. [DOI] [PMC free article] [PubMed] [Google Scholar]
- Slomowitz E, SB, Vertkin I, Milshtein-Parush H, Nelken I, Slutsky M, Slutsky I. Interplay between population firing stability and single neuron dynamics in hippocampal networks. eLife. 2015;4 doi: 10.7554/eLife.04378. [DOI] [PMC free article] [PubMed] [Google Scholar]
- Smith GB, Heynen AJ, Bear MF. Bidirectional synaptic mechanisms of ocular dominance plasiticity in visual cortex. Philos Trans R Soc Lond B Biol Sci. 2009;364:357–67. doi: 10.1098/rstb.2008.0198. [DOI] [PMC free article] [PubMed] [Google Scholar]
- Steinmetz CC, Turrigiano GG. Tumor necrosis factor-alpha signaling maintains the ability of cortical synapses to express synaptic scaling. J Neurosci. 2010;30:14685–14690. doi: 10.1523/JNEUROSCI.2210-10.2010. [DOI] [PMC free article] [PubMed] [Google Scholar]
- Stellwagen D, Malenka RC. Synaptic scaling mediated by glial TNF-alpha. Nature. 2006;440:1054–1059. doi: 10.1038/nature04671. [DOI] [PubMed] [Google Scholar]
- Steriade M, McCormick DA, Sejnowski TJ. Thalamocortical oscillations in the sleeping and aroused brain. Science. 1993;262:679–685. doi: 10.1126/science.8235588. [DOI] [PubMed] [Google Scholar]
- Steriade M, Timofeev I. Neuronal plasticity in thalamocortical networks during sleep and waking oscillations. Neuron. 2003;37:563–576. doi: 10.1016/s0896-6273(03)00065-5. [DOI] [PubMed] [Google Scholar]
- Steriade M, Timofeev I, Grenier F. Natural waking and sleep states: a view from inside neocortical neurons. J Neurophysiol. 2001;85:1969–1985. doi: 10.1152/jn.2001.85.5.1969. [DOI] [PubMed] [Google Scholar]
- Sullivan D, Mizuseki K, Sorgi A, Buzsaki G. Comparison of sleep spindles and theta oscillations in the hippocampus. J Neurosci. 2014;34:662–674. doi: 10.1523/JNEUROSCI.0552-13.2014. [DOI] [PMC free article] [PubMed] [Google Scholar]
- Tononi G, Cirelli C. Sleep and the price of plasticity: from synaptic and cellular homeostasis to memory consolidation and integration. Neuron. 2014;81:12–34. doi: 10.1016/j.neuron.2013.12.025. [DOI] [PMC free article] [PubMed] [Google Scholar]
- Toyoizumi T, Kaneko M, Stryker MP, Miller KD. Modeling the dynamic interaction of Hebbian and homeostatic plasticity. Neuron. 2014;84:497–510. doi: 10.1016/j.neuron.2014.09.036. [DOI] [PMC free article] [PubMed] [Google Scholar]
- Turrigiano G. Homeostatic synaptic plasticity: local and global mechanisms for stabilizing neuronal function. Cold Spring Harb Perspect Biol. 2012;4:a005736. doi: 10.1101/cshperspect.a005736. [DOI] [PMC free article] [PubMed] [Google Scholar]
- Turrigiano GG, Leslie KR, Desai NS, Rutherford LC, Nelson SB. Activity-dependent scaling of quantal amplitude in neocortical neurons. Nature. 1998;391:892–896. doi: 10.1038/36103. [DOI] [PubMed] [Google Scholar]
- Turrigiano GG, Nelson SB. Homeostatic plasticity in the developing nervous system. Nat Rev Neurosci. 2004;5:97–107. doi: 10.1038/nrn1327. [DOI] [PubMed] [Google Scholar]
- Vitureira N, Goda Y. Cell biology in neuroscience: the interplay between Hebbian and homeostatic synaptic plasticity. J Cell Biol. 2013;203:175–186. doi: 10.1083/jcb.201306030. [DOI] [PMC free article] [PubMed] [Google Scholar]
- Vyazovskiy VV, Cirelli C, Pfister-Genskow M, Faraguna U, Tononi G. Molecular and electrophysiological evidence for net synaptic potentiation in wake and depression in sleep. Nat Neurosci. 2008;11:200–208. doi: 10.1038/nn2035. [DOI] [PubMed] [Google Scholar]
- Vyazovskiy VV, Olcese U, Lazimy YM, Faraguna U, Esser SK, Williams JC, Cirelli C, Tononi G. Cortical firing and sleep homeostasis. Neuron. 2009;63:865–878. doi: 10.1016/j.neuron.2009.08.024. [DOI] [PMC free article] [PubMed] [Google Scholar]
- Wang G, Grone B, Colas D, Appelbaum L, Mourrain P. Synaptic plasticity in sleep: learning, homeostasis and disease. Trends Neurosci. 2011;34:452–463. doi: 10.1016/j.tins.2011.07.005. [DOI] [PMC free article] [PubMed] [Google Scholar]
- Witting W, Mirmiran M, Bos NP, Swaab DF. Effect of light intensity on diurnal sleep-wake distribution in young and old rats. Brain Res Bull. 1993;30:157–162. doi: 10.1016/0361-9230(93)90053-e. [DOI] [PubMed] [Google Scholar]
- Xie L, Kang H, Xu Q, Chen MJ, Liao Y, Thiyagarajan M, O’Donnell J, Christensen DJ, Nicholson C, Iliff JJ, et al. Sleep drives metabolite clearance from the adult brain. Science. 2013;342:373–377. doi: 10.1126/science.1241224. [DOI] [PMC free article] [PubMed] [Google Scholar]
Associated Data
This section collects any data citations, data availability statements, or supplementary materials included in this article.