Abstract
This paper presents a 3.3 × 3.2mm2 system-on-chip (SoC) fabricated in AMS 0.35µm 2P/4M CMOS for closed-loop regulation of brain dopamine. The SoC uniquely integrates neurochemical sensing, on-the-fly chemometrics, and feedback-controlled electrical stimulation to realize a “neurochemostat” by maintaining brain levels of electrically evoked dopamine between two user-set thresholds. The SoC incorporates a 90µW, custom-designed, digital signal processing (DSP) unit for real-time processing of neurochemical data obtained by 400V/s fast-scan cyclic voltammetry (FSCV) with a carbon-fiber microelectrode (CFM). Specifically, the DSP unit executes a chemometrics algorithm based upon principal component regression (PCR) to resolve in real time electrically evoked brain dopamine levels from pH change and CFM background-current drift, two common interferents encountered using FSCV with a CFM in vivo. Further, the DSP unit directly links the chemically resolved dopamine levels to the activation of the electrical microstimulator in on-off-keying (OOK) fashion. Measured results from benchtop testing, flow injection analysis (FIA), and biological experiments with an anesthetized rat are presented.
Index Terms: Brain-machine-brain interface, chemometrics, closed-loop neuromodulation, digital signal processor, dopamine regulation, interferent differentiation, neurochemical sensing, principal component regression, system-on-chip
I. Introduction
Integrated circuits (ICs) for activity-dependent neuromodulation constitute the core of implantable brain-machine-brain interface (BMBI) technologies that combine neural recording, embedded signal processing, and microstimulation functions in a single device for closed-loop interfacing with the nervous system. These ICs extract and analyze information from the neural activity recorded in one brain region to control microstimulation of another brain region in real time, and offer the prospect of new therapeutic strategies for treating neuropathologies. Currently, these ICs focus on bioelectric signals only [1]–[11], with no such approach extended to the neurochemistry yet. Closed-loop control of electrical stimulation based on neurochemistry permits neuromodulation at the level of a single neuron-type and therefore affords the prospect of finer control of brain function [12]–[14].
Although great strides have been made over the past several years in developing ICs that support neurochemistry [15]–[20], these ICs only permit monitoring of neurochemistry and have no capability to extend such measurements to the realm of high-fidelity, dynamic neurochemical control. One recent example has facilitated such an extension for the first time by combining electrical microstimulation and neurochemical monitoring in a single-chip IC for high-fidelity dopamine temporal pattern generation in vivo [21], [22]. However, this IC still does not have any embedded computational capabilities for chemically resolving dopamine levels, measured by fast-scan cyclic voltammetry (FSCV) with a carbon-fiber microelectrode (CFM), and directly linking them to activation of the electrical stimulator.
FSCV with a CFM is recognized as the preferred choice for real-time monitoring of endogenous neurotransmitters in behaving animals due to its exquisite temporal, spatial, and chemical resolution [23]. Indeed, this measurement modality provided the first monitoring of a behaviorally associated change in neurotransmitter levels with subsecond temporal resolution at a brain-implanted, micron-sized probe in an awake animal [24]. Basic processing of FSCV data to obtain a chemical signature in the form of a voltammogram for identification of the target analyte as well as a temporal profile of its concentration variation has traditionally been performed offline on a home-base computer post-data acquisition. To usher in next-generation, closed-loop devices that combine sensing, computation, and control functions for an autonomous operation, basic FSCV computations need to be performed in real time (i.e., as the recording is taking place) by the device itself to obviate the need for offline data processing [25].
Furthermore, as explained in more detail in Sections II and III, such closed-loop devices should also incorporate advanced processing of FSCV data in real time for differentiating the target analyte from interferents and creating a separate record for each component to ensure that neuromodulation control is performed based on information from the target analyte itself, and not that of interferents.
In this paper, we report a system-on-chip (SoC) that uniquely integrates FSCV-based neurochemical sensing, digital data processing, and feedback-controlled electrical microstimulation, as conceptually illustrated in Fig. 1 [26]. For a proof-of-concept feasibility demonstration, the SoC is designed to realize a “neurochemostat” by maintaining electrically evoked brain dopamine levels between two user-set thresholds via on-off-keying (OOK) control of microstimulation. Our target analyte, dopamine, is implicated in the important brain functions of motivation, cognition, and motor control, and is associated with debilitating neuropathologies of addiction, schizophrenia, and Parkinson’s disease [27].
Fig. 1.
Conceptual illustration of the operation of a “neurochemostat” for regulating electrically evoked brain dopamine levels between two user-set thresholds via on-off-keying (OOK) control of electrical stimulation.
The SoC obviates the need for a home-base computer during the actual experimentation session by performing all basic FSCV data processing in real time, and uniquely executes a chemometrics algorithm based on principal component regression (PCR) to resolve dopamine in complex signals recorded by the CFM and enable interferent-insensitive, closed-loop operation in vivo. This work has the potential to pave the road to new clinical neuromodulation strategies that aim to impose therapeutic neurochemical profiles or maintain optimal neurochemical levels in disease states via real-time activity-dependent neuromodulation.
The paper is organized as follows. Section II describes the fundamentals of dopamine sensing using FSCV with a CFM, and Section III presents the basics of the PCR algorithm for dopamine differentiation from interferents. Section IV presents the SoC system architecture, and Section V discusses the design and architecture of key building blocks within the SoC. Section VI presents our experimental results from benchtop, in vitro, and in vivo measurements. Section VII presents a discussion of this work, and Section VIII draws some conclusions from it.
II. FSCV-Based Dopamine Sensing
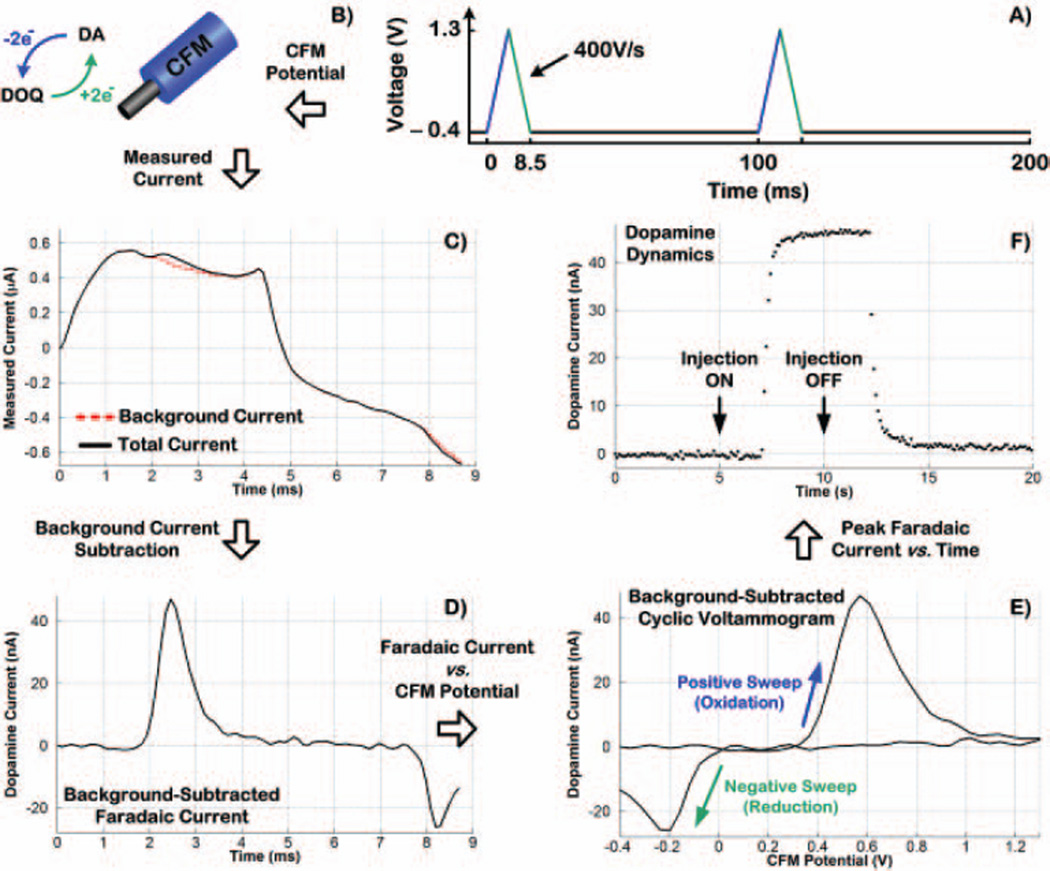
FSCV with a CFM for dopamine sensing is depicted in Fig. 2. As shown in Panel A, the CFM potential is linearly swept every 100ms from −0.4V to 1.3V at 400V/s, resulting in scan duration of 8.5ms. In the positive sweep, dopamine (DA) loses two electrons and oxidizes to dopamine-ortho-quinone (DOQ), which is reduced back to dopamine by gaining two electrons in the negative sweep (see Panel B). The total current from this electrochemical reaction includes both background and faradaic components. Panel C shows a current recording obtained in an in vitro test with a CFM positioned in the inlet of a flow cell reservoir. The dashed red line shows the background current obtained in one FSCV scan before a bolus injection of dopamine into the flowing stream entering the reservoir inlet. The solid black line shows the measured total current (background + faradaic currents) obtained in another FSCV scan after a 5-second bolus injection of dopamine.
Fig. 2.
Fundamentals of fast-scan cyclic voltammetry (FSCV) with a carbon-fiber microelectrode (CFM) for dopamine sensing. These data were collected in vitro by exposing a CFM to a 5-second bolus injection of dopamine
Since the background current is typically stable over a short period of time (i.e., a few seconds), it can be prerecorded just before the bolus injection of dopamine and then subtracted from the total current to reveal the background-subtracted, faradaic current that is proportional to dopamine concentration, as depicted in Panel D. The faradaic current when plotted versus CFM potential creates the background-subtracted cyclic voltammogram, which serves as a chemical signature to identify the analyte as shown by Panel E where the oxidative and reductive peaks at +0.57V and −0.2V, respectively, indicate dopamine. Dynamic information, characterizing the temporal pattern of concentration changes, is obtained by plotting peak current measured at dopamine oxidative potential in each voltammogram versus time in successive FSCV scans. This is shown in Panel F where each data point (indicated by a dot) represents the peak dopamine current determined from each voltammogram collected every 100ms (a total of 200 voltammograms in 20 seconds with 10Hz FSCV). The arrows in Panel F correspond to when dopamine injection in the flow cell was turned ON and OFF (i.e., 5-second bolus).
Hence, in basic processing of FSCV data, the temporal profile of dopamine concentration variation is obtained via a univariate measurement of peak dopamine current at its oxidative potential versus time. However, this simplistic approach cannot resolve individual components of complex signals recorded at a brain-implanted CFM, rendering FSCV-based dopamine measurements susceptible to interferents within complex brain extracellular fluid in vivo [28]. In particular, since the background current of a CFM is typically stable for only a few seconds, longer recording times can result in large background-current drifts that would interfere with selective monitoring of dopamine. As stated in Section I, the SoC solves these problems by running a multivariate chemometrics algorithm based upon PCR [28], [29], as discussed in further detail in the next section.
III. PCR-Based Dopamine Differentiation
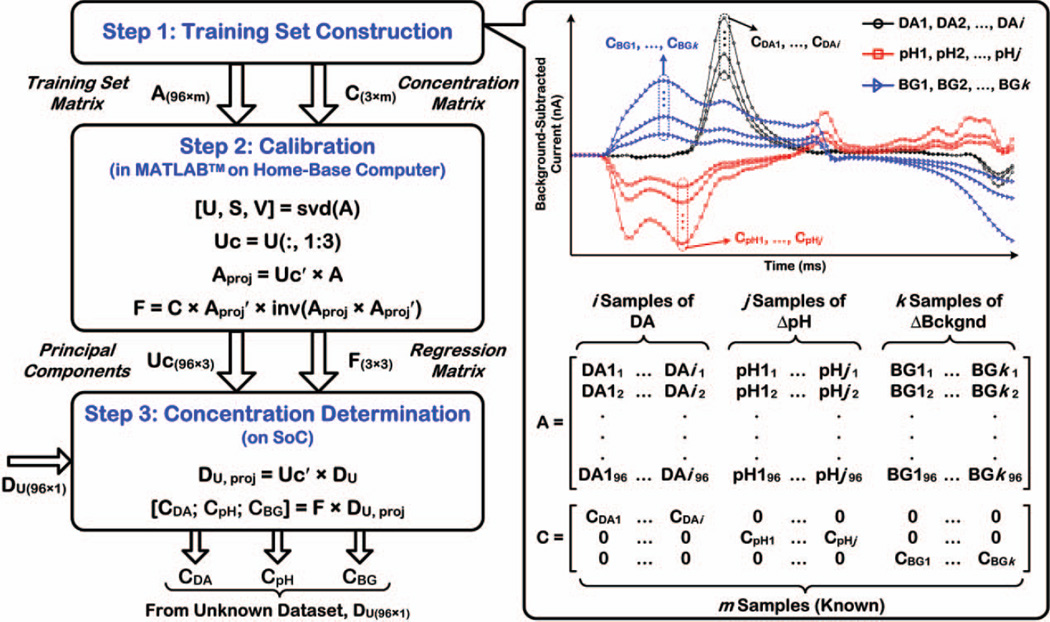
The PCR technique is a combination of principal component analysis (PCA) and least-squares regression [28]. In order to differentiate dopamine from interferents (i.e., determine its concentration in the presence of interferents), the background-subtracted current obtained in each FSCV scan is first projected onto relevant principal components (PCs) using PCA, and the projections along the PCs are then related back to concentration by performing a least-squares regression. PCs can be considered as unit vectors in a coordinate system, whereas the background-subtracted current of each FSCV scan can be thought of as a vector in space that can be described as a linear combination of the unit vectors. Fig. 3 shows various steps involved in the PCR algorithm, namely, training set construction, calibration, and concentration determination. We only considered pH change (ΔpH) and CFM background-current drift (ΔBckgnd) as dopamine interferents in this work, but this method can be extended to include other interferents, if their background-subtracted voltammogram is sufficiently distinct from that of dopamine.
Fig. 3.
Fundamentals of PCR-based chemometrics algorithm for determination of dopamine concentration in the presence of ΔpH and ΔBckgnd as two common interferents encountered in FSCV with a CFM in vivo (see [28] for details).
A. Training Set Construction
In this step, a training set is assembled that comprises a series of background-subtracted currents associated with known samples of dopamine (DA1, …, DAi), ΔpH (pH1, …, pHj), and ΔBckgnd (BG1, …, BGk), as shown in the top right plot of Fig. 3. The currents for each component are obtained in one scan of FSCV with a CFM, as previously described in Section II. Four or five different samples per each component are typically needed in the training set to build an accurate model, with the samples fully spanning the expected range of each component in the actual experiment to ensure that unknown samples fall within the calibration range [28].
In Fig. 3, the training set matrix is denoted as A(n×m) in which m is the total number of known samples in the training set, while n is the number of data points in each sample (96 in this work, see Section V.C. for more details.) A concentration matrix, C(3×m), is also assembled in which each row contains the concentration of each of the m known samples of the training set expressed as the peak absolute current in their voltammograms (see top right plot).
B. Calibration
In this step that is performed offline using MATLAB™ on a home-base computer (see [28] for details), PCs are first calculated for the data spectrum in the training set matrix, A(96×m), using singular value decomposition (SVD):
| (1) |
The unitary matrix, U, contains the PCs in decreasing order. The first three columns of this matrix are selected, because these PCs describe the majority of the variance in the data spectrum, whereas other columns contain PCs that are primarily related to noise and are thus discarded. Matrix Uc(96×3) is then constructed to contain all relevant PCs:
| (2) |
Next, the projections of the data spectrum in the training set matrix, A, along the relevant PCs are calculated:
| (3) |
Finally, a regression matrix, F(3×3), which relates the projections along the PCs to concentrations is obtained:
| (4) |
C Concentration Determination of Unknown Samples
In this step that takes place during the actual experiment, the background-subtracted current obtained in each FSCV scan serves as an unknown dataset matrix, DU(96×1). To differentiate dopamine from its interferents, the projections of the data spectrum in matrix DU along the relevant PCs of the training set are first calculated using (5), and then related to concentrations using the regression matrix F according to (6).
| (5) |
| (6) |
In practice, for hardware implementation of the PCR algorithm, an initial round of experimentation is performed for training set construction to obtain matrices A and C, followed by MATLAB™ computations on a home-base computer to obtain matrices Uc and F that are subsequently programmed into the SoC. The actual experiment will then take place during which computations in (5) and (6) are performed in real time by the SoC in each FSCV scan.
IV. System Architecture
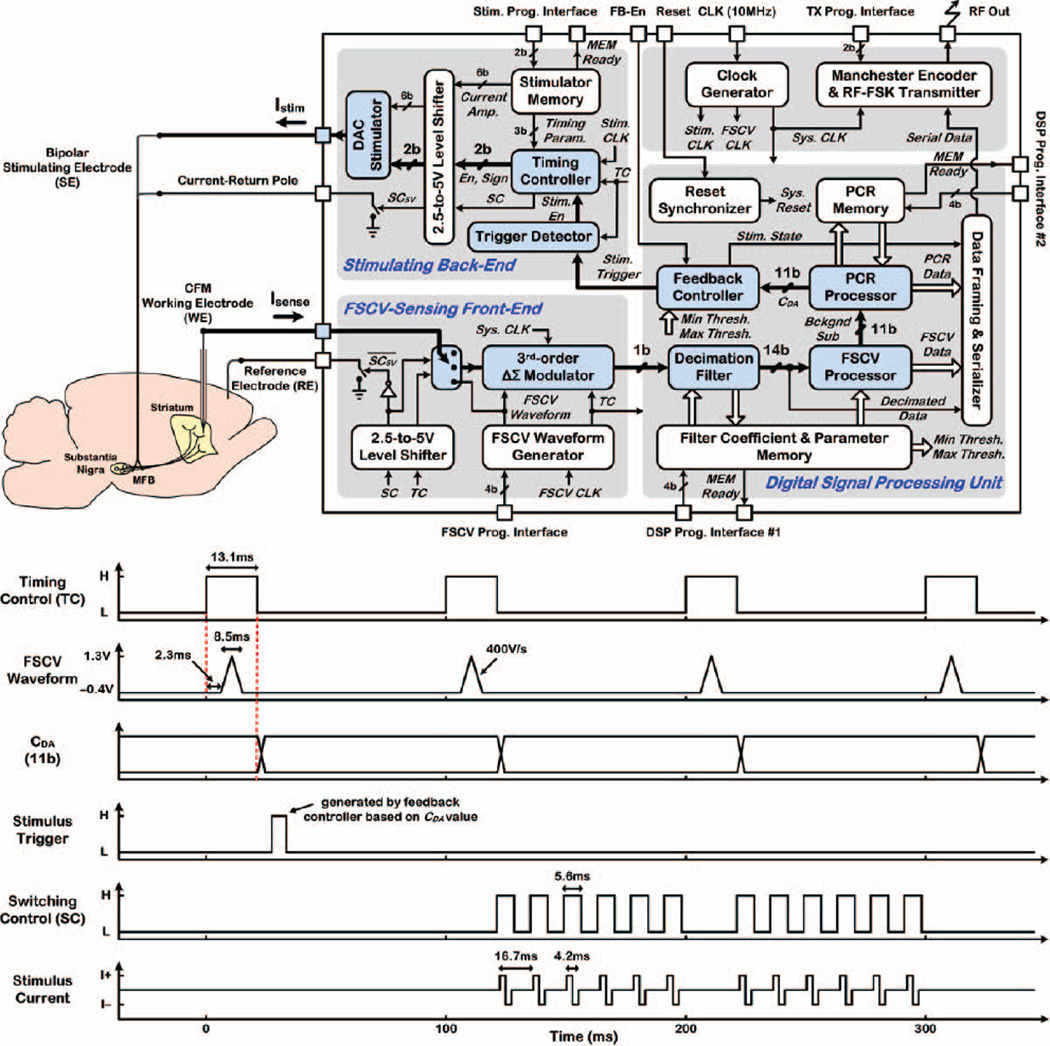
Fig. 4 shows the architecture and timing operation of a proof-of-concept, closed-loop SoC interfaced with brain-implanted electrodes, incorporating an FSCV-sensing front-end, digital signal processing (DSP) unit, stimulating back-end, clock generator from 10MHz external reference, and wireless frequency-shift-keyed (FSK) transmitter (TX) at ~433MHz. The sensing front-end applies the FSCV scan to the CFM working electrode (WE) and converts the total current measured in each FSCV scan to an oversampled digital output bit-stream using a 3rd-order, delta-sigma modulator (ΔΣM) with 1b quantization. The DSP unit incorporates a decimation filter to remove the out-of-band noise and convert the low-resolution (1b), oversampled, digital data at the ΔΣM output to high-resolution (14b), decimated data.
Fig. 4.
Architecture of the closed-loop SoC in which the main building blocks in the signal path for closed-loop operation (thicker arrows) are shown in color. The SoC timing operation for dopamine level-based triggering of electrical stimulation is also shown
The decimator is followed by two embedded processors. The FSCV processor computes the background-subtracted current (Bckgnd Sub) component of the total measured current in each FSCV scan, as described in Section II. The PCR processor next runs the chemometrics algorithm to compute the individual contributions of dopamine (CDA), ΔpH (CpH), and ΔBckgnd (CBG) to Bckgnd Sub data in each FSCV scan. Finally, the feedback controller manages the stimulating back-end operation in OOK fashion by comparing CDA to two user-set threshold levels and generating a trigger signal to electrically evoke dopamine release, if necessary, by delivering 12 or 24 biphasic current pulses (≤+320µA, 60Hz, 2.1ms/phase) to the stimulating electrode (SE).
The SoC timing operation, as also illustrated in Fig. 4, is managed by the timing control (TC) signal generated in the sensing front-end. When TC goes high, the ΔΣM is activated, the FSCV scan is applied to the CFM WE after a 2.3ms delay, and a total current is recorded for ~13.1ms, when TC is high. The DSP unit is also concurrently enabled for real-time FSCV data processing and determination of dopamine concentration. CDA is computed just after the falling edge of the TC signal, and remains valid until it is updated in the next FSCV scan.
The SoC affords combined stimulation and artifact-free dopamine recording due to a fully integrated electrode-switching scheme managed by an on-chip switching control (SC) signal, and a synchronized timing operation that avoids temporal overlap of sensing and stimulation by equally distributing the 12 (24) biphasic current pulses in between 2 (4) successive FSCV scans [21]. The SoC also has an embedded memory to retain decimator coefficients, FSCV processor parameters, and feedback-controller thresholds, and a PCR memory to retain matrices Uc and F from the calibration step. The memories are programmed only once prior to the actual test via two wired interfaces. All data are frame-marked and serialized by the DSP unit and wirelessly transmitted out by the FSK TX.
V. Integrated Circuit Architecture
A. FSCV-Sensing Front-End
The design of the FSCV-sensing front-end improves upon that in our previous work [21], with an enhanced layout and fully integrated electrode-switching scheme with 5V transistors that obviates the need for external switches to handle stimulus artifacts. As seen in Fig. 5, the sensing front-end incorporates a duty-cycled, 3rd-order, continuous-time ΔSM with 1b quantization formed by a cascade of three 1st-order integrators in the feed-forward signal path and clocked at 625kHz for an oversampling ratio (OSR) of 64. It achieves a measured input noise current of 67.4pArms (dc–4.88kHz) within an input current range of +900nA, while dissipating 9.5µW at 2.5V during 10Hz FSCV. The measured peak SNR and SNDR in 4.88kHz bandwidth are 77.8dB (at +900nA) and 72.1dB (at ±500nA), respectively, improving upon our previous design in [21] by 1.5dB and 1.4dB, respectively.
Fig. 5.
Circuit architecture of the FSCV-sensing front-end and schematic block diagram of the decimation filter in the DSP unit.
B. Decimation Filter
Fig. 5 also depicts the schematic block diagram of the decimation filter of the DSP unit realized using three lowpass filter stages and designed to decimate the ΔSM output by a factor of 64. The decimation filter additionally generates the decimated sampling clock, CLK64, for the DSP unit. Filters that operate at a higher (lower) sampling rate are designed to have wider (narrower) transition bands; thus the filter order increases from top to bottom. This design strategy, which was also previously verified on a field-programmable gate array (FPGA) [25], reduces the amount of computation at higher sampling rates to save power.
A multiplier-free, 4th-order, cascaded integrator-comb (CIC) filter is used as the first stage to decimate the 3rd-order ΔSM output by a factor of 16 and adequately attenuate the noise that would otherwise alias into desired signal band [30]. Following the CIC filter, a cascade of 18th-order, half-band (HB) and 50th-order finite impulse response (FIR) filter stages is used to decimate the data further by a factor of 4 to a rate of ~9.77kHz, targeting a transition band centered at 3kHz for the decimation filter to limit the bandwidth and further reduce noise. An HB filter is a subset of FIR filter family in which all the odd coefficients are zero except for the center one, resulting in fewer taps and computations to save power. Each FIR filter uses only one multiplier to also save silicon area.
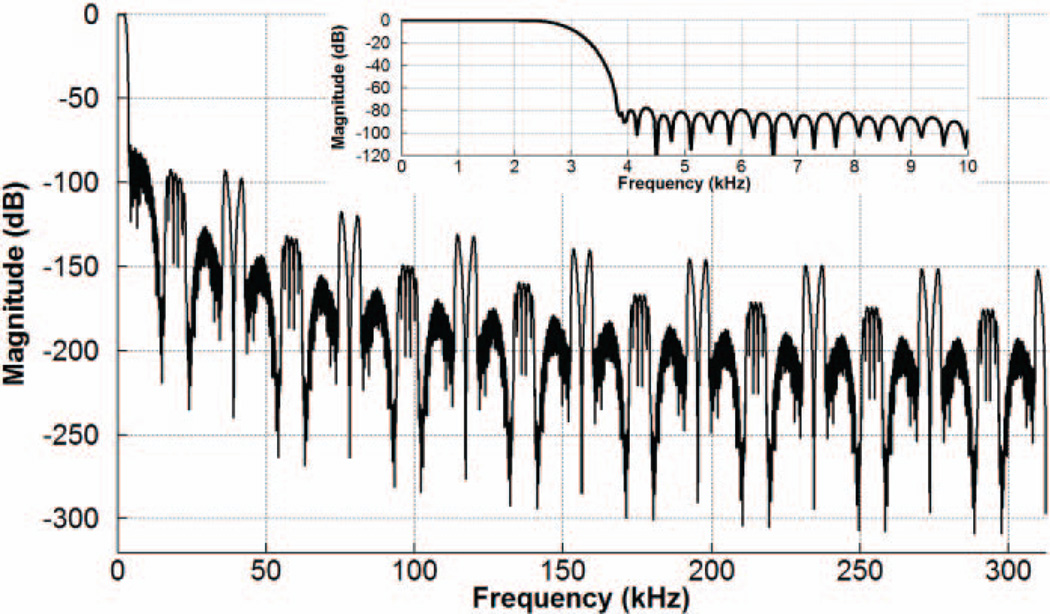
Since the ΔΣM features a dynamic range (DR) of >80dB with an input current range of ±1.2µA (resolution of ~13b) [21], the fixed-point arithmetic precision in the two FIR filters is increased via 20b word-length in the internal nodes and 18b coefficients to ensure that the sensing front-end performance is not degraded by the decimator. Finally, the output word-length is converted to 14b, including an extra bit of sign information (LSB of ±146.5pA). Fig. 6 depicts the simulated frequency response of the decimation filter and its passband.
Fig. 6.
Simulated frequency response of the decimation filter in the DSP unit.
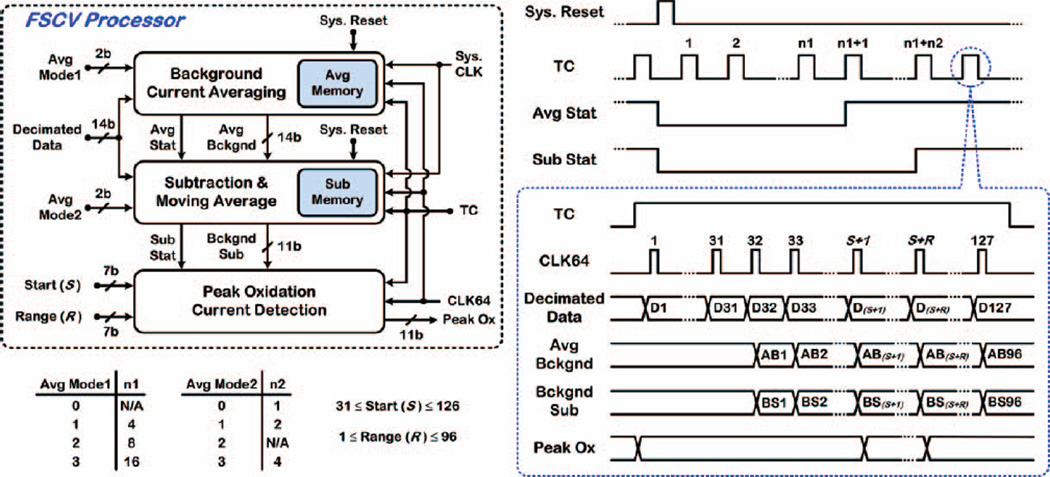
C. FSCV Processor
Fig. 7 shows the schematic block diagram and operation timing of the FSCV processor in the DSP unit, incorporating functional blocks for background-current averaging, background-current subtraction and moving average, and peak oxidation current (Peak Ox) detection. The TC signal is high for ~13.1ms, during which 127 decimated data points are generated at the rate of ~9.77kHz. The first 31 data points are discarded due to decimation filter delay (~2ms) and the 2.3ms delay from the rising edge of the TC signal to the start of the FSCV scan (see Fig. 4.) The rising edge of each CLK64 cycle indicates when each decimated data point is ready.
Fig. 7.
Schematic block diagram and operation timing of the FSCV processor in the DSP unit.
The background current-averaging block prerecords and stores a stable, averaged background current (Avg Bckgnd) for the purpose of subsequent subtraction. Upon receiving a Reset signal, Avg Stat goes low and, depending upon user-set Avg Mode1 parameter, background currents of n1 consecutive FSCV scans (n1 = 4, 8 or 16) are added and stored in an internal memory of 96 × 18b. Next, Avg Stat goes high in the subsequent FSCV scan, and the averaged background current associated with each timestamp, AB1~96, is generated by dividing the memory content for that timestamp by n1. Avg Stat remains high and the memory content does not change until the next Reset signal arrives, indicating that the user needs to update the averaged background current.
When Avg Stat goes high, the background-current subtraction/moving average block is also activated. Upon receiving each decimated data point D32~127, the averaged background current associated with the corresponding timestamp, AB1~96, is subtracted from it, and the resulting data point, BS1~96, is converted to 11b to obtain the background-subtracted current, Bckgnd Sub, prior to a moving average for smoothing the response.
Next, depending upon user-set Avg Mode2 parameter, each Bckgnd Sub data point BS1~96 of the present FSCV scan is averaged with those of the 0 (i.e., no averaging), 1 or 3 previous scans (i.e., n2-scan moving average with n2 = 1, 2 or 4). Three internal memories of 96 × 11b store up to three previous background-subtracted currents for this purpose. The computation of each BS1~96 data point starts at the rising edge of each CLK64 cycle, and the data point becomes stable by the time the falling edge arrives.
Sub Stat goes high at the start of the FSCV scan number (n1 + n2) and remains high until the next Reset signal from the user. With Sub Stat high, the peak oxidation current detection block is enabled to find Peak Ox in each FSCV scan. The start and range of timestamps in Bckgnd Sub data to search for Peak Ox in the vicinity of dopamine oxidative potential is defined by the user-set Start (S) and Range (R) parameters. Peak Ox is determined among BS(s+1)~(s+r) by the time the falling edge of TC arrives, and remains valid until the next FSCV scan.
D. PCR Processor
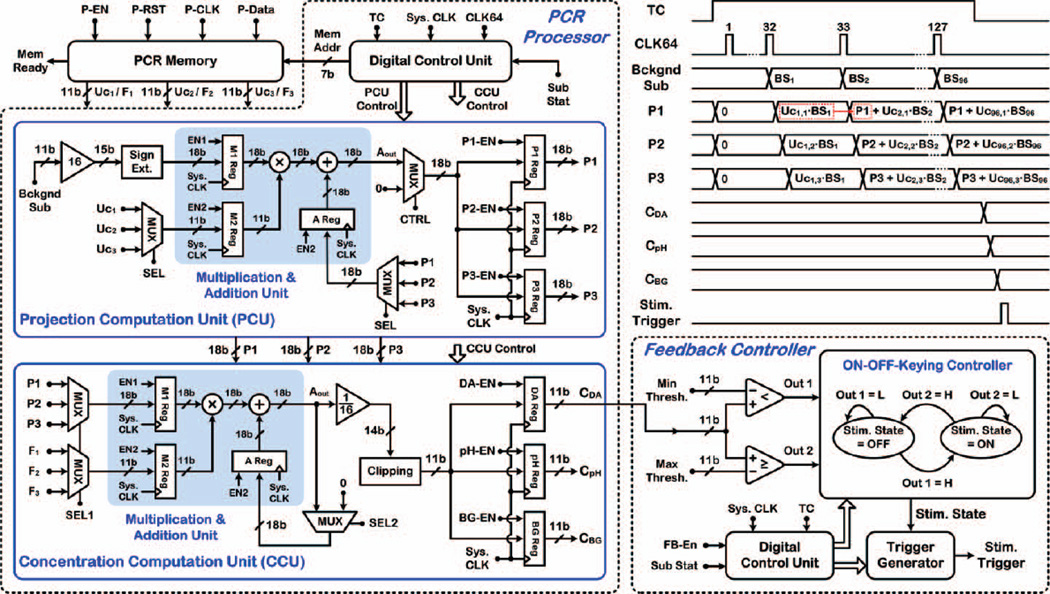
Fig. 8 depicts the schematic block diagram and operation timing of the PCR processor in the DSP unit interfaced with the PCR memory, incorporating a digital controller as well as projection and concentration computation units (PCU/CCU) for hardware realization of (5) and (6), respectively. With Sub Stat high, the PCR processor is enabled and first computes the projections (P1,2,3) of Bckgnd Sub along the relevant PCs of the preassembled training set and then relates P1, P2, and P3 to CDA, CpH, and CBG, respectively.
Fig. 8.
Schematic block diagram and operation timing of the PCR processor and feedback controller in the DSP unit.
The PCR memory (99 × 33b) is implemented using D flip-flops and retains matrices Uc and F from the calibration step. The first 96 rows of the PCR memory are devoted to Uc(96×3), whereas the last three rows are dedicated to F(3×3). Given that each element in matrices Uc and F is quantized with 11b, the three elements in each row of the PCR memory are combined together to form 33b data. The PCR memory is serially programmed with P-Data through an external interface (P-EN, P-RST, P-CLK), and the Mem Ready signal goes high upon successful programming. A 99:1 multiplexer controlled by the 7b Mem Addr signal from the digital controller properly selects a row of matrices Uc or F for projection or concentration computations, respectively, at each timestamp.
Fig. 8 also shows the architecture of the PCU and CCU, which share a multiplication/addition unit with three embedded registers (M1, M2, and A) to save silicon area. When TC goes high at the start of an FSCV scan, P1,2,3 registers are reset to zero to clear them for projection computations in that same FSCV scan. Based on system simulations in MATLAB™, to increase the arithmetic precision of fixed-point computations at the internal nodes, the 11b Bckgnd Sub data points, BS1~96, are converted to 15b by adding four LSBs. Next, the 15b data points are converted to 18b by 3b sign extension to avoid overflow at internal nodes before being stored in register M1.
Upon receiving Bckgnd Sub data points, BS1~96, at each timestamp, the appropriate 33b data representing a row of matrix Uc in the PCR memory are selected, divided into three 11b subsections, Uc1,2,3, and sequentially stored in register M2. The multiplication/addition unit multiplies the content of register M1 (18b BS1~96) by that of register M2 (11b Uc12,3) and adds the result to that of register A (18b P1,2,3 from the previous timestamp) to generate Aout. The contents of the three output registers are then updated with the new Aout value. This results in three multiplications and additions in each timestamp and a total of 288 (96 × 3) multiplications and additions in each FSCV scan. As illustrated by the timing diagram in Fig. 8, the projections (P 1,2,3) of Bckgnd Sub along the relevant PCs of the training set are computed in each FSCV scan by the time the falling edge of TC arrives.
The concentration computation phase starts when TC goes low. The three projections, P1,2,3, obtained by the PCU are sequentially selected and stored in register M1. To compute CDA, the 33b data representing the first row of matrix F (i.e., row #97 in the PCR memory) are selected, divided into three 11b subsections, F1,2,3, and sequentially stored in register M2. The multiplication/addition unit multiplies the content of register M1 by that of register M2 and adds the result to the content of register A to generate Aout. After three multiplications and additions, the value of Aout is divided by a factor of 16 and rounded to 14b data, which is then converted back to 11b data by clipping the first three MSBs. The content of the dopamine output register is then updated with the new 11b data. To compute CpH and CBG, this procedure is repeated, while selecting the second and third rows of matrix F, respectively. The values of CDA, CpH, and CBG remain unchanged until the next FSCV scan.
E. Feedback Controller
Fig. 8 also depicts the schematic block diagram of the feedback controller in the DSP unit that manages the operation of the stimulating back-end in OOK fashion. Using a digital control unit, two digital comparators, and a trigger generator, this block compares the value of CDA updated in each FSCV scan with two user-set minimum and maximum thresholds stored in the SoC embedded memory.
With feedback control enabled (i.e., both the FB-EN and Sub Stat high), this block determines the new state of stimulator (Stim. State) based on its previous state and the two outputs of the digital comparators. Specifically, with Stim. State OFF, if CDA becomes less than the minimum threshold, the feedback controller changes Stim. State to ON to generate a stimulus trigger signal for activating the back-end stimulator. Similarly, with Stim. State ON, if CDA exceeds the maximum threshold, the feedback controller changes Stim. State to OFF to shut down the back-end stimulator.
VI. Measurement Results
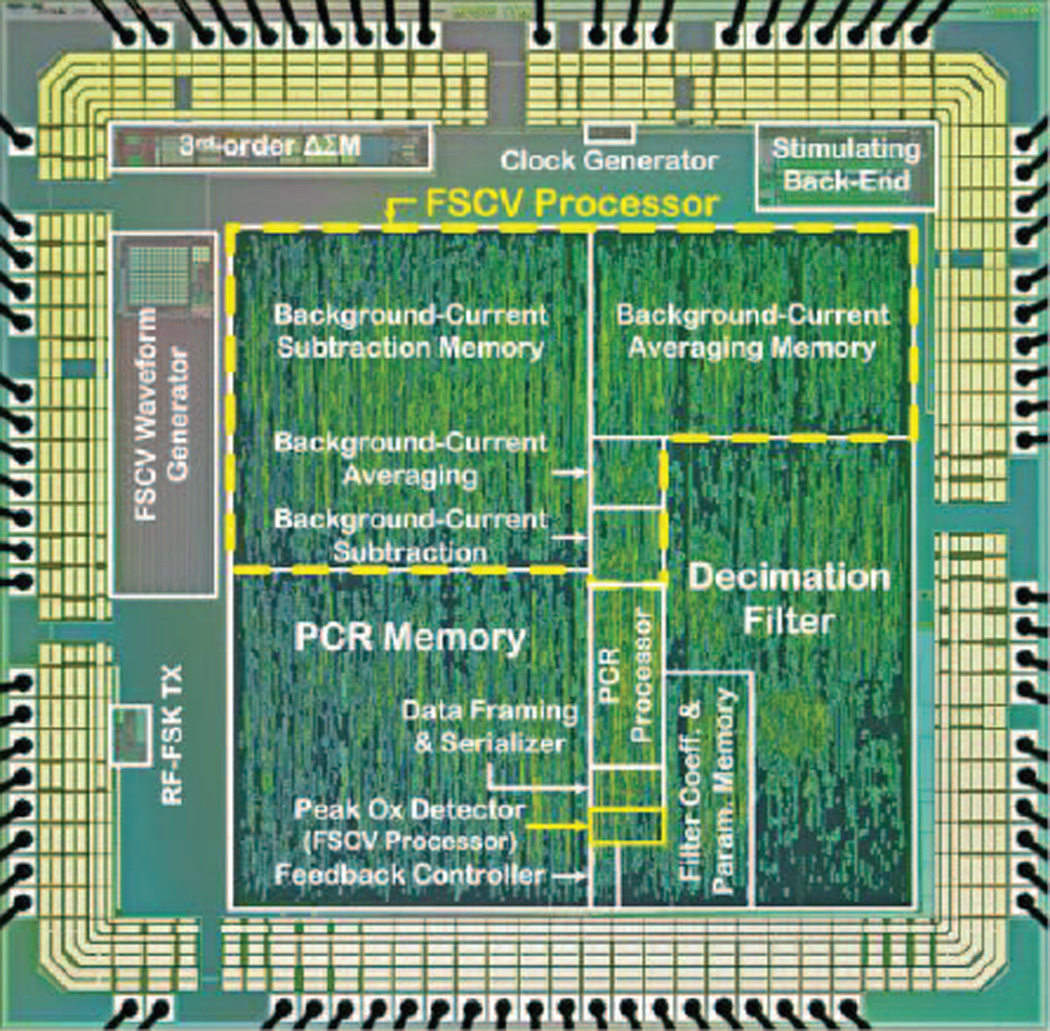
A prototype chip was fabricated in AMS 0.35µm 2P/4M CMOS, measuring 3.3 × 3.2mm2 including the bonding pads. Fig. 9 shows a micrograph of the fabricated chip. This section presents the measured results from benchtop characterization, in vitro testing with flow injection analysis (FIA), and biological experimentation with an anesthetized rat. For all in vitro and in vivo experiments, Avg Mode1 and Avg Mode2 parameters were both set to three in the DSP unit (see Fig. 7.)
Fig. 9.
SoC die micrograph fabricated in AMS 0.35µm 2P/4M CMOS.
A. Benchtop Characterization
Fig. 10(a) and (b) show the measured frequency spectrum at the output of ΔΣM and “ΔΣM + decimator”, respectively, for a 500Hz, ±900nA sinusoidal input current. Both structures exhibited the same SNDR of 67.6dB in 4.88kHz bandwidth, which was limited by the 2nd- and 3rd-order harmonics. The decimation filter degraded the SNR of the ΔΣM by only 0.8dB from 77.8dB to 77dB. Fig. 10(c) depicts the measured SNR and SNDR of both structures as a function of the input current amplitude normalized to Iref (1.2µA), with the input frequency at 500Hz. For a normalized input signal less than −10dB, the SNR and SNDR of the “ΔΣM + decimator” were ~1dB higher than those of the ΔΣM, given the lower 3dB bandwidth of the decimation filter (~2.7kHz) that further reduced the noise. As the normalized input signal amplitude increased beyond −10dB, the quantization noise of the decimation filter also increased and slightly degraded the SNR of the ΔΣM (by 0.8dB at the peak). The DR of the ΔΣM was measured to be 82dB (input noise current of 67.4pArms, SNR = 1). Table I provides a summary of the SoC measured performance, and Table II compares it with that in recent published works.
Fig. 10.
Measured frequency spectrum at the output of (a) ΔΣM and (b) “ΔΣM + decimator” for a 500Hz, ±900nA sinusoidal input current. (c) Measured SNR and SNDR as a function of the normalized input current amplitude (Iref = 1.2µA).
Table I.
Summary of SoC Specifications and Measured Performance
| FSCV Sensing Front-End | Digital Signal Processing Unit | ||||||
| Nominal Operation | 400V/s, 10Hz, −0.4 – 1.3V |
Decimation Filter |
Decimation Factor / Resolution | 64x / 14b | |||
| Input Noise Current (dc – 4.88kHz) | 67.4pArms in ±900nA | Input / Output Sampling Rate | 625kHz / 9.77kHz | ||||
| Peak SNR / SNDR | 77.8dB / 72.1dB | Passband Bandwidth (−3dB) / Ripple | 2.7kHz / < 0.01dB | ||||
| Power (@ 2.5V) | 9.5µW (10Hz FSCV) | Stopband Frequency / Attenuation | >3.8kHz / > 78dB | ||||
|
Waveform Generator |
Sweep Rate / Scan Frequency | 300, 400V/s / 5, 10Hz | Peak SNR / SNDR | 77dB / 72.3dB | |||
| Power (@ 2.5V) | 28µW (400V/s, 10Hz FSCV) |
FSCV Processor |
Background Current Averaging |
# of Averages | 4, 8, 16 | ||
| Stimulating Back-End | Memory Size | 96 × 18b | |||||
| Current Waveform / Pulsewidth | Symmetric biphasic / 2.1ms per phase | Background Current Subtraction |
# of Averages | 1, 2, 4 | |||
| Output Current / Resolution | 5 – 320µA / 6b | Memory Size | 3 × 96 × 11b | ||||
| Number of Current Pulses per Stimulus Trigger |
12, 24 (@ 60Hz stimulation) 4, 8 (@ 20Hz stimulation) |
Number of Principal Components in PCR Processor | 3 | ||||
| PCR Memory Size | 99 × 33b | ||||||
| Compliance Voltage (Iout = 320µA) |
Anodic 4.63V (of 5V) |
Cathodic 4.74V (of 5V) |
Feedback Control Scheme | OOK | |||
| Power (@ 2.5V) | 90µW | ||||||
|
Power Consumption Iout = 100µ A (60Hz stimulation) Idle Mode |
Digital (2.5V) 0.1µW <25nW |
Analog (5V) 67.4µW < 50nW |
Other Functions | ||||
| Clock Gen. from 10MHz Ext. Reference | 20.4µW @2.5V (simulated) | ||||||
| Wireless FSK TX @ ~433MHz | 410µ W @ 2.5V | ||||||
| Total Power Consumption for Closed-Loop Operation (w/ ±10 0µA, 60Hz stimulation and excluding FSK TX) = 215.4µW | |||||||
Table II.
Comparison of SoC Functionality and Measured Performance
| This Work | [21] – JSSC’14 | [15] – TBCAS’13 | [16] – VLSI’13 | |
|---|---|---|---|---|
| SoC Functionality | Recording (FSCV) Digital Signal Processing Microstimulation |
Recording (FSCV) Microstimulation |
Recording (CA*, CV** Impedance Spectroscopy) |
Recording (CA, CV, Field Potential) |
| Closed-Loop Operation | Yes | No | No | No |
| DSP Functionality | Yes | No | No | No |
| Sweep Rate | 400V/s (nominal) | 400V/s (nominal) | 1V/s (maximum) | - |
| Conversion Rate | 9.77kHz | 10kHz | 1kHz | 20kHz |
| Input Noise Current | 67.4pArms in ±900nA (4.88kHz BW) |
78pArms in ±950nA (5kHz BW) |
38pArms*** in ±175nA (50Hz BW) |
38pArms**** in ±50nA (10kHz BW) |
| Sensing Power Consumption / Ch. | 9.5µW @ 2.5V | 9.3µW @ 2.5V | 188µW @ 3.3V | 12.1µW @ 1.8V |
| Technology | 0.35µm CMOS | 0.35µm CMOS | 0.35µm CMOS | 0.18µm CMOS |
| Experimental Paradigm | In Vivo | In Vivo | In Vitro |
In Vitro (CV) In Vivo (Field Potential) |
constant-potential amperometry
cyclic voltammetry
estimated based on reported SNR
per neurochemical sensing channel
Fig. 11 shows the breakdown of the silicon area and power consumption for the SoC and its DSP unit. The SoC core area, excluding I/O pads, was 2.62 × 2.52mm2, of which 75% was occupied by the DSP unit. The DSP unit, which was implemented using Verilog HDL, occupied 2.25 × 2.21mm2 of area, of which 72% was occupied by its embedded memories implemented with D flip-flops. Memory implementation using static random-access memory (SRAM) cells would decrease the required area for the DSP unit.
Fig. 11.
Breakdown of silicon area (excluding I/O pads) and power consumption (excluding FSK TX) for the SoC and its DSP unit.
The SoC power breakdown, excluding the wireless FSK TX, was derived with the assumption that the stimulating backend continuously delivered biphasic current pulses at ±100µA, 60Hz, 2.1ms/phase.
The total power consumption of the SoC in closed-loop operation was measured to be ~215µW, of which 42% was dissipated in the DSP unit. In order to breakdown the power consumption of the DSP unit, it was simulated in Cadence™ environment using the NCSim tool and prerecorded data from the ΔSM output obtained during an in vitro experiment. The switching activity of the DSP unit was then fed into the Encounter Digital Implementation (EDI) tool to calculate the power consumption of each building block. The power consumption of the DSP unit was estimated by the EDI tool to be 97.8µW at 2.7V using the typical corner model. This was also in good agreement with the measured power of 90 µW at 2.5V. Based on the power analysis obtained by the EDI tool, 70% of the DSP unit power was dissipated in the clock network of its individual building blocks. The leakage power was estimated to be ~20nW, and the decimation filter consumed 60% of the overall power of the DSP unit.
B. Flow Injection Analysis
The objective in this experiment was to determine dopamine concentration using FIA in the presence of ΔpH as an interferent in vitro. The FSCV-sensing front-end was interfaced with a CFM WE positioned in the inlet of a flow cell reservoir, and an Ag/AgCl reference electrode (RE) was placed at the bottom of the buffer-filled reservoir. All measurements were collected in buffer containing 150mM NaCl and 15mM TRIS (pH = 7.4).
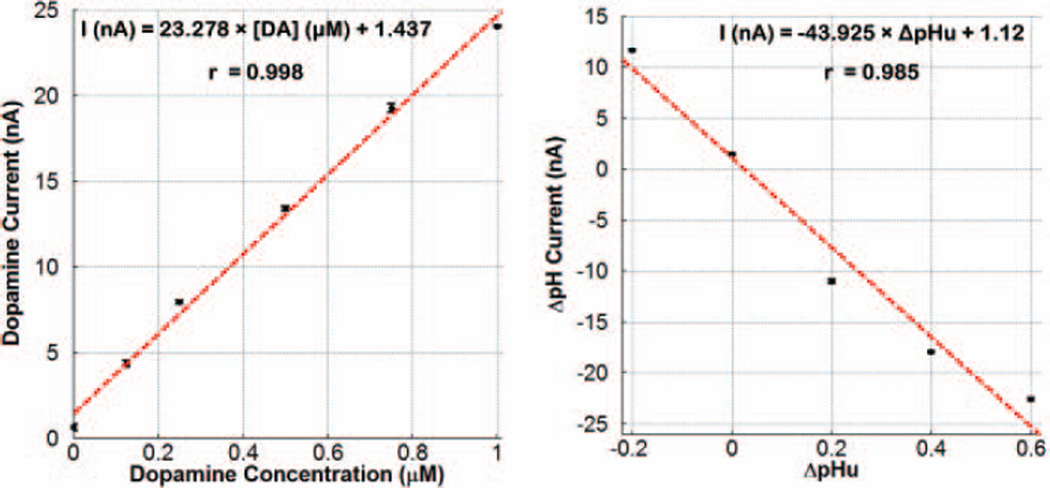
To assemble a training set and construct matrices A and C, dopamine concentrations of 125nM, 250nM, 500nM, 750nM, and 1µM, as well as pH-unit changes (ΔpHu) of −0.2, +0.2, +0.4, and +0.6 were separately applied as 2-second bolus injections to the flowing stream entering the reservoir inlet via a loop injector driven by a pneumatic actuator. Fig. 12 depicts the measured calibration curves for dopamine and ΔpH in which the data are the mean ± standard error of the mean (SEM) for three repetitions at each dopamine concentration and ΔpHu value (as well as three repetitions of a buffer-only injection, representing dopamine concentration or ΔpHu value of zero). The red dashed line is the best-fit line determined by linear regression, and r is the correlation coefficient. As can be seen, a highly linear response was achieved in both cases, with measured sensitivity of ~ 23.3nA/µM and −43.9nA/ΔpHu for dopamine and ΔpH, respectively.
Fig. 12.
Calibration curves of dopamine and ΔpH measured wirelessly by FIA with the ΔΣM input interfaced to a CFM WE, demonstrating measured sensitivity of 23.3nA/µM and −43.9nA/ΔpHu, respectively.
The training set was assembled comprising the background-subtracted currents associated with each of the five dopamine and four ΔpH samples, and subsequently used to construct matrices A and C. The calibration step was next performed offline in MATLAB™ to obtain matrices Uc and F that were then uploaded to the PCR memory of the SoC.
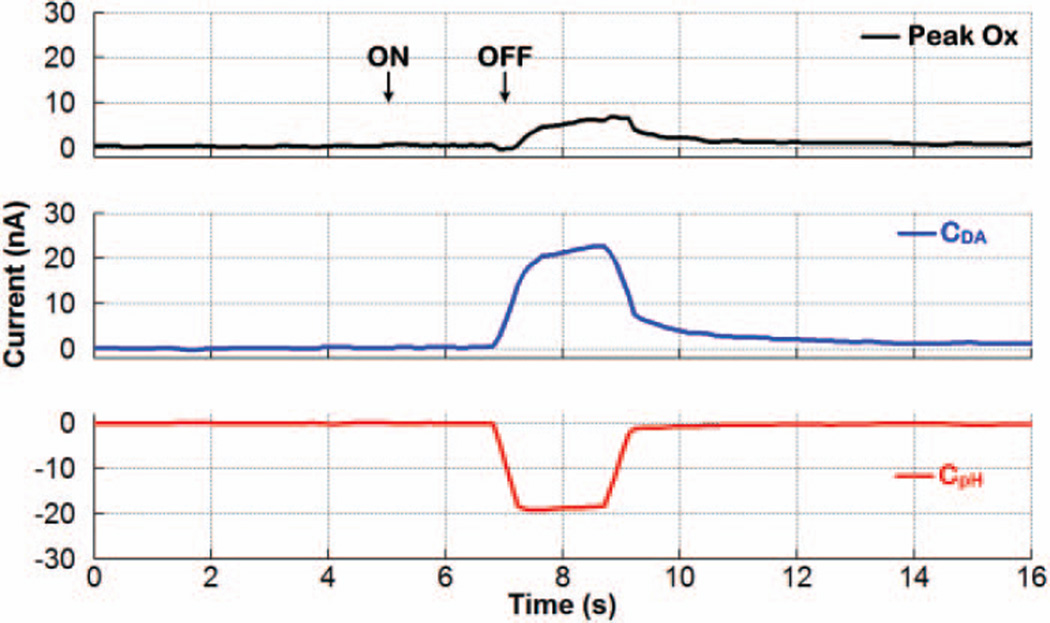
Next, a dopamine concentration of 750nM and ΔpHu of +0.4 were applied together as a 2-second bolus injection of a mixture solution into the flow cell. Fig. 13 shows the dynamic plot obtained in real time at the output of the FSCV and PCR processors of the SoC during 16 seconds of 400V/s, 10Hz FSCV. The rise and fall time instances correspond to when bolus injection into the flow cell was turned ON and OFF, respectively. The time offset was due to an inherent lag with FIA, as the analyte was injected distal to its measurement. As can be seen, the FSCV processor output, Peak Ox, underestimated the dopamine current to be <10nA, because the basic ΔpH elicited current at the oxidative potential of dopamine in the opposite direction as dopamine current. However, the PCR processor was fully capable of differentiating between dopamine and ΔpH contributions, determining the dopamine and ΔpH currents to be nearly 20nA and −20nA, respectively, which were also in agreement with the two calibration plots in Fig. 12.
Fig. 13.
Differentiation of dopamine from ΔpH using the chemometrics function of the SoC. A dopamine concentration of 750nM and ApHu of +0.4 were applied as a 2-second bolus injection of a mixture solution.
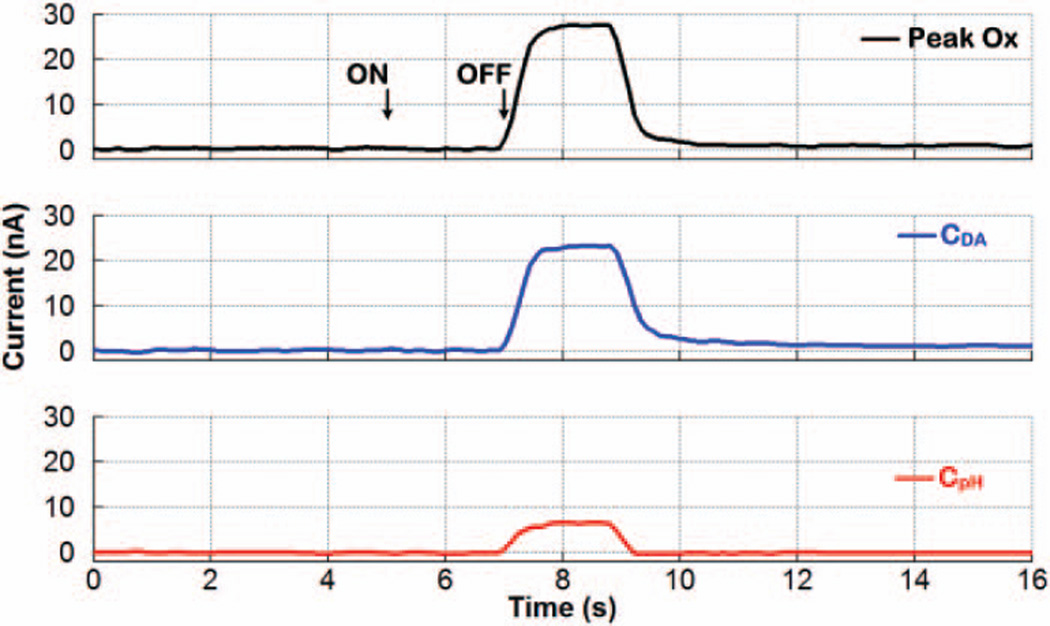
Fig. 14 depicts similar results from another experiment using a mixed bolus injection of dopamine at 750nM and ΔpHu of −0.2. This time, the FSCV processor overestimated the dopamine current, because the acidic ΔpH elicited current at the dopamine oxidative potential in the same direction as dopamine current. Nonetheless, the PCR processor was once again capable of teasing out the dopamine contribution from Peak Ox in the presence of ΔpH as an interferent.
Fig. 14.
Differentiation of dopamine from ΔpH using the chemometrics function of the SoC. A dopamine concentration of 750nM and ΔpHu of −0.2 were applied as a 2-second bolus injection of a mixture solution.
C. Biological Experimentation
Biological tests were also performed using a urethane-anesthetized, adult, male Sprague-Dawley rat in accordance with guidelines approved by the Institutional Animal Care and Use Committee at Illinois State University. A twisted, bipolar SE was implanted in the medial forebrain bundle (MFB), and a CFM WE was placed in the dorsal striatum of the forebrain. The electrodes position was optimized to sense dopamine released from terminals in the dorsal striatum in response to electrical activation of dopamine axons traversing the MFB.
The CFM was externally interfaced with the FSCV-sensing front-end, and FSCV measurements were conducted at a sweep rate of 400V/s and scan frequency of 10Hz. To collect known samples of dopamine and ΔpH for constructing the training set in vivo, trains of stimulus pulses with a varying number of pulses (12, 24, 48, 72, 96) at a fixed stimulus intensity and frequency (±300µA, 60Hz) were applied to the MFB. The measured voltammograms were subsequently analyzed offline to select 5 dopamine and 5 ΔpH samples (i.e., background-subtracted currents) for the training set. To collect samples of ΔBckgnd, an averaged background current of the brain-implanted CFM was initially determined, and the background-subtracted current was then monitored for a period of 10 minutes without updating the initial background current value. As the background-subtracted current started to increase, one sample was selected every few minutes to collect a total of 5 ΔBckgnd samples for the training set.
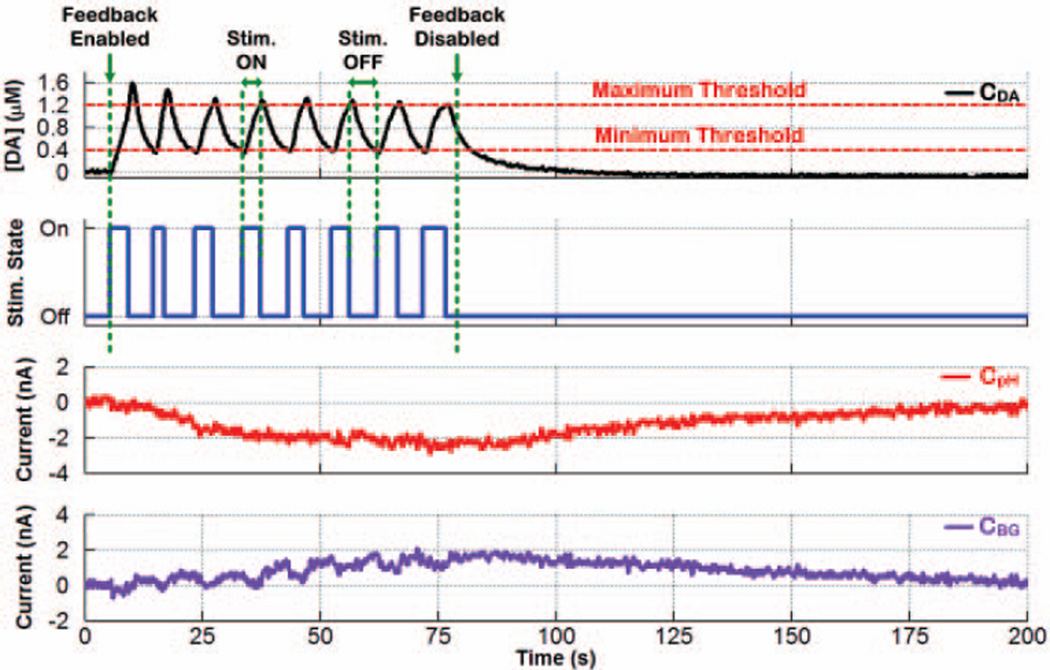
Fig. 15 shows closed-loop regulation of electrically evoked dopamine levels in the dorsal striatum of an anesthetized rat between the two user-set thresholds of 0.4µM and 1.2µM. As can be seen, the stimulating back-end turned ON and OFF whenever dopamine levels reached the minimum and maximum thresholds, respectively. With Stim. State ON, the back-end stimulator was programmed to deliver 12 biphasic current pulses (±100µA, 60Hz, 2.1ms/phase) per stimulus trigger to activate dopamine neurons innervating the striatum. The SoC also successfully resolved the dopamine response from that of ΔpH and ΔBckgnd in real time using the chemometrics function of the DSP unit.
Fig. 15.
Closed-loop regulation of electrically evoked dopamine levels between two user-set minimum and maximum thresholds in the dorsal striatum of an anesthetized rat. A calibration factor of ~10.04nA/µM was determined during CFM post-calibration with FIA and used to convert current values to concentration levels for the dopamine response. The SoC also successfully resolved the dopamine response from that of ΔpH and ABckgnd in real time using the chemometrics function of the DSP unit.
VII. Discussion
The “neurochemostat” SoC presented in this work combined FSCV-based neurochemical sensing, PCR-based chemometrics, and feedback-controlled microstimulation for proof-of-concept demonstration of regulating electrically evoked brain dopamine levels between two user-set thresholds. The SoC functions were selected judiciously as FSCV affords exquisite temporal and chemical resolution for monitoring electroactive species in vivo [23], while PCR enhances the chemical resolution of FSCV by extending it to the multivariate domain [28]. Convenient and effective for activating neuronal circuitry, electrical stimulation is also used clinically in the neurosurgical approach of deep brain stimulation (DBS) for treating motor and neurologic disorders [14]. Our target analyte for closed-loop control was also selected judiciously, as dopamine is critical for important brain functions and associated with debilitating neuropathologies [27], and is arguably the neurotransmitter best characterized by real-time microsensors. Its electrically evoked release is also captured with high fidelity by FSCV and PCR [23].
Because FSCV with a CFM is a versatile analytical approach that is amenable to monitoring a variety of electroactive species [23], it is conceivable that brain levels of other neurotransmitters, such as serotonin, norepinephrine, adenosine, and histamine, could be similarly regulated by the SoC after optimizing the FSCV and electrical stimulation parameters for each neurotransmitter. However, deposition of a thin Nafion layer on the CFM WE is required for monitoring serotonin to avoid sensor fouling [31]. The PCR strategy for resolving dopamine from ΔpH and ΔBckgnd can be adopted for other neurotransmitters as well, because these two interferents are commonly encountered using FSCV with a CFM in vivo. Once identified, additional interferents can be added to the training set to improve chemical resolution. Although PCR is well established for FSCV, other chemometrics approaches such as partial least-squares (PLS) regression can also be considered in the future [32].
Potential applications of the “neurochemostat” SoC are dependent on the availability of well characterized neurochemical signals and suitable microsensors. FSCV with a CFM is now established for monitoring the so-called dopamine transients in the striatum of awake laboratory animals [24]. These short-lived elevations in brain dopamine levels are elicited by synchronous burst firing of dopamine neurons and are important for normal reward-related learning [33]. Moreover, drugs of abuse are thought to hijack brain reward systems by over-activating dopamine transients [34]. Thus, with modification of the DSP unit to detect dopamine transients, the SoC could be utilized to control these behaviorally relevant dopamine signals. One possible strategy is to use the SoC to detect dopamine transients and electrically stimulate inhibitory inputs to dopamine neurons to quiet their burst firing when dopamine transients are hyperactive. Conversely, excitatory inputs to dopamine neurons could be activated when dopamine transients are underactive. Closed-loop control of basal dopamine levels is more challenging, because FSCV is best suited to monitoring relative changes in neurotransmitter concentration. However, the continued development of fast-scan controlled-adsorption voltammetry (FSCAV) for measuring absolute levels of brain extracellular dopamine may one day afford this application as well [35].
The realization of the closed-loop feedback strategy for clinical applications is more challenging, because it will require establishing the neurochemistry underpinning the pathology of neuromodulation and the availability of chemical microsensors for chronic implantation. FSCV has been applied to the human brain for acute measurements of dopamine [36] and adenosine [37] in the context of DBS surgery. For the human dopamine measurements, the microsensor was a CFM similar to the one used herein, except fabricated using polyimide-coated fused silica instead of borosilicate and previously demonstrated to support chronic recordings in the rat brain for up to four months [38]. PCR, which was used to resolve dopamine in the human brain [36], employed a prerecorded training set obtained in rats. Similarly, a prerecorded training set has been used for PCR of recordings collected at chronically implanted CFMs in the rat (e.g., [39]). Thus, this approach may be possible for months-long recording of dopamine in the human, although this has not been attempted yet. The microsensor used for human adenosine measurements was fabricated using either a 7µm- or 30µm-diameter CFM [37]. Whether this CFM could be used chronically in humans is not known at this time. Diamond-based microsensors have also been used for recording dopamine [40], serotonin [41], and adenosine [42] with FSCV in animal studies. While exhibiting attractive characteristics for electrochemical monitoring, such as biocompatibility, predictable surface chemistry, chemical and mechanical robustness, resistance to fouling, and wide-potential window of water stability [43], diamond-based microsensors have not been applied to the human brain yet.
VIII. Conclusion
Activity-dependent neuromodulation ICs form the core of implantable BMBI technologies that combine neural recording, signal processing, and microstimulation in a single device for closed-loop interfacing with the nervous system. Currently, these ICs focus on bioelectric signals only, with no such approach extended to neurochemistry yet. In this paper, we reported on a neural interface SoC that uniquely combined neurochemical sensing, on-the-fly chemometrics, and feedback-controlled microstimulation in order to realize a “neurochemostat” for closed-loop regulation of electrically evoked brain dopamine. This work can ultimately usher in new clinical therapeutic strategies for maintaining patient-specific optimal neurochemical levels in disease states via real-time activity-dependent neuromodulation.
Acknowledgments
This work was supported by the National Institute on Biomedical Imaging and Bioengineering (NIBIB) and National Institute on Drug Abuse (NIDA) of the National Institutes of Health (NIH) under award numbers EB-014539 and DA-036331, respectively.
Biographies

Bardia Bozorgzadeh (S’08–M’15) was born in 1983. He received the B.S. degree from the Sharif University of Technology, Tehran, Iran, in 2006, the M.S. degree from the University of Tehran, Tehran, Iran, in 2009, and the Ph.D. degree from the Case Western Reserve University, Cleveland, OH, USA, in 2015, all in electrical engineering. His research interests include analog/mixed-signal/digital VLSI IC design and ASIC implementation of DSP systems for low-power applications, including implantable biomedical microsystems and wireless microelectronic devices.

Douglas R. Schuweiler was born in 1981. He received the B.S. degree in psychology from the University of Illinois, Urbana-Champaign, IL, USA, in 2008, and the M.S. degree in psychology at Illinois State University, Normal, IL, USA in 2013. He is currently pursuing the Ph.D. degree from the School of Biological Sciences at Illinois State University in the laboratory of Dr. Paul Garris. His current research activities focus on the effects of amphetamine on the relationship between dopamine signaling in discrete brain regions of the awake rat and reward-related behavior.

Martin J. Bobak was born in 1989. He received the B.S. degree in biology from the Illinois State University, Normal, IL, USA, in 2012. He is currently pursuing the M.S. degree from the School of Biological Sciences in the Physiology and Neuroscience Sequence at Illinois State University. Working in the laboratory of Dr. Paul Garris, he is currently studying the effects of wake-promoting and cognitive-enhancing therapeutics on the dopaminergic system.

Paul A. Garris was born in 1960. He received the B.A. degree in religion from the Earlham College, Richmond, IN, USA, in 1983 and the Ph.D. degree from the Department of Physiology and Biophysics at Indiana University School of Medicine, Indianapolis, IN, USA, in 1990. After postdoctoral work in the Department of Chemistry at the University of North Carolina, Chapel Hill, NC, USA, he joined the faculty at Illinois State University, Normal, IL, USA, in 1996 with appointments in the School of Biological Sciences and Departments of Chemistry and Psychology. His research activities include neuroadaptation in Parkinson’s disease and methamphetamine neurotoxicity, mechanisms of psychostimulant action, and microsensor and microsensor instrumentation development. He has served on the Instrument Development for Biological Research grant panel at the National Science Foundation USA, has reviewed grants for the National Institutes of Health USA, and has presented invited talks at the Pittsburgh Conference and International Conference on In Vivo Methods. In 2011, he achieved the rank of Distinguished University Professor at Illinois State University.

Pedram Mohseni (S’94–M’05–SM’11) was born in 1974. He received the B.S. degree from the Sharif University of Technology, Tehran, Iran, in 1996, and the M.S. and Ph.D. degrees from the University of Michigan, Ann Arbor, MI, USA, all in electrical engineering, in 1999 and 2005, respectively. Currently, he is a tenured Associate Professor in the Electrical Engineering and Computer Science Department at Case Western Reserve University, Cleveland, OH, USA, with a secondary appointment in the Biomedical Engineering Department. His research interests include analog/mixed-signal/RF integrated circuits and microsystems for neural engineering, interface circuits for micro/nano-scale sensors/actuators, wireless sensing/actuating systems for brain-machine interfaces, biomedical microtelemetry, and assembly/packaging of biomicrosystems. Dr. Mohseni has been an Associate Editor for the IEEE Transactions on Circuits and Systems – Part II (2010–2012), IEEE Transactions on Biomedical Circuits and Systems (2008– present), and IEEE Transactions on Neural Systems and Rehabilitation Engineering (2012–present). In addition he was a Guest Editor for the IEEE Journal on Emerging and Selected Topics in Circuits and Systems in 2011. He also serves on the Technical Program Committee of the IEEE CICC and RFIC Symposium. He was the recipient of the EECS Faculty Research Award for Exceptional Achievement in 2008, National Science Foundation CAREER Award in 2009, Case School of Engineering Research Award in 2011, EECS Mihajlo “Mike” Mesarovic Award for Extraordinary Impact in 2013, and earned the first-place prize of the Medical Device Entrepreneur’s Forum at the 58th annual conference of the ASAIO in 2012. He is a member of the IEEE Solid-State Circuits, Circuits and Systems, and Engineering in Medicine and Biology Societies, as well as the administrative committee (AdCom) of the IEEE Sensors Council.
Contributor Information
Bardia Bozorgzadeh, .
Douglas R. Schuweiler,
Martin J. Bobak,
Paul A. Garris, Email: pagarri@ilstu.edu, .
Pedram Mohseni, Email: pedram.mohseni@case.edu, ; .
References
- 1.Limnuson K, Lu H, Chiel HJ, Mohseni P. A bidirectional neural interface SoC with an integrated spike recorder, microstimulator, and low-power processor for real-time stimulus artifact rejection. J. Analog Integr. Circ. Sig. Process. 2015 Feb;82(2):457–470. [Google Scholar]
- 2.Rhew HG, Jeong J, Fredenburg JA, Dodani S, Patil PG, Flynn MP. A fully self-contained logarithmic closed-loop deep brain stimulation SoC with wireless telemetry and wireless power management. IEEE J. Solid-State Circuits. 2014 Oct;49(10):2213–2227. [Google Scholar]
- 3.Chen WM, et al. A fully integrated 8-channel closed-loop neural-prosthetic CMOS SoC for real-time epileptic seizure control. IEEE J. Solid-State Circuits. 2014 Jan;49(1):232–247. [Google Scholar]
- 4.Guggenmos DJ, Azin M, Barbay S, Mahnken JD, Dunham C, Mohseni P, J R. Nudo. Restoration of function after brain damage using a neural prosthesis. Proc. Natl. Acad. Sci. USA (PNAS) 2013 Dec;110(52):21177–21182. doi: 10.1073/pnas.1316885110. [DOI] [PMC free article] [PubMed] [Google Scholar]
- 5.Abdelhalim K, Mazhab Jafari H, Kokarovtseva L, Velazquez JLP, Genov R. 64-channel UWB wireless neural vector analyzer SoC with a closed-loop phase synchrony-triggered neurostimulator. IEEE J. Solid-State Circuits. 2013 Oct;48(10):2494–2510. [Google Scholar]
- 6.Stanslaski S, Afshar P, Cong P, Giftakis J, Stypulkowski P, Carlson D, Linde D, Ullestad D, Avestruz AT, Denison T. Design and validation of a fully implantable, chronic, closed-loop neuromodulation device with concurrent sensing and stimulation. IEEE Trans. Neural Syst. Rehab. Eng. 2012 Jul;20(4):410–421. doi: 10.1109/TNSRE.2012.2183617. [DOI] [PubMed] [Google Scholar]
- 7.Azin M, Guggenmos DJ, Barbay S, Nudo RJ, Mohseni P. A miniaturized system for spike-triggered intracortical microstimulation in an ambulatory rat. IEEE Trans. Biomed. Eng. 2011 Sep;58(9):2589–2597. doi: 10.1109/TBME.2011.2159603. [DOI] [PubMed] [Google Scholar]
- 8.Azin M, Guggenmos DJ, Barbay S, Nudo RJ, Mohseni P. A battery-powered activity-dependent intracortical microstimulation IC for brain-machine-brain interface. IEEE J. Solid-State Circuits. 2011 Apr;46(4):731–745. [Google Scholar]
- 9.Lee J, Rhew HG, Kipke DR, Flynn MP. A 64-channel programmable closed-loop neurostimulator with 8-channel neural amplifier and logarithmic ADC. IEEE J. Solid-State Circuits. 2010 Sep;45(9):1935–1945. [Google Scholar]
- 10.Chen T, Chen K, Yang Z, Cockerham K, Liu W. A biomedical multiprocessor SoC for closed-loop neuroprosthetic applications. Dig. Tech. Papers IEEE Int. Solid State Circuits Conference (ISSCC’09); February 8–12, 2009; San Francisco, CA. pp. 434–435. [Google Scholar]
- 11.Avestruz AT, Santa W, Carlson D, Jensen R, Helfenstine S, Stanslaski A, Denison T. A 5µW/channel spectral analysis IC for chronic bidirectional brain-machine interfaces. IEEE J. Solid-State Circuits. 2008 Dec;43(12):3006–3024. [Google Scholar]
- 12.Grahn PJ, Mallory GW, Khurram OU, Berry BM, Hachmann JT, Bieber AJ, Bennet KE, Min HK, Chang SY, Lee KH, Lujan JL. A neurochemical closed-loop controller for deep brain stimulation: toward individualized smart neuromodulation therapies. Front. Neurosci. 2014 Jun;8(169) doi: 10.3389/fnins.2014.00169. [DOI] [PMC free article] [PubMed] [Google Scholar]
- 13.Behrend CE, Cassim SM, Pallone MJ, Daubenspeck JA, Hartov A, Roberts DW, Leiter JC. Toward feedback-controlled deep brain stimulation: dynamics of glutamate release in the subthalamic nucleus in rats. J. Neurosci. Meth. 2009 Jun;180(2):278–289. doi: 10.1016/j.jneumeth.2009.04.001. [DOI] [PubMed] [Google Scholar]
- 14.Lee KH, Blaha CD, Garris PA, Mohseni P, et al. Evolution of deep brain stimulation: Human electrometer and smart devices supporting the next generation of therapy. J. Neuromodulation: Technology at the Neural Interface. 2009 Apr;12(2):85–103. doi: 10.1111/j.1525-1403.2009.00199.x. [DOI] [PMC free article] [PubMed] [Google Scholar]
- 15.Nazari MH, Mazhab-Jafari H, Leng L, Guenther A, Genov R. CMOS neurotransmitter microarray: 96-channel integrated potentiostat with on-die microsensors. IEEE Trans. Biomed. Circuits and Systems. 2013 Jun;7(3):338–348. doi: 10.1109/TBCAS.2012.2203597. [DOI] [PubMed] [Google Scholar]
- 16.Guo J, Ng W, Yuan JN, Chan M. Dig. Tech. Papers IEEE Symp. VLSI Circuits. Japan: Kyoto; 2013. Jun, A 200-channel 10µW 0.04mm2 dual-mode acquisition IC for high-density MEA; pp. 48–49.pp. 11–14. [Google Scholar]
- 17.Kim BN, Herbst AD, Kim SJ, Minch BA, Lindau M. Parallel recording of neurotransmitters release from chromaffin cells using a 10 × 10 CMOS IC potentiostat array with on-chip working electrodes. Biosensors Bioelectronics. 2013 Mar;41:736–744. doi: 10.1016/j.bios.2012.09.058. [DOI] [PMC free article] [PubMed] [Google Scholar]
- 18.Roham M, Covey DP, Daberkow DP, Ramsson ES, Howard CD, Heidenreich BA, Garris PA, Mohseni P. A wireless IC for time-share chemical and electrical neural recording. IEEE J. Solid-State Circuits. 2009 Dec44(12):3645–3658. [Google Scholar]
- 19.Mollazadeh M, Murari K, Cauwenberghs G, Thakor N. Wireless micropower instrumentation for multimodal acquisition of electrical and chemical neural activity, IEEE Trans. Biomed. Circuits and Systems. 2009 Dec;3(6):388–397. doi: 10.1109/TBCAS.2009.2031877. [DOI] [PubMed] [Google Scholar]
- 20.Roham M, Halpern JM, Martin HB, Chiel HJ, Mohseni P. Wireless amperometric neurochemical monitoring using an integrated telemetry circuit. IEEE Trans. Biomed. Eng. 2008 Nov;55(11):2628–2634. doi: 10.1109/TBME.2008.2001264. [DOI] [PMC free article] [PubMed] [Google Scholar]
- 21.Bozorgzadeh B, Covey DP, Howard CD, Garris PA, Mohseni P. A neurochemical pattern generator SoC with switched-electrode management for single-chip electrical stimulation and 9.3µW, 78pArms, 400V/s FSCV sensing. IEEE J. Solid-State Circuits. 2014 Apr;49(4):881–895. [Google Scholar]
- 22.Bozorgzadeh B, Covey DP, Howard CD, Garris PA, Mohseni P. Dig. Tech. Papers IEEE Symp. VLSI Circuits. Japan: Kyoto; 2013. Jun, A neurochemical pattern generator SoC with switched-electrode management for single-chip electrical stimulation and 9.3µW, 78pArms, 400V/s FSCV sensing; pp. 50–51. 11–14. [Google Scholar]
- 23.Robinson DL, Hermans A, Seipel AT, Wightman RM. Monitoring rapid chemical communication in the brain. Chem. Rev. 2008;108:2554–2584. doi: 10.1021/cr068081q. [DOI] [PMC free article] [PubMed] [Google Scholar]
- 24.Phillips PE, Stuber GD, Heien ML, Wightman RM, Carelli RM. Subsecond dopamine release promotes cocaine seeking. Nature. 2003;422:614–618. doi: 10.1038/nature01476. [DOI] [PubMed] [Google Scholar]
- 25.Bozorgzadeh B, Covey DP, Heidenreich BA, Garris PA, Mohseni P. Real-time processing of fast-scan cyclic voltammetry (FSCV) data using a field-programmable gate array (FPGA). Proc. 36th Annu. Int. IEEE Eng. Med. Biol. Conf. (EMBC’14); August 26–30, 2014; Chicago, IL. pp. 2036–2039. [DOI] [PubMed] [Google Scholar]
- 26.Bozorgzadeh B, Schuweiler D, Bobak M, Garris PA, Mohseni P. Dig. Tech. Papers IEEE Symp. VLSI Circuits. Japan: Kyoto; 2015. Jun 16–19, Neurochemical thermostat: A neural interface SoC with integrated chemometrics for closed-loop regulation of brain dopamine; pp. 110–111. [DOI] [PMC free article] [PubMed] [Google Scholar]
- 27.Iversen SD, Iversen LL. Dopamine: 50 years in perspective. Trends Neurosci. 2007;30(5):188–193. doi: 10.1016/j.tins.2007.03.002. [DOI] [PubMed] [Google Scholar]
- 28.Keithley RB, Heien ML, Wightman RM. Multivariate concentration determination using principal component regression with residual analysis. Trends Analyt. Chem. 2009;28:1127–1136. doi: 10.1016/j.trac.2009.07.002. [DOI] [PMC free article] [PubMed] [Google Scholar]
- 29.Heien ML, Johnson MA, Wightman RM. Resolving neurotransmitters detected by fast-scan cyclic voltammetry. Anal. Chem. 2004;76:5697–5704. doi: 10.1021/ac0491509. [DOI] [PubMed] [Google Scholar]
- 30.Candy JC. Decimation for sigma-delta modulation. IEEE Trans. Communications. 1986 Jan;COM-34(1):72–76. [Google Scholar]
- 31.Hashemi P, Dankoski EC, Petrovic J, Keithley RB, Wightman RM. Voltammetric detection of 5-hydroxytryptamine release in the rat brain. Anal. Chem. 2009;81:9462–9471. doi: 10.1021/ac9018846. [DOI] [PMC free article] [PubMed] [Google Scholar]
- 32.Geladi P, Kowalski BR. Partial least-squares regression: a tutorial. Analytica Chimca Acta. 1986;185:1–17. [Google Scholar]
- 33.Schultz W. Behavioral dopamine signals. Trends Neurosci. 2007;30:203–210. doi: 10.1016/j.tins.2007.03.007. [DOI] [PubMed] [Google Scholar]
- 34.Covey DP, Roitman MF, Garris PA. Illicit dopamine transients: Reconciling actions of abused drugs. Trends Neurosci. 2014;37:200–210. doi: 10.1016/j.tins.2014.02.002. [DOI] [PMC free article] [PubMed] [Google Scholar]
- 35.Atcherley CW, Laude ND, Parent KL, Heien ML. Fast-scan controlled-adsorption voltammetry for the quantification of absolute concentrations and adsorption dynamics. Langmuir. 2013;29:14885–14892. doi: 10.1021/la402686s. [DOI] [PubMed] [Google Scholar]
- 36.Kishida KT, Sandberg SG, Lohrenz T, Comair YG, Saez I, Phillips PE, Montague PR. Sub-second dopamine detection in human striatum. PLoS One. 2011;6(8):1–5. doi: 10.1371/journal.pone.0023291. [DOI] [PMC free article] [PubMed] [Google Scholar]
- 37.Chang SY, et al. Wireless fast-scan cyclic voltammetry to monitor adenosine in patients with essential tremor during deep brain stimulation. Mayo Clin. Proc. 2012;87:760–765. doi: 10.1016/j.mayocp.2012.05.006. [DOI] [PMC free article] [PubMed] [Google Scholar]
- 38.Clark JJ, et al. Chronic microsensors for longitudinal, subsecond dopamine detection in behaving animals. Nature Meth. 2010;7:126–129. doi: 10.1038/nmeth.1412. [DOI] [PMC free article] [PubMed] [Google Scholar]
- 39.Wanat MJ, Kuhnen CM, Phillips PE. Delays conferred by escalating costs modulate dopamine release to rewards but not their predictors. J. Neurosci. 2010;30:12020–12027. doi: 10.1523/JNEUROSCI.2691-10.2010. [DOI] [PMC free article] [PubMed] [Google Scholar]
- 40.Arumugam PU, Zeng H, Siddiqui S, Covey DP, Carlisle JA, Garris PA. Characterization of ultrananocrystalline diamond microsensors for in vivo dopamine detection. Appl. Phys. Lett. 2013;102:1–5. doi: 10.1063/1.4811785. [DOI] [PMC free article] [PubMed] [Google Scholar]
- 41.Halpern JM, Xie S, Sutton GP, Higashikubo BT, Chestek CA, Chiel HJ, Martin HB. Diamond electrodes for neurodynamic studies in Aplysia californica. Diam. Rel. Mater. 2006;15:183–187. [Google Scholar]
- 42.Xie S, Shafer G, Wilson CG, Martin HB. In vitro adenosine detection with a diamond-based sensor. Diam. Rel. Mater. 2006;15:225–228. [Google Scholar]
- 43.Park J, Quaiserova-Mocko V, Patel BA, Novotny M, Liu A, Bian X, Galligan JJ, Swain GM. Diamond microelectrodes for in vitro electroanalytical measurements: current status and remaining challenges. Analyst. 2008;133:17–24. doi: 10.1039/b710236b. [DOI] [PubMed] [Google Scholar]


