Abstract
The decreasing cost of genotyping and genome sequencing has ushered in an era of genomic personalized medicine. More than 100,000 individuals have been genotyped by direct-to-consumer genetic testing services, which offer a glimpse into the interpretation and exploration of a personal genome. However, these interpretations, which require extensive manual curation, are subject to the preferences of the company and are not customizable by the individual. Academic institutions teaching personalized medicine, as well as genetic hobbyists, may prefer to customize their analysis and have full control over the content and method of interpretation. We present the Interpretome, a system for private genome interpretation, which contains all genotype information in client-side interpretation scripts, supported by server-side databases. We provide state-of-the-art analyses for teaching clinical implications of personal genomics, including disease risk assessment and pharmacogenomics. Additionally, we have implemented client-side algorithms for ancestry inference, demonstrating the power of these methods without excessive computation. Finally, the modular nature of the system allows for plugin capabilities for custom analyses. This system will allow for personal genome exploration without compromising privacy, facilitating hands-on courses in genomics and personalized medicine.
1. Background and Significance
The rapid decrease in the price of genotyping and sequencing technologies, with the race to the $1,000 genome, has brought forth an age of genomic personalized medicine. The market of direct-to-consumer (DTC) genotyping, with the emergence of companies such as 23andMe, Navigenics, and Lumigenix, has put personal genotype information in the hands of patients and health care providers, based around the central idea that individuals are the owners of their genotype data. However, the problem has now shifted from the generation of accurate genotype data to tackling the problem of the “$1,000,000 interpretation.” Without the proper tools, both patients and physicians will find it difficult to interpret and analyze the extraordinary amount of data, effectively rendering it useless.
DTC genetic testing companies normally provide some data analysis, but such an approach has a number of drawbacks. First, DTC genetic testing companies may sometimes use proprietary algorithms that remain undisclosed, or use genetic data that are private and not available to the public. Hence, their analysis is not always transparent and the user may not understand how the analysis was done or be able to independently replicate the results. Second, the analysis can only be modified, expanded, or tweaked by the genotyping service itself, disallowing the application of other analysis by a third party. Finally, and perhaps most importantly, the consumer’s information is necessarily stored in a company’s server, to which people other than the user may have access.
In addition, the age of genomic personalized medicine has brought the use of genetic data into the clinical setting. However, the pace of medical education has not kept up with this demand and patients are beginning to enter clinics seeking guidance in interpreting their personal genomes. Stanford University has introduced a pioneering course in Personalized Medicine and Genomics, aimed at medical and graduate students interested in interpreting personal genomes. While interpretation is offered by these DTC genetic testing companies, medical schools and universities avoiding conflicts of interest may prefer to be independent and retain the ability to customize and expand their interpretations.
Various tools that have been developed for genomic analysis can be extended to interpret personal genotype information. For instance, genome-wide association studies (GWAS) have discovered the genetic factors related to various diseases and traits, which can be applied in reverse to personal genotypes to predict traits based on genetics. Additionally, approaches from population genetics that distinguish populations can be used to infer an individual’s ancestry. Many such techniques already exist and more are being developed every day and a systematic evaluation of these methods is crucial to present a compact and informative report to the end users. Equally important is the way to present this report, with the necessary background to understand each analysis, including its accurate interpretation and limitations. Additionally, more knowledgeable users, such as physicians or bioinformaticians, may wish to fine-tune the parameters of these analyses to fully exploit the given data.
We have developed a web-based genome interpretation engine that addresses these needs by providing comprehensive, secure, and highly customizable framework to analyze personal genotype information. Leveraging modern browser technology, including HTML5, CSS3, and the document canvas, we have built a system to analyze whole-genome genotype data within the user’s browser. The key feature of this approach is that the server is never sent any genotype data except when the user expressly requests to do so.
2. Methods
To accomplish these goals, we have built a client-side genome interpretation system, have implemented and developed advanced analyses for personal genomes, and built a framework for customization of annotations.
2.1. Client-side system
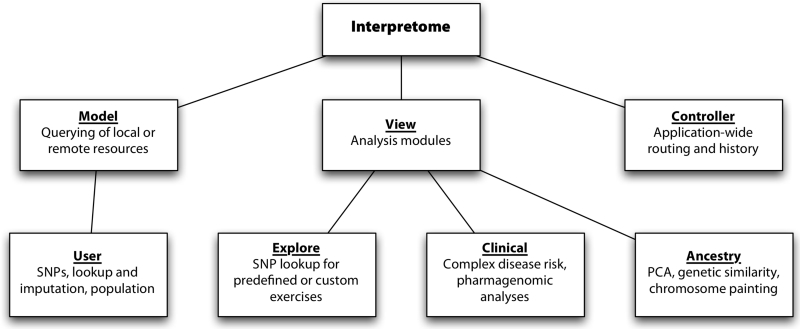
We leveraged several application and user interface (UI) frameworks for use on the client-side. We chose Backbone as an application framework, which separates client-resident code (Figure 1) into models (managing and manipulating data), views (responsible for the user interface of any particular section), and controllers (which route requests and manage application-level logic, e.g. session and history). In this terminology, the models correspond to a user, the views correspond to each analysis module, and we have a single application-level controller.
Figure 1.
Interpretome is designed along the Model-View-Controller pattern, separating the application into distinct components corresponding to data, analysis, and navigation.
As the ultimate goal of this application is to communicate genetic information in a clear and concise manner, making informed decisions about the user interface and representation of data was critically important. We conducted a survey of health-related websites in order to gauge the ‘state of the art’ in this domain. All attempt to balance accessibility and information content - many erring on the side of data overload. We decided to maintain a sparser interface, employing widgets from the jQueryUI, Google charts, and Highcharts libraries.
Since the entire application is loaded dynamically, our Backbone views utilize jQuery and jQueryUI to update the interface in response to user interaction. The clear separation of interface and logic afforded by our design choices enabled us to preserve application state across different modules. As users navigate to new modules, the Javascript logic and HTML content corresponding to those modules are loaded dynamically.
2.1.1. The user model
Determining how to load user genomes and how to represent a user was one of the first challenges in building Interpretome. Even a year ago, it would not have been possible to load a file into the Javascript machine without using obscure developer versions of a web browser. Since then, the newest releases of Chrome and Firefox have added support for the FileReader API, a new standard developed to support reading of text and other files in Javascript. Notably, this API does not have access to the filesystem, only to files the user has selected explicitly.
The user supplies a tab-delimited file (with RSID, chromosome, position, genotype), a format utilized by many DTC companies; additionally, we provide conversion scripts on request for all major DTC vendors, as well as other formats, including VCF files for full genomes. We parse these files line-by-line and store each SNP as an object in a hash table associated with a newly created user instance, and a progress bar provides a visual cue of the process. Even with larger files (several million SNPs) and older computers, this takes no more than thirty seconds.
2.1.2. Analysis views
When a user runs an analysis, a function is dispatched that runs the main computation. In many cases, the result of the first function is a block of data received from the server, which defines parameters of the exercise (e.g., a set of SNPs). Specifically, when genotype-specific information is requested, data for all possible genotypes are typically retrieved, preventing the deduction of the individual’s genotype by intercepting this query. After receiving the relevant data, the client queries the model for a user’s genotype at these SNPs (which may be measured directly in the user’s genotype or imputed using public data, as described below). Once the client receives the necessary data, the algorithm is run, without sending any genotype information to the server. Finally, the view updates the interface with the results and generates associated plots and figures.
2.1.3. Scalability
Delegating most of the computation into the browser has major advantages for scalability. Since our backend server is largely responsible for sending (as opposed to receiving) content, and database access is mostly limited to large cacheable chunks, scaling the application is relatively simple. We are able to increase site availability by simply adding more database servers and can ignore issues of synchronization across database replicates, which are huge challenges for other dynamic web applications.
2.2. Analyses
We have implemented a set of standard genome analysis modules for the Interpretome. These analyses utilize our client-side imputation method, which demonstrates the power and features of the private analysis system. Additionally, we have implemented clinical and ancestry analysis methods, as well as a number of exploratory tools, which are easily expandable.
2.2.1. Imputation
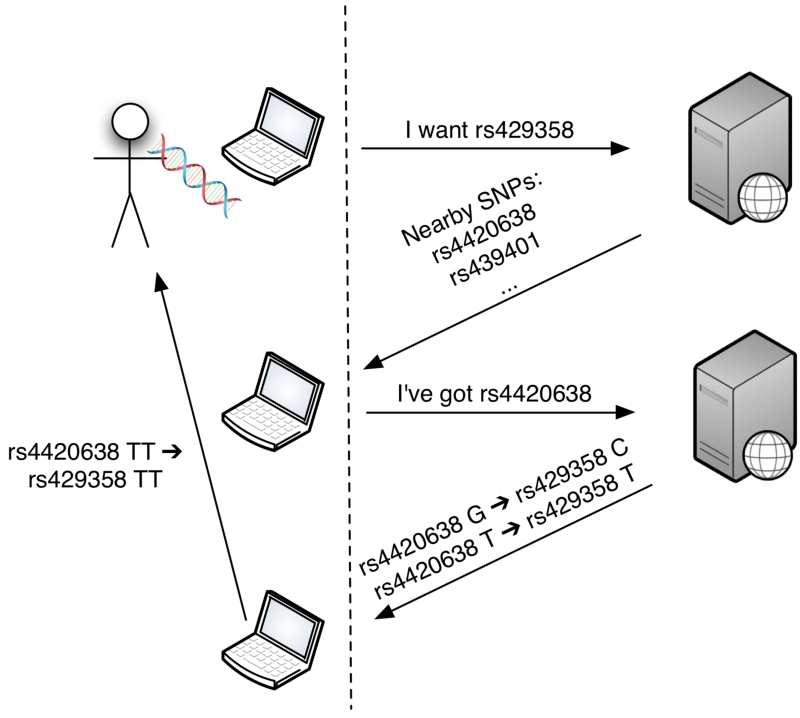
To expand the number of SNPs available for analysis, we first implemented a client-side imputation by proxy method. In this scheme, all the computation required for the task is performed on the client-side, with public information downloaded as required from the server (Figure 2). The user requests a number of SNPs not in the personal genotype file and a request is sent with RSID identifiers and a target population. The server responds by providing all SNPs in linkage disequilibrium with the requested SNP in the selected population (from Hapmap data). On the client side, the system determines which of these SNPs are contained in the personal genotype file, and thus, will be suitable for imputation. The client requests phase information for these SNPs from Hapmap genotype data from the server. These data are returned and the resulting SNPs are “imputed” from the returned phases in the browser.
Figure 2.
Imputation of a user’s genotype is done directly in the browser. Allele data from public databases needed to impute a user’s genotype can be obtained by just requesting the necessary SNPs through their rsids or genomic coordinates. No genotype information from the user is ever sent through the network.
2.2.2. Clinical analysis
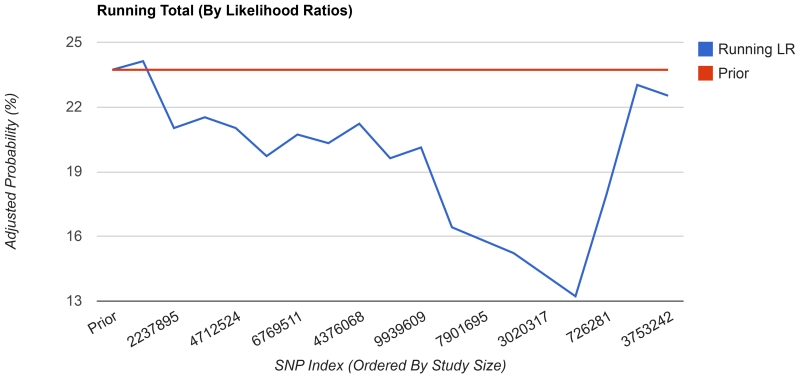
We have implemented a number of analyses that demonstrate the methods available for clinical interpretation of a personal genome. First, we have implemented a disease risk calculation, as in the first clinical assessment of a personal genome [Ashley et al., 2010]. We have employed the risk calculation method of likelihood ratios and demonstrate how each variant affects an individual’s risk of Type 2 Diabetes (Figure 3). Prior to the computation, the likelihood ratio for each genotype is downloaded from the server (with no genotype data sent to the server). The user inputs a population and sex, which define a prior probability for the disease. Then, the likelihood ratios are chained together (using the actual genotypes for the individual) as in [Morgan et al., 2010] to determine a posterior probability.
Figure 3.
Diabetes risk calculator. Using likelihood ratios calculated from published association studies, the diabetes risk exercise computes a user’s risk of developing Type 2 Diabetes. The estimate is based on a population and sex-specific prior for each user, adjusted by the user’s genotypes.
Additionally, we demonstrate the applications of a personal genome in pharmacogenomics, or the study of genetic variation related to drug response. For instance, warfarin, an anti-coagulant prescribed to millions of patients every year, has a high therapeutic range and genetic variants in genes such as VKORC1 and CYP2C9 have been implicated in this variation. These variants, along with clinical factors such as age and weight, can be used to predict an optimal predicted starting dose of warfarin [Consortium, 2009]. We have implemented this warfarin dose calculator, which predicts an optimal starting dose given a personal genotype and clinical parameters. In addition, we extend the pharmacogenomic application of personal genomes to other drugs, using a set of annotations from PharmGKB (www.pharmgkb.org; Michelle Carillo; personal communication).
Finally, we include a section for further exploration of rare pharmacogenomics variants (Table 1). This analysis searches for rare, non-synonymous variants in putative pharmacogenes (genes with drug-gene interaction data from DrugBank; www.drugbank.ca). The functional impact of these variants is predicted by PolyPhen2 [Adzhubei et al., 2010], which are pre-computed for all variants in dbSNP.
Table 1.
Rare Pharmacogenomic Variants. Non-synonymous, rare variants (MAF < 5%) in genes predicted to interact with drugs from DrugBank are shown for a personal genome. The PolyPhen Class and Score predict whether a variant may be damaging to the function of the protein, which may affect an individual’s drug response.
| dbSNP | Genotype | MAF | Gene Name | Drug Name | PolyPhen Class |
PolyPhen Score |
|---|---|---|---|---|---|---|
| rs16985442 | CG | 0.041 | SLC12A5 | Bumetanide | benign | 0 |
| rs10075302 | AC | 0.049 | SLC25A2 | L-Ornithine | benign | 0.064 |
| rs11548670 | AG | 0.022 | NDUFS1 | NADH | probably damaging |
0.999 |
| rs933135 | CT | 0.022 | Plcd1 | Acetate Ion | possibly damaging |
0.822 |
| rs9332608 | AG | 0.049 | F5 | Phenylmercury | benign | 0.021 |
| rs4252128 | CT | 0 | PLG | Bicine | possibly damaging |
0.418 |
| rs363504 | AG | 0.022 | GRIK1 | Topiramate | benign | 0 |
| rs1801690 | CG | 0.046 | APOH | Alpha-D- Mannose |
probably damaging |
0.938 |
| rs1805321 | AG | 0 | PMS2 | Adenosine-5′- Diphosphate |
benign | 0.002 |
2.2.3. Ancestry analysis
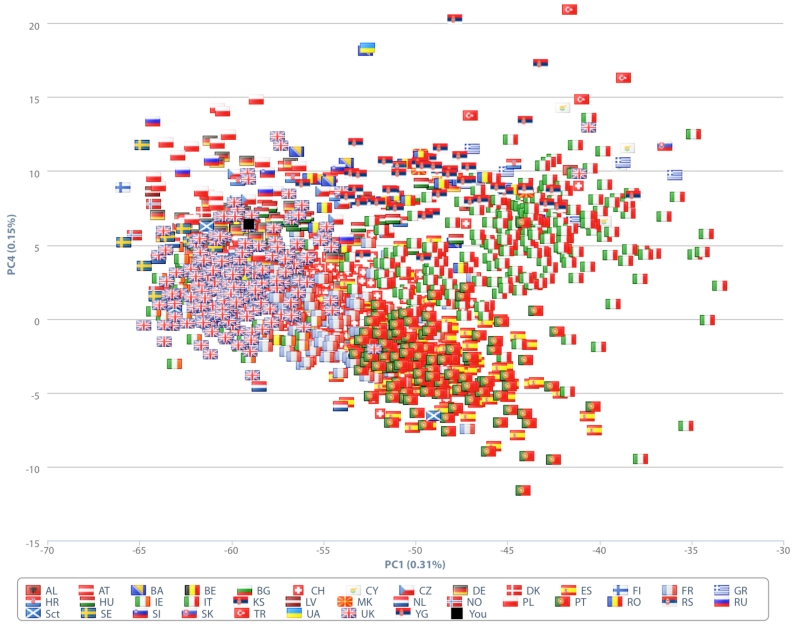
As methods for population genetics can be applied to infer ancestry from personal genomes, we have implemented client-side methods for global ancestry similarity, individual similarity, and chromosome painting. First, we have enabled individuals to compare their personal genomes to a reference panel, using principal component analysis (PCA). Typically, to run such an analysis, an individual genotype would be added to a reference panel, such as the HGDP [Cann et al., 2002] or POPRES [Novembre et al., 2008] datasets, and principal components would be calculated for the combined dataset, which can take from 10 minutes to an hour for each dataset. In this method, we have instead pre-computed the eigenvectors and loadings for each SNP, as well as projections of the individuals in the reference panels. When the analysis is run, the client downloads these data and then projects the user’s genotype onto the same dataset to compute the principal component coordinates, and the resulting projections are plotted using the Highcharts library (Figure 4). One limitation to this approach is that the user requires the same SNPs as those used to pre-compute the PCA results. We avoid this problem by providing multiple options for performing the projections, based on common platforms (Illumina Hap550+ and Illumina OmniExpress+) and this problem will be solved when full genomes are supported.
Figure 4.
Ancestry analysis by PCA. Loadings for numerous population data sources are precomputed, allowing a user to project their data onto any one of those datasets. Here, an Eastern European individual is plotted in the upper-left quadrant among the POPRES European reference panel.
Additionally, we implemented a heuristic algorithm for chromosome painting. The state-of-the-art algorithms were not suitable for this task, as they require phased data and employ computationally expensive hidden Markov models (HMMs) to determine the most likely ancestry for each allele. Therefore, we designed a Monte Carlo simulation method to generate an approximation. First, we pre-computed the most informative population-differentiating SNPs and the client requests the allele frequencies for these SNPs in the selected reference panel. Then, for each “block” of the genome, we sample an allele from each genotype randomly (since we cannot determine phase) and use the allele frequency for that SNP to update a Bayesian model, which represents the likelihood of the block originating from each population given the data. For each iteration, the most likely population is chosen for each block, and this simulation is run multiple times to generate a number of votes for each block. These votes are then aggregated and ancestry is assigned: if the proportion of votes crosses a “heterozygosity threshold,” both blocks are painted with the highest voted ancestry; otherwise, the highest and 2nd highest ancestries are chosen. The results are then smoothed and the results are plotted in Canvas (Figure 5).
Figure 5.
Chromosome Painting. The first two chromosomes from a half-European, half-Asian individual are shown. CEU, YRI, CHB, and JPT refer to European, African, Chinese, and Japanese Hapmap populations, respectively.
2.2.4. Exploratory analysis
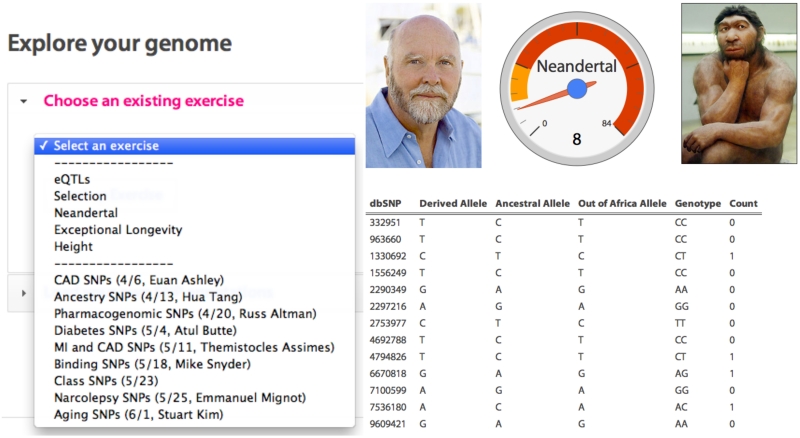
Finally, we also implement a number of exploratory analyses and modules that were integrated with lectures of the Stanford course in Personalized Medicine and Genomics (Figure 6, left). For instance, we aggregated the SNPs associated with height from the GWAS catalog [Hindorff et al., 2009] and combined their effect sizes to create an approximate height prediction algorithm. Additionally, we created a widget to count the number of Neandertal-derived alleles [Green et al., 2010] in a personal genotype (Figure 6, right). Other exercises were developed to explore “SNPs of interest” that would integrate with a lecture, where students could optionally submit their allele information for real-time aggregation of allele frequencies.
Figure 6.
Exploratory analysis. (Left): Numerous exercises are predefined, some with content from lectures of the Stanford Personalized Medicine course. Each of these is implemented independently, but all share a common data table format. (Right): One such analysis; Neandertal alleles in a personal genotype.
Through the development of these exercises, we observed that one major use case involved the counting of “risk” alleles (or alleles of some effect or significance), possible weighted by some “effect size” measure, such as odds ratios for traits, or centimeters for height. Therefore, we developed a customization framework for users to perform their own analyses.
2.3. User Customization
Although we wanted to provide curated datasets for standard analysis of a user’s personal genome, we also wanted to allow the possibility of custom analyses. We therefore added functionality that allows the user to load custom annotated SNP lists. The user can then compare personal genotype information to this SNP list, as with the default exercises. For instance, a user may be interested in how many rare variants in a specific gene are found in a personal genotype and compare their results with those of colleagues or other personal genotypes.
The custom SNPs are loaded as a tab-delimited file, containing a header line (that correspond to the header of the output table) and the first column must indicate the SNP rsid(s) in question. An example custom annotation file snippet can be viewed by clicking on the ‘Example Annotation File’ link. As with the default exercises in the Explore tab, a table showing the user’s genotype of his SNPs that were contained in the custom file, as well as its respective annotations, is presented to the user upon clicking the ‘Lookup custom exercise’ button.
In the course of development, we have noticed that one major use case involves reporting the allele count of the user’s genotype against particular annotated columns. Therefore, we also allow the user to specify which columns should be used for allele counting by surrounding the column header with the count( . ) syntax. It is worth noting that further functionality can be easily added to the custom exercise lookup; such as ethnicity specific SNP filtering or further aggregation, perhaps even SQL-like, functions. This could eventually allow researchers and developers to distribute custom annotation files and queries to expand the interpretive power of this system.
While a main focus of Interpretome is to maintain privacy of the user’s genotype data, we are aware that users may want to share their results with others or even submit their genotype information to contribute to the enhancement of Interpretome. We have thus included both the option to share the exploration exercises results through a social network site and to submit their raw genotype information in an anonymous fashion. These two options give the user the possibility to explore a spectrum of privacy restrictions: from the default, most restrictive setting in which the user does not choose to share any of his information, to the other extreme of sharing both the results from the analysis and even genotype information. Sharing is an opt-in choice left to the user, and we have included a detailed description of the possible consequences of sharing in the Start page, as well as pop-up dialogs that ask the user to confirm all submissions of results or genotype information.
3. Results
We present the Interpretome at www.interpretome.com, a system for exploratory personal genome analysis, including guided explanations for clinical and ancestry analysis. The system is fast and easy-to-use and has been demonstrated in the Stanford course in Personalized Medicine and Genomics.
This system can load 1 million SNPs from a personal genotype into modern browsers (including Chrome and Firefox) in ~5-10 seconds. Further analyses require a server query, which range from ~1 KB to ~15 MB. These downloads typically take a few seconds to less than a minute for relatively local users (Northern California users with at least a cable modem connection). Once downloaded, the computational load on the client-side is very light for most applications (running in <5 seconds). A notable exception is the chromosome painting algorithm, which utilizes a Monte Carlo simulation to infer ancestry for specific chromosomal regions. However, even this analysis runs in ~15-20 seconds on a new laptop using the default parameters.
We have demonstrated the use of this system in the pioneering course on Personalized Medicine and Genomics at Stanford University. In this course, medical and graduate students learned about genomic personalized medicine through a hands-on analysis of their personal genotypes, for which we required an easy-to-use system that could accomplish sophisticated genotype interpretation tasks. The system was deployed for the Spring 2011 course and accomplished these goals. Overall, course students gave positive feedback on the system, expressing that its interactivity and ease of use enabled non-experts to extract meaning out of their genomic information. Particularly, they found the ability to instantly see their personal alleles for specific traits accompanied by relevant descriptions and annotations useful to interpret the results. Furthermore, advanced users liked having the option of tweaking the parameters for each module, as they found it useful to see how the methods performed with different values. These comments emphasize that a system of genomic interpretation must have both experts and non-experts in mind to both gain acceptability by the general public and convince experts of its usability.
The speed of the system and submission logic also allowed for further integration with lectures. Throughout the course, instructors were able to discuss SNPs for which there was an interesting association and students would have an option of submitting their genotypes for each SNP anonymously. The submitted genetic information was then aggregated and real allele frequencies were displayed to the instructor and the class, allowing for interactive participation in course material.
4. Discussion
In this work, we present the Interpretome, a system for private personal genotype interpretation and education. We believe that this approach will overcome a major hurdle to wider adoption of personal genotyping: the question of privacy and ownership. Users of Interpretome are assured privacy, as their data remains on their computer and in their browser. There exists no mechanism to track a user across uses of the website or to correlate data requests with client profile information (sex, population, etc.). However, genotyping services, such as direct-to-consumer companies, currently store the consumer’s genomic information in their own servers. It may be preferable for service providers to provide users with an option for whether their genotype data should be stored at the company. Indeed, it would be ideal if the notion of privacy persisted through each step of the genotype pipeline, ensuring that only the consumer has exclusive access to their data.
The customizable nature of the Interpretome provides a platform for researchers to make their genomic annotations available to the general public. While we already enable the user to use their own SNP annotations, it would be straightforward to implement a web development framework, perhaps based on Javascript, for external modules that could be loaded at runtime. Such functionality would allow researchers to publish their methods as “Interpretome modules” for experts and non-experts to evaluate.
At present, we have included options for sharing of analysis results. While including these options may be considered controversial, it is our belief that enabling people to make informed choices about sharing their own genetic information will lead to an optimal trade-off between privacy and actionability of personal genomic data. The debate over privacy issues on genotype data is far from over. Thus, we believe that providing a genotype interpretation system that accommodates both extremes is essential to solving such conflicts.
Acknowledgments
We thank Euan Ashley, Atul J. Butte, Carlos D. Bustamante, Michelle Carillo, and Hua Tang for providing access to other data sources. We thank the students of the Stanford University course in Personalized Medicine and Genomics (Genetics 210, Spring 2011) for beta testing. KJK, JTD, and RPT were funded through training grant NIH LM007033, PC is funded through a Hewlett-Packard Stanford Graduate Fellowship. NPT is supported by DOE SCGF. RBA is a paid advisor to 23andme, Inc. MS and RBA are founders of Personalis, Inc.
KJK, RPT, NPT, and SKK conceived of the idea. KJK and RPT designed the site with significant input from NPT, PC, and SKK. KJK, RPT, NPT, JTD, and KS implemented the core analysis functionality; PC and KJK wrote the advanced graphing modules, user customizable framework, and data sharing schemes. SKK, RBA, and MS guided development and provided data and computational resources. KJK, RPT, PC, RBA, and SKK wrote the manuscript. All authors reviewed and approved the manuscript.
References
- 1.Ashley EA, et al. Clinical assessment incorporating a personal genome. Lancet. 2010;375:1525–1535. doi: 10.1016/S0140-6736(10)60452-7. [DOI] [PMC free article] [PubMed] [Google Scholar]
- 2.Cann HM, et al. A human genome diversity cell line panel. Science. 2002;296:261–262. doi: 10.1126/science.296.5566.261b. [DOI] [PubMed] [Google Scholar]
- 3.International Warfarin Pharmacogenetics Consortium et al. Estimation of the warfarin dose with clinical and pharmacogenetic data. N Engl J Med. 2009;360:753–764. doi: 10.1056/NEJMoa0809329. [DOI] [PMC free article] [PubMed] [Google Scholar]
- 4.Green RE, et al. A Draft Sequence of the Neandertal Genome. Science. 2010;328:710–722. doi: 10.1126/science.1188021. [DOI] [PMC free article] [PubMed] [Google Scholar]
- 5.Hindorff LA, Sethupathy P, Junkins HA, Ramos EM, Mehta JP, et al. Potential etiologic and functional implications of genome-wide association loci for human diseases and traits. Proc Natl Acad Sci U S A. 2009;106:9362–9367. doi: 10.1073/pnas.0903103106. [DOI] [PMC free article] [PubMed] [Google Scholar]
- 6.Morgan AA, Chen R, Butte AJ. Likelihood ratios for genome medicine. Genome Med. 2010;2:30. doi: 10.1186/gm151. [DOI] [PMC free article] [PubMed] [Google Scholar]
- 7.Adzhubei IA, et al. A method and server for predicting damaging missense mutations. Nature Methods. 2010;7(4):248–249. doi: 10.1038/nmeth0410-248. [DOI] [PMC free article] [PubMed] [Google Scholar]
- 8.Novembre J, Johnson T, Bryc K, et al. Genes mirror geography within Europe. Nature. 2008;456:98–101. doi: 10.1038/nature07331. [DOI] [PMC free article] [PubMed] [Google Scholar]


