

Abstract
Protein glycosylation plays many critical roles in biological function and creates the most diversity of all post-translational modifications (PTMs). Glycan structural diversity is directly correlated with difficulty in characterizing the intact glycoproteome by mass spectrometry (MS). In this protocol, we describe a novel mass-independent chemical glycoproteomics platform for characterizing intact, metabolically labeled glycopeptides from complex proteomes, termed Isotope Targeted Glycoproteomics (IsoTaG). To use IsoTaG, cell culture samples are metabolically labeled with an azido- or alkynyl-sugar. Metabolically labeled glycoproteins are then tagged using Click chemistry and enriched with an isotopic recoding biotin probe. Intact glycopeptides are recovered by cleavage of the probe, analyzed with directed MS, and assigned by targeted mass-independent data analysis. The outlined procedure is well defined in cell culture and has been executed with over 15 cell lines.
Keywords: glycoproteomics, bioorthogonal chemistry, metabolic labeling, chemical proteomics, mass spectrometry
Introduction
Protein glycosylation is a highly heterogeneous and ubiquitous post-translational modification (PTM) attached at asparagine (N-linked) or serine or threonine (O-linked) side chains. Glycoproteins are involved in many biological functions, such as intercellular communication (Paszek et al., 2014), intracellular signaling (Zachara and Hart, 2006), and protein stability (Parodi, 2000). Changes to the glycoproteome are often reflective of cellular state, and may be used as diagnostic of malignancy (Fuster and Esko, 2005), immune response (Hollingsworth and Swanson, 2004), and cellular state (Ma and Hart, 2013). Thus, a method to globally define the N- and O-glycoproteomes from complex whole cell samples is critical.
Methods to characterize the glycoproteome by mass spectrometry (MS) rely on enrichment and truncation of the glycan structure. Glycan-specific enrichment methods broadly encompass chemical derivatization [e.g., metabolic labeling (Chuh et al., 2014; Hubbard et al., 2011; Zaro et al., 2011), chemical tagging (Nilsson et al., 2009; Zhang et al., 2003), enzymatic labeling (Clark et al., 2008)] or lectin chromatography (Trinidad et al., 2013; Vosseller et al., 2006; Zielinska et al.). Glycoform simplification can be achieved by enzymatic release of the glycan from the protein [by PNGase F or EndoH (Hagglund et al., 2004)] for N-glycoproteins, or genetic engineering [SimpleCell (Steentoft et al., 2013; Steentoft et al., 2011)] for O-glycoproteins. Complete removal of the glycan using chemical methods [β-elimination (Greis et al., 1996)] mitigates the lower ionization efficiency of glycoconjugates (Pouria et al., 2004). However, truncation of the glycan comes at the expense of lost biological information.
In this protocol, we detail procedures for Isotope Targeted Glycoproteomics (IsoTaG), a mass-independent chemical glycoproteomics platform for intact N- and O-glycopeptide identification (Figure 1A) (Woo et al., 2015). The IsoTaG strategy exploits the perturbing effect of a dibrominated or otherwise isotopically encoded chemical tag on the glycopeptide isotopic envelope, which consists of the natural abundance of isotopes due to carbon, hydrogen, oxygen, nitrogen, and sulfur, to create a unique pattern that is visually and computationally recognizable (Fig. 1B). The pattern is then used to direct tandem MS events to tagged glycopeptides, irrespective of abundance, followed by targeted computational analysis for high confidence identification of the glycopeptide, including structural assignment of the pendant glycan. The protocols herein describe a robust method to metabolically label glycoproteins in cell culture, chemically enrich labeled glycoproteins, and perform mass-independent MS analysis.
Figure 1.
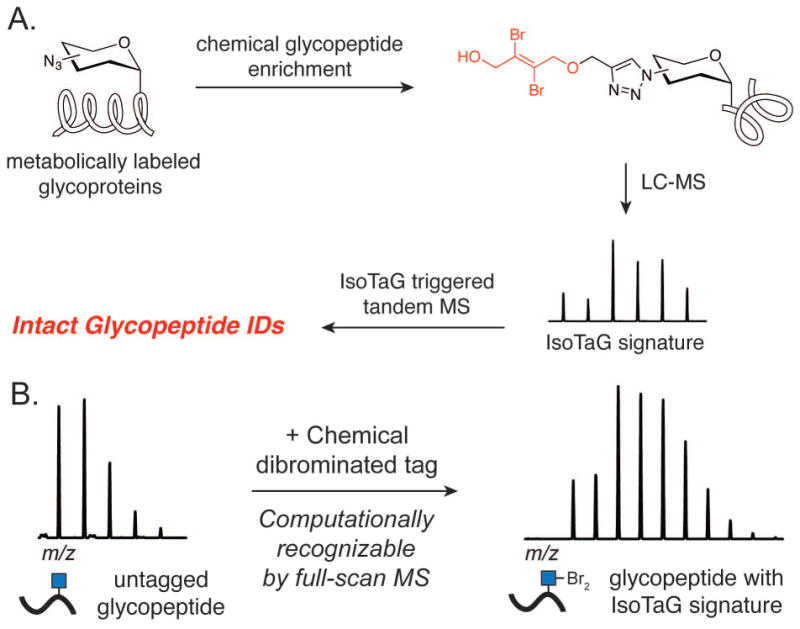
A. Overview of IsoTaG method detailed in this protocol. B. Perturbing effect on the isotopic distribution of glycopeptides due to the dibrominated chemical tag.
Overview of chemical glycoprotein enrichment and mass-Independent glycoproteomics protocols
IsoTaG consists of metabolic labeling of glycoproteins in cell culture, bioorthogonal tagging and chemical enrichment, followed by mass-independent MS data collection and analysis. The procedure has four key steps outlined in Figure 1A. First, samples of metabolically labeled glycoproteins are prepared in cell culture (PROTOCOL 1). Second, glycoproteins are enriched, recovered, and isotopically recoded with the complementary IsoTaG biotin probe (PROTOCOL 2, Figure 2). Third, inclusion list directed tandem MS is obtained (PROTOCOL 3). Fourth, targeted database analysis guided by the isotopic pattern enables high confidence characterization of the intact glycoproteome (PROTOCOL 3, see examples in Figures 3–5). Syntheses of the IsoTaG probes, IsoTaG azido biotin probe and IsoTaG alkynyl biotin probe, are described in SUPPORTING PROTOCOL 1 and 2, respectively. These protocols are generally applicable to modification site identification of other metabolically labeled protein samples of interest.
Figure 2. IsoTaG glycan and probe pairs.
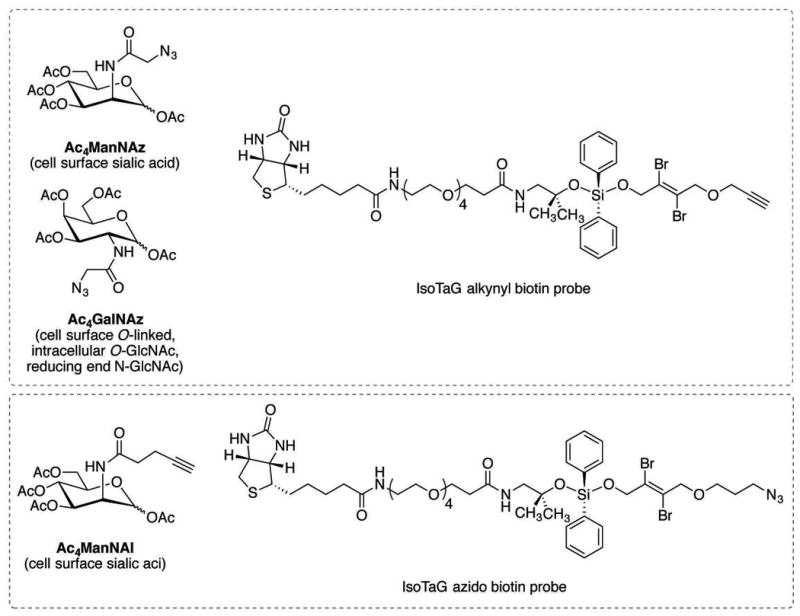
Figure 3. Assignment of a typical O-GalNAz glycopeptide procured via Ac4GalNAz treatment.
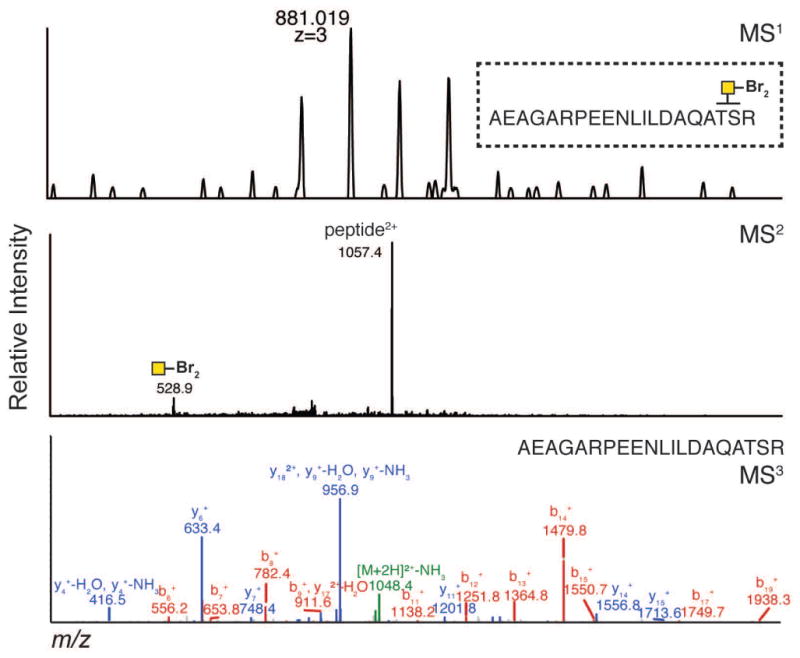
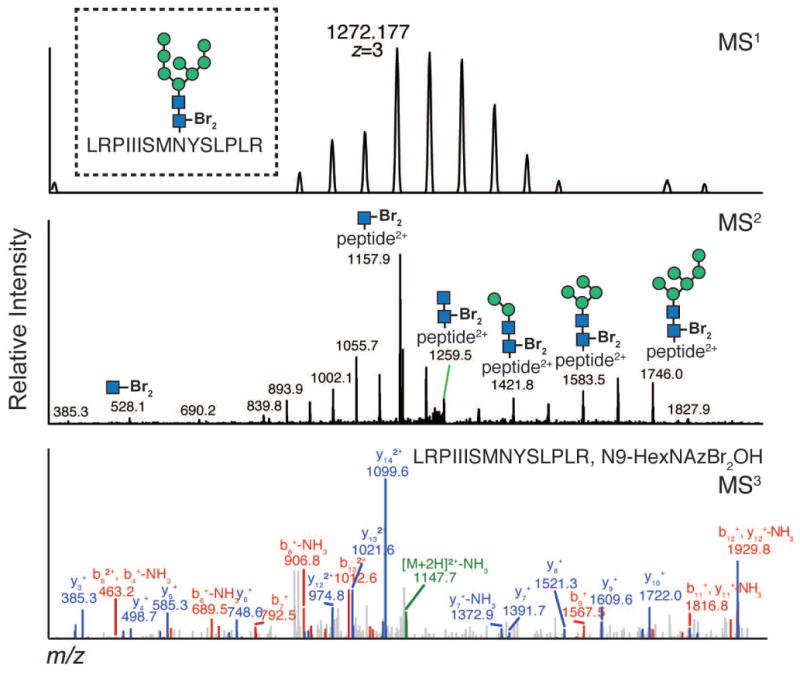
Figure 5. Assignment of a typical N-glycopeptide labeled by N-GlcNAz procured via Ac4GalNAz treatment.
PROTOCOL 1. Preparation of metabolically labeled cell lysates and conditioned media
This protocol details the preparation of metabolically labeled cell lysates for IsoTaG enrichment. The following is a standard protocol for preparation of azido- or alkynyl-sugar labeled cell lysates and conditioned media. Metabolic labeling is critical for successful glycoproteomics and should be carefully assessed for each cell line of interest prior to MS analysis. Metabolic labeling of glycoproteins is dependent on three considerations: first, the sugar precursor selected for labeling; second, access of the sugar precursor to the cell line; and third, glycosylation pathways activated in the cell line. Options for sugar precursor selection include Ac4ManNAz, Ac4GalNAz, Ac4GlcNAz, and Ac4ManNAl, among others. Ac4ManNAz and Ac4ManNAl are reporters of sialic acid. Ac4GalNAz and Ac4GlcNAz are able to access an intracellular epimerase pathway and are incorporated into O-GalNAc, O-GlcNAc, and N-GlcNAc sites (Boyce et al., 2011). The efficiency of metabolic labeling is dependent on access of the sugar precursor to the cell line, and testing with several sugar precursors may be necessary for best results. Finally, sugars with access to multiple metabolic endpoints (e.g., Ac4GalNAz) will be incorporated to a set of glycoproteins that are reflective of the glycosylation pathways currently activated in the cell line. In general, human cell lines (greater than 15 cell lines tested to date) are permissive to the sugar precursor and cell counts of 107–108 (equivalent to 1–3 mg of total protein) are sufficient inputs for this protocol. In the event that metabolic labeling is prohibitive, alternate options to install bioorthogonal handles to the sample of interest may be considered [e.g., enzymatic labeling (Clark et al., 2008)].
Materials
Dimethylsulfoxide (DMSO, C2H6OS, Sigma Aldrich)
-
Sugar precursor:
N-Azidoacetylgalactosamine-tetraacetylated (Ac4GalNAz, C16H22N4O10, 500 mM in DMSO, Pierce) OR
N-Azidoacetylglucosamine-tetraacetylated (Ac4GlcNAz, C16H22N4O10, 500 mM in DMSO, Pierce) OR
N-Azidoacetylmannosamine-tetraacetylated (Ac4ManNAz, C16H22N4O10, 500 mM in DMSO, Pierce) OR
N-(4-pentynoyl)mannosamine-tetraacetylated [Ac4ManNAl, C19H25NO10, 500 mM in DMSO, prepared in house according to the procedure of Chang and co-workers (Chang et al., 2009)]
Media A (see recipe)
Media B (see recipe)
Phosphate-buffered saline (PBS, pH 7.4, Life Technologies)
Tissue culture dish (150 mm, Corning)
Tissue culture flasks (T-160, Corning)
Disposable sterile pipettes (5, 10, 25, 50 mL, FisherSci)
Tissue culture incubator (37 °C, humidified, 5% CO2)
Centrifuge tubes (50 mL, Fisher)
Centrifugal filter units (10 kDa, 15 mL, Amicon)
Lysis buffer (see recipe)
RapiGest (10% in PBS, Waters)
Triton X-100 (0.1% in PBS, Sigma Aldrich)
Dounce homogenizer (5 mL, Wheaton)
Probe tip sonicator (Misionix)
Centrifuge
Trypsin, EDTA free (0.25%, HyClone)
BCA protein quantification assay (Pierce)
Absorbance plate reader
Metabolic labeling in cell culture
-
For adherent cells:
-
Treat six tissue culture dishes (150 mm) with 100 μM of sugar precursor (3.0 μL of 500 mM stock solution).
Tissue culture quantities prepared in this protocol will typically yield greater protein quantities than required, and may be adjusted for cell samples with limited availability. As described, a yield of 3–5 mg protein per fraction is expected at the end of PROTOCOL 1. Treat an additional six tissue culture dishes with DMSO (3.0 μL) as a control.
-
Add a suspension of cells to the tissue culture plate in Media A (15 mL, 2 × 10⁵ cells/mL).
The exact cell count should be calibrated to the proliferation rate of the cell type, such that the cells are nearly confluent after a 4 d incubation period. Incubate the twelve tissue culture dishes for 48 h at 37 °C in a humidified, 5% CO2 incubator.
-
Aspirate the tissue culture plates, wash with PBS (10 mL), and aspirate the PBS wash.
For analysis of cellular and membrane incorporation only, the current incubation period is sufficient and the user may skip to Preparation of Cell Lysates. -
Add Media B to the aspirated plates (15 mL). Add 100 μM of sugar metabolite or DMSO control (3.0 μL) to the respective cell culture condition.
Media B is used for enrichment of glycoproteins from the conditioned media. If the cell type is extremely sensitive to Media B, this incubation period may be shortened. Incubate the twelve tissue culture dishes for an additional 48 h at 37 °C in a humidified 5% CO2 incubator.
-
-
For suspension cells:
Treat two T-150 tissue culture flasks with 100 μM of sugar metabolite (10.0 μL of 500 mM stock solution).
Treat an additional two tissue culture flasks with DMSO (10.0 μL) as a control.
Add a suspension of cells to the tissue culture flask in Media A (50 mL, 2 × 10⁵ cells/mL).
Incubate the four tissue culture flasks for 48 h at 37 °C in a humidified 5% CO2 incubator.
Transfer the suspension cells and media from each flask to separate centrifuge tubes and pellet the cells (300 g, 3 min).
-
Aspirate the media, wash the cell pellet by resuspension with PBS (10 mL), and pellet the cells (300 g, 3 min).
For sole analysis of cellular and membrane incorporation, the current incubation period is sufficient and the user may skip to Preparation of Cell Lysates. Resuspend the cell pellet in Media B (50 mL). Add 100 μM of sugar metabolite or DMSO control (10.0 μL) to the respective cell culture condition. Transfer the resuspended cells to four T-150 tissue culture flasks.
Incubate the four tissue culture flasks for an additional 48 h at 37 °C in a humidified 5% CO2 incubator.
Preparation of the Conditioned Media
-
9
Collect the conditioned media by transferring the conditioned media to centrifuge tubes.
For adherent cell types, pipet conditioned media to centrifuge tubes. Then, wash the cell culture plate with PBS (2 mL per plate) and combine the PBS with the conditioned media in the centrifuge tubes.
For suspension cell types, pellet the cells and transfer the conditioned media to a separate 50 mL centrifuge tube for each flask.
-
10
Clear the conditioned media by centrifugation (150 g, 3 min).
-
11
Transfer the conditioned media to a 10 kDa 15 mL Amicon spin filter, and repetitively spin concentrate the clarified media to a final volume of 500 μL (3700 g, 15–30 min per spin, approximately five spins required). Discard the flow through appropriately.
All conditioned media fractions should be combined and concentrated at the conclusion of this step. -
12
Wash the concentrated proteins with 0.1% triton X-100 in PBS (3 × 15 mL) by centrifugal filtration (3700 g, 15–30 min) to remove excess labeling reagent.
Washing should be continued if the eluent is colored (e.g., pale pink eluent) after three washes. The filter should retain a viscous, translucent solution. -
13
Transfer the residue to a 2 mL microcentrifuge tube as the “conditioned media fraction.”
The concentrated conditioned media may be stored for at least 12 months at –80 °C.
Preparation of the Cell Lysates
Alternate lysis protocols (e.g., RIPA buffer, high-salt extraction) are compatible with downstream enrichment and MS, with the exception of protocols using MS incompatible detergents (e.g., sodium dodecyl sulfate, SDS) or ethylenediaminetetraacetic acid (EDTA). A lysis protocol with cellular fractionation is used as representative.
-
14
Collect the cells in a 50 mL centrifugal tube.
For adherent cells, trypsinize with EDTA-free trypsin (3 mL per tissue culture plate) for 5 min at 37 °C. Collect and pellet the cells (300 g, 3 min). Wash the pelleted cells with PBS (10 mL).
-
For suspension cells, collect and pellet the cells. Wash the pelleted cells with PBS (10 mL).
The cell pellet may be flash frozen, and stored for at least 12 months at –80 °C.
-
15
Resuspend the cell pellet in ice-cold lysis buffer (500 μL) and transfer to a Dounce homogenizer.
-
16
Swell the pellet for 5 min on ice, and break by Dounce homogenization using a tight glass hand pestle (30 strokes).
-
17
Transfer the homogenized lysate to a centrifuge tube, and pellet insoluble proteins by centrifugation (3700 g, 10 min, 4 °C).
-
18
Collect the supernatant as the “soluble fraction”. Add 10% RapiGest (50 μL) and sonicate the sample in an ice bath with the probe tip sonicator.
Sonication conditions should be determined based on cell type and sonicator (for Misonix sonicator: 5 min, 10 s on, 5 s off, power control at 0.5). -
19
Suspend the insoluble proteins from Step 17 in 1% RapiGest/PBS (500 μL) as the “insoluble fraction.” Sonicate the sample in an ice bath briefly with the probe tip sonicator.
The insoluble proteins will turn translucent, indicative of solubilization after sufficient sonication. -
20
Measure the protein concentration of the three fractions (conditioned media, soluble, and insoluble) by bicinchonic acid assay, and normalize protein concentration to 5.5 mg/mL.
If a protein concentration lower than 5.5 mg/mL as measured by BCA assay is obtained, normalize to the lower value and adjust volumes used in PROTOCOL 2 accordingly.
PROTOCOL 2. Chemical Glycoproteomics Enrichment Procedure
This protocol details the isotopic tagging and chemical enrichment of metabolically labeled glycoproteins. Glycoproteins carrying a bioorthogonal handle are selectively reacted with the IsoTaG probe and enriched for intact glycoproteomics. Considerations during this protocol include: efficiency of metabolic labeling in PROTOCOL 1, efficiency of the copper–catalyzed azide–alkyne coupling (CuAAC), and efficiency of enrichment and glycopeptide recovery. A Western blot serves to report on all three considerations as detailed at the conclusion of PROTOCOL 2. Metabolic labeling efficiency will depend on the success of PROTOCOL 1, and protein inputs should be adjusted accordingly. Typically, protein inputs of 1–3 mg for tissue culture cell lysates are appropriate, although inputs as low as 500 μg have been demonstrated with this method. The efficiency of CuAAC is highly dependent on the water solubility of the CuAAC ligand used. The protocol detailed herein uses BTTP; however, a commercially-available water-soluble CuAAC ligand may be substituted. Tagging efficiency may be optimized by modulation of the reaction time or reagent loading. Reagent loadings may also be scaled to increase labeling or decrease off-target background during optimization. Finally, enrichment and probe cleavage are evaluated by Western blot, and will be affected by bead loading during capture and efficiency of the buffer exchange prior to treatment of the beads with acid for cleavage of the probe. The protocols reported herein are effective in the isotopic coding and enrichment of greater than 15 cell lines.
Materials
Phosphate-buffered saline (PBS, pH 7.4, Life Technologies)
Dimethylsulfoxide (DMSO, C2H6OS, Sigma Aldrich)
Methanol (MeOH, CH3OH, LC/MS grade, Sigma Aldrich)
-
Click chemistry reagents
IsoTaG alkynyl biotin probe, (10 mM stock in DMSO, see SUPPORTING PROTOCOL 1)
IsoTaG azido biotin probe, (10 mM stock in DMSO, see SUPPORTING PROTOCOL 2)
Copper(II) sulfate pentahydrate (CuSO4•5H2O, 50 mM stock in water, Sigma Aldrich)
3-(4-((bis((1-tert-butyl-1H-1,2,3-triazol-4-yl)methyl)amino)methyl)-1H-1,2,3,triazol-1-yl)propanol [BTTP, 30 mM stock in DMSO, prepared according to the procedure of Wang and co-workers (Wang et al., 2011)]
Sodium ascorbate (C6H7NaO6, 100 mM fresh stock in PBS, Sigma Aldrich)
Eppendorf rotator
Streptavidin–agarose (50% slurry, Pierce)
RapiGest (10% stock in PBS, Waters)
Urea (CH4N2O, 6 M fresh stock in water, Sigma Aldrich)
Dithiothreitol (DTT, C4H10O2S2, 100 mM fresh stock in PBS, Sigma Aldrich)
Iodoacetamide (C2H4INO, 500 mM fresh stock in PBS, Sigma Aldrich)
Trypsin (sequencing grade, Pierce)
Formic acid (CH2O2, LC/MS grade, Pierce)
Acetonitrile (CH3CN, LC/MS grade, Pierce)
Water (MilliQ filtered, generated in house)
ZipTip P10 tips (Millipore)
Low-bind microcentrifuge tubes (1.5 mL, Eppendorf)
Low-bind microcentrifuge tubes (500 μL, Eppendorf)
–80 °C refrigerator
Incubator (37 °C)
Speedvac
-
Western blot
4–12% Criterion XT Bis-Tris gel (26 well, Bio-Rad)
Loading buffer
Electrophoresis chamber
MES SDS running buffer (20×, Life Technologies)
Western blot chamber
Western blot cassette
Nitrocellulose membranes (Life Technologies)
Tris/glycine transfer buffer (10×, Bio-Rad)
Bovine serum albumin (BSA, Sigma Aldrich)
Ponceau stain (see recipe)
High sensitivity streptavidin–HRP (Pierce)
Super Signal West Pico Chemiluminescence Substrate (Thermo Scientific)
X-Ray developer (Kodak)
Tag Glycoproteins with Click Chemistry
-
Prepare 3.0 mg of metabolically labeled cell lysates per sample in buffer (550 μL) and transfer to a 1.5 mL microcentrifuge tube.
Sample volumes and protein material may be adjusted accordingly. In this protocol, a volume of 550 μL and 3.0 mg protein is used to demonstrate the method. -
Calculate the amount of Click chemistry reagents needed to tag the lysates, for a final concentration of 200 μM IsoTaG probe (11.0 μL), 300 μM copper sulfate (3.3 μL), 600 μM BTTP (11.0 μL), and 2.5 mM sodium ascorbate (13.8 μL).
If azido-sugar labeled cell lysates were prepared, use the IsoTaG alkynyl biotin probe.If alkynyl-sugar labeled cell lysates were prepared, use the IsoTaG azido biotin probe. -
Premix the reagents by combining the IsoTaG probe, copper sulfate, and BTTP in sequence in a 1.5 mL microcentrifuge tube. Vortex the reagent mixture and centrifuge briefly to collect liquid at the bottom of the tube. Add sodium ascorbate, vortex, and centrifuge briefly to collect liquid at the bottom of the tube.
A viscous pale blue solution will form and turn clear after addition of sodium ascorbate. Add the reagent mixture (39.1 μL) to the cell lysates and incubate the mixture with rotation at ambient temperature for 3 h.
Add methanol (1 mL) and precipitate the proteins for 1 h at –80 °C.
-
Pellet the precipitated proteins by centrifugation (16,100 g, 10 min, 4 °C).
A white protein pellet will form at the bottom of the centrifuge tube. Discard the methanol supernatant and allow the protein pellet to air dry for 10 min at ambient temperature.
Enrich for Tagged Glycoproteins
-
8
Resuspend the dried pellet in 1% RapiGest in PBS (400 μL).
-
9
Solubilize the proteins by brief sonication with a probe tip sonicator. Save an aliquot (10 μL, “load”) for analysis by Western blot.
A clear solution will result, indicating a fully solubilized pellet. -
10
Wash the streptavidin–agarose resin (200 μL of slurry per sample) with PBS (3 × 1 mL) by either vacuum filtration or centrifugal force (3000 g, 3 min). Resuspend the slurry with PBS (200 μL) and add the slurry to the solubilized proteins.
If Western blot analysis indicates incomplete capture of biotinylated proteins, increase slurry amount in future. -
11
Incubate the resulting mixture for 12 h at ambient temperature with rotation.
-
12
Pellet the beads by centrifugation (3000 g, 3 min).
-
13
Separate the supernatant. Save an aliquot (10 μL, “supernatant”) for analysis by Western Blot.
-
14
Wash the beads with 1% RapiGest (1 mL), 6 M urea (2 × 1 mL), and PBS (2 × 1 mL) in succession. Pellet the beads by centrifugation (3000 g, 3 min) between washes, and discard the wash.
Stringency of washing may be increased (e.g., 8 M urea washes) if high protein background is observed by MS or Western blot. -
15
Resuspend the washed beads in PBS (200 μL). Save an aliquot (10 μL, “capture”) of the slurry for analysis by Western blot.
On Bead Trypsin Digestion of Enriched Glycoproteins
-
16
Reduce proteins on bead by addition of 5 mM DTT (10 μL). Incubate for 30 min at ambient temperature with rotation.
-
17
Alkylate proteins on bead by addition of 10 mM iodoacetamide (4.0 μL). Incubate in the dark for 30 min at ambient temperature with rotation.
-
18
Pellet the beads by centrifugation (3000 g, 3 min) and wash once with PBS (1 mL).
-
19
Resuspend the washed beads in 0.5 M urea (20 μL of 6 M stock) in PBS (200 μL).
-
20
Resuspend an aliquot of trypsin (20.0 μg) in buffer (40.0 μL).
Alternate proteases (e.g., chymotrypsin, endoproteinase GluC) are also compatible with this protocol and may be used to increase glycopeptide coverage. -
21
Add 1.5 μg of trypsin (3.0 μL) to the slurry of beads. Incubate the resulting mixture for 12 h at 37 °C with rotation.
Store unused trypsin at –80 °C for use within 3 months of resuspension. -
22
Pellet the beads by centrifugation (3000 g, 3 min), and collect the supernatant digest.
-
23
Wash the beads with PBS (200 μL) and water (2 × 200 μL) in succession. Combine the washes with the supernatant digest to form the “trypsin fraction”.
-
24
Concentrate the “trypsin fraction” to dryness using a speedvac set to 40 °C.
The “trypsin fraction” may be stored for at least 12 months at –80 °C.
Cleavage and Recovery of Glycopeptides
-
25
Cleave the probe by addition of 2% formic acid–H2O (200 μL) to the beads and incubate for 30 min at ambient temperature with rotation.
-
26
Pellet the beads by centrifugation (3000 g, 3 min), and collect the supernatant. Repeat the cleavage, Step 25.
-
27
Wash the beads with 50% acetonitrile–water + 1% formic acid (2 × 400 μL). Combine the washes with the cleaved supernatant to form the “cleavage fraction”.
-
28
Concentrate the “cleavage fraction” to dryness using a Speedvac heated to 40 °C. Store at –20 °C until desalting and MS analysis.
For long term storage, the “cleavage fraction” may be stored for at least 12 months at –80 °C.
Desalting Trypsin and Cleavage Fractions
-
29
Resuspend the dried “trypsin fraction” and “cleavage fraction” in 1% formic acid in water (50.0 μL). Gently vortex the sample and briefly centrifuge to collect all liquid at the bottom.
-
30
Desalt the sample using a ZipTip C18 P10 tip. Briefly,
Wet the tip with LC/MS grade methanol by pipetting three times.
Equilibrate with 1% formic acid in water by pipetting three times.
-
Load the peptides by pipetting the sample 10–15 times.
Carefully pipette the sample such that air bubbles do not pass through the C18 tip. Air bubbles decrease loading capacity. Wash the pipette tip with 1% formic acid in water (50 μL) and discard the eluent.
Elute the peptides with 50% acetonitrile–water + 1% formic acid (2 × 50 μL).
-
Concentrate the sample using a speedvac heated to 40 °C. Store at –20 °C until analysis by LC/MS.
A barely visible, or not visible, residue will remain after drying. For long term storage, the desalted samples may be stored for at least 12 months at –80 °C.
Western Blot Analysis of Enrichment Efficiency
-
Add 3.0 μL of Western blot loading buffer to each saved aliquot (load, supernatant, capture, 10.0 μL each).
A total of 18 aliquots should have been collected, from each fraction of the cells (conditioned media, soluble, and insoluble), and the equivalent DMSO samples. -
Boil the aliquot “capture” for 5 min at 95 °C.
Boiling the beads will release the captured glycoproteins from the bead for analysis by Western blot. Other samples may be boiled at the discretion of the user. Load the 18 aliquots to a 4–12% Bis-Tris gel.
Separate the proteins using SDS-PAGE conditions (180 V, 40 min, ambient temperature).
Transfer the separated proteins by electroblotting onto nitrocellulose (100 V, 60 min, 4 °C).
-
Ponceau stain the nitrocellulose membrane to visualize equal protein loading. Briefly,
Add ponceau solution to cover the membrane.
Incubate with gentle shaking for 5 min.
-
Recover the ponceau stain.
Ponceau stain may be reused for at least two months. Wash the membrane with water to remove excess ponceau.
Image the ponceau stained membrane.
Block the membrane with 5% BSA with 0.1% Tween-20 in PBS for 1 h at ambient temperature with gentle shaking.
Stain the blot with streptavidin–HRP (1:100,000) in 5% BSA with 0.1% Tween-20 in PBS for 30 min at ambient temperature with gentle shaking.
Wash the blot with 0.1% Tween-20 in PBS for 15 min at ambient temperature with gentle shaking. Repeat two times.
-
Develop the blot with chemiluminescent reagents (5 min) and image using a developer.
Using SuperSignal West Pico Chemiluminescent Substrate a signal is typically observed within 15 s–1 min exposure time. A strong signal from the “load” and “capture” lanes should be observed, with depleted signal in the “supernatant” lanes, and little to no signal in all the DMSO control lanes. Signal from the “capture” lane directly correlates with glycopeptide signal intensity in LC/MS.
PROTOCOL 3: Mass-independent Mass Spectrometry
In PROTOCOL 3 a procedure for mass-independent mass spectrometry is detailed for the “cleavage fraction”. The “trypsin fraction” may be evaluated by a standard shotgun proteomics methodology (not detailed herein). A major advantage to this approach is the ability to direct analyses to isotopically recoded glycopeptides in a full scan MS. To capitalize on isotope targeting, a nano liquid chromatograph, with reproducible elution profiles, connected in-line to a high resolution Thermo Orbitrap mass spectrometer is required for successful results. Reproducibility of elution profiles should be ensured prior to IsoTaG analysis. For best results, manual validation of confidently assigned glycopeptide spectra should be performed alongside targeted analyses of fragmentation spectra derived from isotopically recoded glycopeptides.
Materials
-
LC/MS Analysis
LTQ Orbitrap (XL or newer, Thermo)
NanoLC system (Dionex Ultimate3000 or Easy Nano 1000, Thermo)
Acetonitrile (Optima grade, Fisher)
Formic acid (1 mL ampules, Thermo Pierce)
Water (MilliQ filtered, obtained in house)
C18 analytical column (Acclaim® PepMap 300, 150 mm length × 0.075 mm inner diameter, 5 μm particles, 300 Å pores, Thermo)
Autosampler vials (Polypropylene, Agilent)
Septa caps (Agilent)
-
Computational Analysis
PC Computer
ReAdW.exe or MSConvert (ProteoWizard)
XCalibur (Thermo)
Proteome Discoverer with SEQUEST (Thermo)
Byonic (Protein Metrics)
Isotopic Signature Transfer an Mass Pattern Prediction (IsoStamp, Bertozzi lab)
Collect a Scouting Run
Resuspend desalted samples in water + 0.1% formic acid (15 μL). Vortex and centrifuge samples, and transfer the solution to polypropylene autosampler vials with septa caps.
-
Set up the Thermo LTQ Orbitrap mass spectrometer to collect a scouting run.
A sufficient number of profile mode (resolution = 60,000) full scan spectra should be collected in the scouting run. However, care should be taken that the MS file is not greater than 2.0 gb for ease of file handling. Recommended method for an Orbitrap XL: scouting run consisting of only full scan MS. Recommended method for an Orbitrap Elite: scouting run with four tandem MS events inserted between each full scan event. -
Analyze samples by injection of 1 μL to a nano liquid chromatograph equipped with a C18 analytical column connected in-line with a Thermo LTQ-–Orbitrap.
Recommended liquid chromatography gradient: isocratic flow at 2% acetonitrile–water + 0.1% formic acid for 4 min, a linear gradient to 50% acetonitrile–water + 0.1% formic acid over 98 min, isocratic flow at 95% acetonitrile–water + 0.1% formic acid for 6 min, and isocratic flow at 2% acetonitrile–water + 0.1% formic acid for 12 min, at a flow rate of 300 nL/min.Recommended LTQ–Orbitrap settings: Acquire full-scan mass spectra in the positive ion mode over the range m/z = 400 to 1800 using the Orbitrap mass analyzer, in profile format, with a mass resolution setting of 60,000 (at m/z = 400, measured at full width at half-maximum peak height, FWHM).
Generate an Inclusion List with the IsoStamp Algorithm
-
4
Convert the RAW file to mzXML in centroided form using ReAdW.exe or MS Convert (a part of the ProteoWizard software package).
Conversion of the file to centroided form gives the best results. Due to discrepancies between mzXML file conversion software, we recommend only ReAdW or MSConvert. -
5
Create a parameters file using the template available at bertozzigroup.stanford.edu/isostamp.
Default parameter file is for a dibromine tagged glycopeptide using the averagine model to predict the isotopic distribution of the “average” peptide. Data must be processed with the correct parameters file (see Critical Parameters). -
6
Generate an inclusion lists using the IsoStamp algorithm (bertozzigroup.stanford.edu/isostamp).
IsoStamp is a pattern searching algorithm. IsoStamp searches the full scan MS (MS1) data of the scouting run for isotopically recoded glycopeptides. IsoStamp is available as a stand-alone Windows executable or as a web application. -
7
Using the output from [yourfile]_chart.txt, verify that the scouting run contains istope-recoded patterns and determine at what score cutoff the pattern matches become false positives. Verify that [yourfile]_massspec.csv has a suitable number of entries and over the appropriate time frame.
Typically a score below zero constitutes a false positive. The IsoStamp algorithm will produce several files including [yourfile]_summary.txt, [yourfile]_massspec.csv, [yourfile]_chart.txt. If the file contains tandem MS spectra, the algorithm will additionally produce files from the MS2Filter (see below).
Collect an Include List Directed Run
-
8
Set up the LTQ Orbitrap mass spectrometer to collect an include list directed run.
Enable global parent mass lists and add [yourfile]_massspec.csv to the list. To adjust for the broader width of the pattern, we recommend the following specific parameters: isolation width = 4 Da, exclusion mass width = ±1.5 Da, and selection from list with a 50 ppm mass tolerance. Recommended tandem MS events include HCD, ETD, and/or CID MS2/MS3. -
9
Collect the include list directed run by injection of 1 μL to a nano liquid chromatograph equipped with a C18 analytical column connected in-line with a LTQ Orbitrap.
With an LTQ Orbitrap XL a four-fold increase in patterned species selection using the include list over data dependent acquisition was observed.
Optional: Use MS2 Filter, a Component of IsoStamp, to Filter Tandem MS Data for Patterned Species
-
10
Convert the RAW file to mzXML in centroided form using ReAdW.exe or MS Convert (a part of the ProteoWizard software package).
-
11
Using the parameters file for generation of the include list, and add expected masses related to the neutral or charged loss of the glycan fragmentation from the peptide. Run the IsoStamp algorithm.
The pattern matching and fragments will be used to filter tandem MS spectra for those spectra derived from patterned species, and are thus likely glycopeptides. If using CID or HCD, glycopeptides will fragment along the glycan backbone first. Thus, expected fragments include: ± HexNAz* (the modified metabolically labeled glycan), ± Hex, ± HexNAc, and so on. Addition of both positive and negative ions to the fragment list signals the algorithm to search for both the fragment ion and neutral or charged loss ion. See Critical Parameters for more information. -
12
Use [yourfile]_filtered.mzXML for subsequent database searches and glycopeptide validation steps. Use [yourfile]_log.txt or [yourfile]_log2.txt for rapid assessment of scoring parameters to pass filter devices.
Tandem MS relevant files produced by the MS2Filter include: [yourfile]_filtered.mzXML, [yourfile]_log.txt, and [yourfile]_log2.txt. [yourfile]_filtered.mzXML may be used as input for database searching with Proteome Discoverer 1.4. See Critical Parameters for more information.
Targeted Database Analysis
Filter Spectra for Targeted Analysis
-
13
Search the RAW data against the appropriate proteome using database analysis software. In this protocol, Proteome Discoverer 1.4, with SEQUEST HT and Byonic v2.0 search engines are used to demonstrate the method.
Add common fixed modifications (i.e., carboxyamidomethylcysteine, +57.021 Da). Add common variable modifications, including methionine oxidation (+15.995 Da), HexNAc (+203.079 Da), and the most abundant isotope of HexNAz*. The abundant isotopes of modified tagged sugars used in this protocol include HexNAzBr2OH, C15H20Br2N4O7, +527.968 Da; NeuAzBr2OH C18H24Br2N4O10, +615.984 Da; NeuAlBr2OH, C21H30Br2N4O10, +658.031. -
14
Separately search [yourfile]_filtered.mzXML with the same parameters.
-
15
Screen tandem MS data for glycopeptide signifiers, including the isotopically recoded precursor ion in full-scan MS (MS1) spectra, and neutral or charged glycan losses in MS2. Document and save tandem MS spectra for further analysis. Use the MS2filter output [yourfile]_filtered.mzXML as a guide for isotopically recoded precursors.
Using data from an Orbitrap XL, [yourfile]_filtered.mzXML is able to remove approximately 70% of spectra that do not derive from glycopeptides. Selectivity is modulated largely by fragment filters (see Critical Parameters).
Targeted Analysis of Saved Spectra
-
16
Search saved spectra iteratively using the Byonic search algorithm v2.0 as a node in Proteome Discoverer. In the first iteration, search for N- and O-glycans structures that may be the most prevalent in the sample.
Byonic recognizes the modified glycan “HexNAzBr2OH” and “NeuAzBr2OH” as described in this protocol (e.g., HexNAzBr2OH(1) @ OGlycan | common1). -
17
In the second iteration, sort spectra by glycan type based on fragment ions and search using a focused glycan database.
-
18
For spectra that remain low confidence assignments, manually annotate saved spectra for glycan structure and peptide mass, and for similarities to assigned spectra (i.e., characteristic peptide fragment ions). Perform a targeted Byonic search with variable modification on the specific glycoform.
Narrowing subsequent database searches to specific glycoforms or glycan types (e.g., N-glycan or O-glycan) increases confident glycopeptide assignment. -
19
Inspect confident matches for validity and compile a final list of assigned intact glycopeptides.
All glycopeptide matches are validated for isotopic pattern, exact mass (Δmass = <5 ppm), expected glycan fragments, and expected peptide fragments.
Reagents and Solutions
Use Milli-Q filtered water for all solutions
Media A: Recommended base medium (e.g. DMEM or RPMI 1640), 10% fetal bovine serum, 1% penicillin/streptomycin, 100 μM sugar precursor.
Media B: Recommended base medium, 1% penicillin/streptomycin, 100 μM sugar precursor.
Lysis buffer: 10 mM HEPES, pH 7.9, 1.5 mM MgCl2, 10 mM KCl, 0.5% triton X-100, 1 × protease inhibitors, 1 μM thiamet G.
Ponceau stain: 0.1% ponceau (w/w), 5% acetic acid (v/v), in water.
Supporting Protocol 1: Synthesis of the IsoTaG Alkynyl Biotin Probe
Synthesis of the IsoTaG Alkynyl Biotin Probe is prepared according to the procedure of Woo, C.M. and co-workers (Woo et al., 2015); the procedure is described in detail below.
Materials
Propargyl bromide (C3H3Br, 80% in toluene, Sigma Aldrich)
(E)-2,3-dibromobut-2-ene-1,4-diol (C4H6Br2O2, Sigma Aldrich)
Potassium hydroxide (KOH, Sigma Aldrich)
N,N-Dimethylformamide (DMF, Sigma Aldrich)
Water (H2O, deionized on site)
Triethylamine (C6H15N, distilled over calcium hydride, Sigma Aldrich)
Dichlorodiphenylsilane [(C6H5)2SiCl2, Sigma Aldrich]
Biotin–CA(PEG)4–alcohol [C25H46N4O8S, prepared in house according to the procedure of Szychowski and co-workers (Szychowski et al., 2010)]
Sodium bicarbonate (NaHCO3, Sigma Aldrich)
Dichloromethane (CH2Cl2, Sigma Aldrich)
Ethyl acetate (EtOAc, C4H8O2, Sigma Aldrich)
Hexanes (C6H14, Sigma Aldrich)
Rotovap
Column chromatography
Silica (60 Å, Silicycle)
Synthesis of (E)-2,3-Dibromo-4-(prop-2-yn-1-yloxy)but-2-en-1-ol
Figure 6. Synthesis of (E)-2,3-dibromo-4-(prop-2-yn-1-yloxy)but-2-en-1-ol.
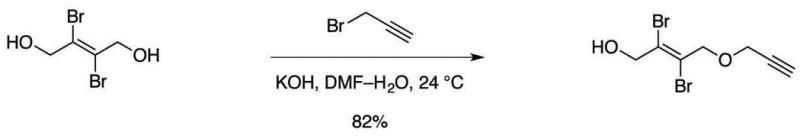
Add propargyl bromide (1.25 mL, 11.6 mmol, 1 equiv) to a stirred solution of (E)-2,3-dibromobut-2-ene-1,4-diol (8.56 g, 34.8 mmol, 3.00 equiv) and potassium hydroxide (1.30 g, 23.2 mmol, 2.00 equiv) in 50% N,N-dimethylformamide–water (30 mL) at ambient temperature (22–25 °C).
Stir the resulting mixture for 12 h at ambient temperature (22–25 °C).
Quench the reaction by rotovapping the solution to dryness.
Purify the crude product mixture by flash-column chromatography (eluting with 25% ethyl acetate–hexanes, grading to 100% ethyl acetate, one step) to afford (E)-2,3-dibromo-4-(prop-2-yn-1-yloxy)but-2-en-1-ol as a white solid (2.69 g, 82%).
Synthesis of the IsoTaG Alkynyl Biotin Probe
Figure 7. Synthesis of the IsoTaG alkynyl biotin probe.
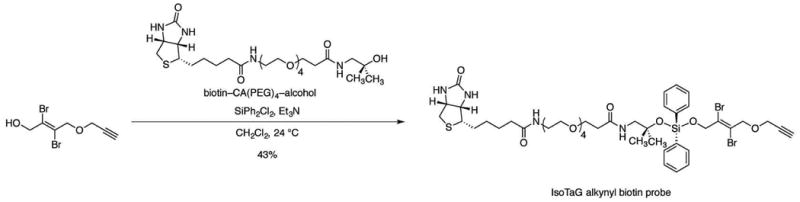
Add triethylamine (43.2 μL, 312 μmol, 9.00 equiv) and dichlorodiphenylsilane (21.9 μL, 104 μmol, 3.00 equiv) in sequence to a stirred solution of the biotin–CA(PEG)4–alcohol (19.5 mg, 34.6 μmol, 1 equiv) in dichloromethane (690 μL) at ambient temperature.
Stir the resulting solution for 2 h at ambient temperature (22–25 °C).
Add (E)-2,3-dibromo-4-(prop-2-yn-1-yloxy)but-2-en-1-ol (59.0 mg, 208 μmol, 6.00 equiv) to the stirred solution at ambient temperature (22–25 °C).
Stir the resulting solution for an additional 1 h at ambient temperature (22–25 °C).
Quench the product mixture by sequential dilution with dichloromethane (10 mL) and saturated aqueous sodium bicarbonate solution (10 mL).
Separate the resulting biphasic mixture. Extract the aqueous layer with dichloromethane (3 × 10 mL).
Combine the organic layers, and dry the combined layers over sodium sulfate.
Filter the dried solution, and concentrate the filtrate by rotovap.
-
Purify the crude product mixture by flash-column chromatography (eluting with 1% methanol–dichloromethane, grading to 10% methanol–dichloromethane, 3 steps) to afford the IsoTaG alkynyl biotin probe as a clear oil (15.4 mg, 43%).
NMR spectra and mass spectrometry reference data are available at (Woo et al., 2015).
Supporting Protocol 2: Synthesis of the IsoTaG Azido Biotin Probe
Materials
3-azidopropyl 4-methylbenzenesulfonate [C10H13N3O3S, synthesized in house according to the procedure of Phetsang and coworkers(Phetsang et al., 2014)]
(E)-2,3-dibromobut-2-ene-1,4-diol (C4H6Br2O2, Sigma Aldrich)
Potassium hydroxide (KOH, Sigma Aldrich)
N,N-Dimethylformamide (DMF, Sigma Aldrich)
Water (H2O, deionized on site)
Triethylamine (C6H15N, distilled over calcium hydride, Sigma Aldrich)
Dichlorodiphenylsilane [(C6H5)2SiCl2, Sigma Aldrich]
Biotin–CA(PEG)4–alcohol [C25H46N4O8S, prepared in house according to the procedure of Szychowski and co-workers(Szychowski et al., 2010)]
Sodium bicarbonate (NaHCO3, Sigma Aldrich)
Dichloromethane (CH2Cl2, Sigma Aldrich)
Ethyl acetate (EtOAc, C4H8O2, Sigma Aldrich)
Hexanes (C6H14, Sigma Aldrich)
Rotovap
Column chromatography
Silica (60 Å, Silicycle)
Synthesis of (E)-4-(3-azidopropoxy)-2,3-dibromobut-2-en-1-ol
Figure 8. Synthesis of (E)-4-(3-azidopropoxy)-2,3-dibromobut-2-en-1-ol.
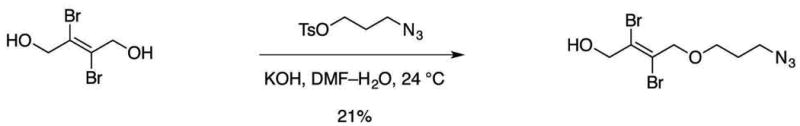
Add 3-azidopropyl 4-methylbenzenesulfonate (400 mg, 1.57 mmol, 1 equiv) to a stirred solution of (E)-2,3-dibromobut-2-ene-1,4-diol (1.10 g, 4.70 mmol, 3.00 equiv) and potassium hydroxide (176 mg, 3.13 mmol, 2.00 equiv) in 75% N,N-dimethylformamide–water (4.0 mL) at ambient temperature (22–25 °C).
Stir the resulting mixture for 3 h at 50 °C.
Quench the reaction by rotovapping the solution to dryness.
Purify the crude product mixture by flash-column chromatography (eluting with 20% ethyl acetate–hexanes) to afford (E)-4-(3-azidopropoxy)-2,3-dibromobut-2-en-1-ol as a white solid (107 mg, 21%).
Synthesis of the IsoTaG Azido Biotin Probe
Figure 9. Synthesis of the IsoTaG azido biotin probe.
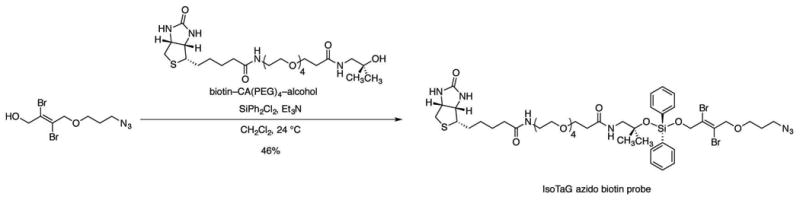
Add triethylamine (69.0 μL, 501 μmol, 20.0 equiv) and dichlorodiphenylsilane (26.4 μL, 125 μmol, 5.00 equiv) in sequence to a stirred solution of the biotin–CA(PEG)4–alcohol (14.1 mg, 25.1 μmol, 1 equiv) in dichloromethane (500 μL) at ambient temperature (22–25 °C).
Stir the resulting solution for 2 h at ambient temperature (22–25 °C).
Add (E)-4-(3-azidopropoxy)-2,3-dibromobut-2-en-1-ol (165 mg, 501 μmol, 20.0 equiv) to the stirred solution at ambient temperature (22–25 °C).
Stir the resulting solution for an additional 1 h at ambient temperature (22–25 °C).
Quench the product mixture by sequential dilution with dichloromethane (10 mL) and saturated aqueous sodium bicarbonate solution (10 mL).
Separate the resulting biphasic mixture. Extract the aqueous layer with dichloromethane (3 × 10 mL).
Combine and the organic layers, and dry the combined layers over sodium sulfate.
Filter the dried solution, and concentrate the filtrate.
Purify the crude product mixture by flash-column chromatography (eluting with 1% methanol–dichloromethane, grading to 10% methanol–dichloromethane, 3 steps) to afford the IsoTaG azido biotin probe as a clear oil (12.3 mg, 46%).
Commentary
Background Information
Metabolic labeling of the glycoproteome is a widely used and effective technique to install a chemical handle for glycoprotein detection and enrichment (Boyce et al., 2011; Hubbard et al., 2011; Zaro et al., 2011). However, due to the complexity and non-templated nature of the glycoproteome, site identification and glycan structural information have been difficult to obtain without a directed approach. Isotope recoding is a chemically directed proteomics technique that enables immediate recognition of a tagged species in a full scan mass spectrum. The technique utilizes an isotopic perturbation, achieved through a dibrominated chemical tag (Palaniappan et al., 2011), or by metabolic labeling with an isotopically recoded glycan (Breidenbach et al., 2012), which is readily detected with high sensitivity and fidelity using the IsoStamp algorithm. By imprinting species with a glycopeptide specific pattern, targeted data analyses may be performed with the a priori knowledge that the species is a glycopeptide. Such knowledge enables confident characterization of modified species that are not within the predicted protein database, such as glycan PTMs and peptide sequence polymorphisms (pSPs) (Woo et al., 2015).
The challenge of confident assignment by database searching has necessitated simplification of the database by either reduction of the glycan [e.g., truncation of the glycan in a complex proteome (Steentoft et al., 2011; Zielinska et al.)], or reduction of the proteome [e.g., glycoprotein immunoprecipitation (Song et al., 2015; Song et al., 2014)]. Methods to survey the intact glycoproteome from complex samples are assisted by advances in MS methods and database searching (Medzihradszky et al., 2015; Trinidad et al., 2013; Wu et al., 2014). IsoTaG addresses this challenge by enabling identification of glycopeptide species prior to database assignment.
Critical Parameters
To successfully characterize intact glycopeptides, it is critical to prepare samples with metabolically labeled glycoproteins that can be tagged by the IsoTaG probe. As described, the copper–click reaction proceeds efficiently in cell lysates and conditioned media. However, when the concentration of labeled glycoproteins is extremely low (e.g., conditioned media in the presence of FBS), selective reactivity becomes difficult. If tagging does not proceed, a prefractionation, abundant protein depletion, or alternate enrichment method is required. The signal from Western blot analysis as described is typically directly correlative with results obtained by LC/MS.
Optimization of the IsoStamp parameters files is also preferable for best results. The parameters file delineates filters and scoring mechanisms for two components of IsoStamp: TagFinder and MS2Filter.
Components of the parameters file and recommended use
-
PatternMatching: The filter that defines the isotope pattern, and parsing of MS data search space.
BasePattern: Underlying expected mass distribution. Defaulted to that of a peptide.
TagPattern: Desired pattern encoded within the tag spaced by Da. Defaulted to dibromide.
iMinimumCharge/iMaximumCharge: The charge states for tagged molecule searching.
iScansPerBundle: Grouping of MS scans together for increased S/N during pattern matching. Defaulted to 20 scans.
iBundlePhases: Number of phase offsets that TagFinder will produce iScansPerBundle. Used to reduce false positives due to improper bundling.
iScansPerMessage: A message printed to the user to show program progress.
fMaximumMassToChargeError: Acceptable mass error for m/z spacing in Da.
iBlurStep: Degree of accuracy used in internal optimizations. Default to 25.
fLargeMassThreshold: Species with a larger mass (e.g., N-glycopeptides) than this value are not penalized for similarities to untagged species. This attempts to account for dilution of the pattern in larger species (e.g., Da > 7,000). If set to 0, this feature is off.
-
MatchFilter: The TagFinder filter parses out patterned peak groups, for scoring and removes other groups from bundled MS data.
fMaximumError: Matches with a linear error greater than 0.85 will be filtered out.
fMaximumOptimisticError: Matches with an optimistic linear error greater than 0.8 will be filtered out.
fMaximumMSQR: Matches with normalized mean squared error greater than 0.85 will be filtered out.
fMaximumNoise: Matches with the ratio of background noise to match intensity exceeding 2.5 will be filtered out.
fMinimumScore: Matches with a score below –20.0 will be filtered out.
fMinimumPatternAmplitude: Matches with an intensity less than 10,000 will be filtered out.
-
TandemFilter: MS2Filter parameters for filtering tandem MS for expected pattern and fragments related to glycopeptides. Tandem filter will only screen MS2 spectra and keep any associated MS3 spectra.
TagMasses: Masses of expected neutral loss fragments. If a positive value, the filter will search for the presence of the charged fragment. If a negative value, the filter will search for the presence of a fragment caused by neutral or charged loss from the precursor mass. The more values entered here, the more generous the filter will be for glycopeptides at the expense of a higher false positive rate.
fMaximumPrecursorMZ_Error: Fragment mass tolerance toggled for tandem MS data collected at high or low resolution, in Da.
fMaximumMS2_MassFraction: The tag fragment intensity must have a minimum fraction of all peaks. Serves to eliminate noise. Defaulted to 0.005.
iMinimumFragmentCharge/iMaximumFragmentCharge: Tag mass and neutral/charged loss charge states for evaluation. Defaulted to 0–2 charge states.
-
TandemFilterScoring: Scoring algorithm for MS2Filter. Spectra kept by the filter pass a minimum threshold after addition of the MS1_PatternMatch score to the MS2_TandemMSFragment score.
fMS1_MatchFound: A flat score for any MS2 scan with a MS1 pattern match.
fMS1_MatchScore: If the score of the pattern match is positive, the scoring algorithm will account for the quality of the pattern by multiplying the TagFinder score by this value and adding it to the MS2Filter score.
fMS1_MatchMaxScoreEffect: A cap on the score applied from the MS1 pattern. Defaulted to 60.
fMS2_TagFound: For every positive TagMasses identified, a score of this value will be added to the overall score.
fMS2_GoodInverseTagFound: For every negative TagMasses identified (e.g., neutral/charges losses), a score of this value will be added to the overall score.
fMinimumScore: Minimum overall score for an MS2 scan to be kept by the MS2Filter.
-
Grouping: Mechanism for grouping MS1 scans that have the tag pattern. Relevant to the _massspec.csv and _chart.txt outputs.
iMaxScanDifference: Number of scans between two matches of the same m/z value and charge to be combined. Defaulted to 20.
fScoreSynergyDistance: A boost in match score if the maximum difference in pattern quality, as measured by the score between the two matches, is less than this value.
fScoreSynergyBonus: Maximum score boost due to fScoreSynergyDistance.
Output: If this is turned on (value = 1) IsoStamp will produce this output. If turned off (value = 0) IsoStamp will not produce this output. Relevant if user would like to use TagFinder or MS2Filter in isolation.
-
OutputSummary: Relevant for [yourfile]_summary.txt output.
fBaseScore: Base score of 0.0 is reported.
fScoreStep: Step groups of score range 20.0 is reported.
iMaxScoreSteps: Five score groups are reported.
-
OutputChart: Relevant for [yourfile]_chart.txt output.
iMaxGroups: Number of groups that will be printed to the chart. Defaulted to 3000.
-
OutputCSV: Relevant for [yourfile]_massspec.csv.
iMaxGroups: Maximum m/z value groups readout in CSV file, based on score cutoff.
fMinScore: Minimum score cut off for CSV file.
fMinTime: Minimum time for CSV time window, in minutes. Defaulted to 0.0 min.
fMaxTime: Maximum time for CSV time window, in minutes. Defaulted to 120 min.
fWindowTime: Total width of time window to target the m/z value. Meant to account for differences in retention time between runs. Defaulted to 2.0 min. Adjust for reproducibility of chromatography.
ScoreWeights: Weighting system for the scoring algorithm to boost or penalize pattern matches against the reference match.
ReferenceMatch: Reference scores used by scoring algorithm.
Anticipated Results
Labeling with Ac4GalNAz
Ac4GalNAz accesses the cellular GalNAc salvage pathway to form UDP-GalNAz. UDP-GalNAz is interconverted by the UDP-galactose 4-epimerase (GALE) to its C4 epimer, UDP-GlcNAz (Boyce et al., 2011). Thus, metabolic labeling with Ac4GalNAz produces GalNAz-labeled mucin-type O-glycoproteins, GlcNAz-labeled N-glycoproteins and O-GlcNAzylated proteins. Ratios of each glycan type will depend on the efficiency of the glycosyltransferase pathway in a given cell type.
Labeling with Ac4ManNAz
Ac4ManNAz is metabolized to the corresponding N-azidoacetyl sialic acid (SiaNAz) to yield labeled sialoglycoproteins (Prescher et al., 2004).
Labeling with Ac4ManNAl
Ac4ManNAl has been shown to metabolically label sialoglycoproteins at a higher rate than Ac4ManNAz (Chang et al., 2009), and will produce similarly labeled sialoglycoproteins. (Unpublished results, Woo, C.M., Bertozzi, C. R.).
As described, approximately 100–400 individual glycopeptides are expected to be assigned per MS analysis.
Figure 4. Assignment of a typical mucin-type O-glycopeptide labeled with SiaNAz procured via Ac4ManNAz treatment.
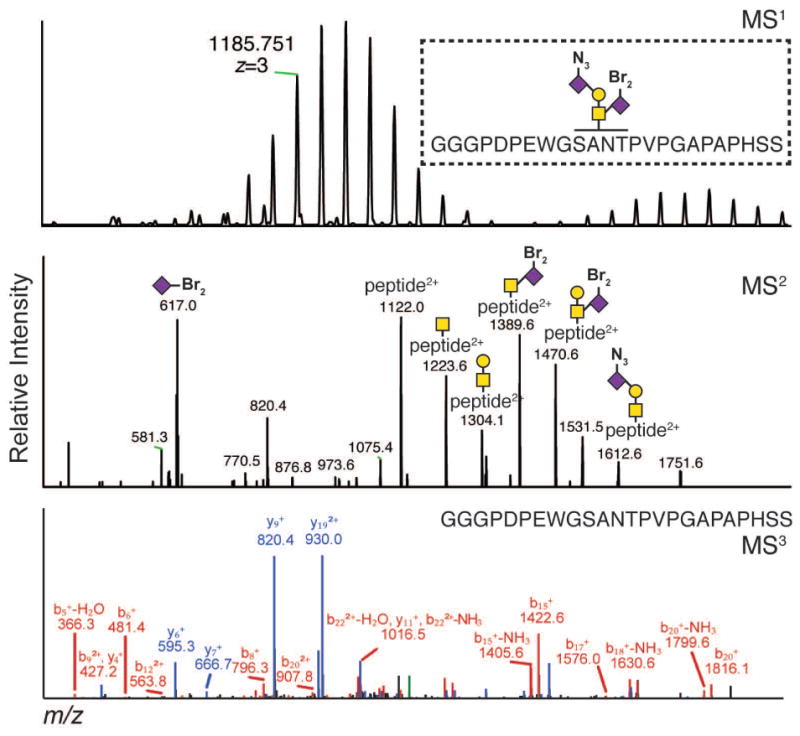
Table 1. Troubleshooting.
| Problem | Possible Cause | Remediation |
|---|---|---|
| Proteins did not precipitate after methanol precipitation | Low concentration of proteins in the sample |
|
| Protein pellet did go into solution during sonication | High concentration of globular proteins in the sample |
|
| CuAAC chemistry did not proceed | Exposure to EDTA chelates the copper catalyst and prevents reaction. CuAAC reagents have limited stability and may been to be prepared fresh for best results. |
|
| Digestion did not proceed | Protease activity decreases over time following suspension. |
|
| IsoStamp did not give desired results | One of the file inputs may be incorrect (e.g., mzXML file, parameters file). |
|
| Spectra do not show the expected glycopeptide fragments/difficult to analyze | Off target labeling by the probe is estimated to occur at a rate of 3% in samples without azido-glycan added as compared to metabolically labeled samples. |
|
Table 2. Time considerations.
| Action | Time | |
|---|---|---|
| Metabolic labeling | Cell culture, Media A | 48 h |
| Cell culture, Media B (FBS free) | 48 h | |
| Glycopeptide Enrichment | Cell lysis | 0.5 h |
| Centrifugal filtration of conditioned media | 3 h | |
| Protein quantification | 0.5 h | |
| Click chemistry | 3 h | |
| Methanol precipitation | 1 h | |
| Streptavidin–agarose capture | 12 h | |
| Washing | 1 h | |
| Reduction and alkylation | 1 h | |
| Trypsin digestion | 12 h | |
| Mass spectrometry | Scouting runs | 2 h per sample |
| Include list directed runs | 2 h per sample | |
| Data analysis | Database searching | Variable |
| Manual validation | Variable |
Acknowledgments
We thank Peder Lund for critical reading. Financial support from the National Institutes of Health (CA200423, C.R.B.), the Jane Coffin Childs Memorial Fund (C.M.W.), the Burroughs Wellcome Foundation Career Awards at the Scientific Interface (C.M.W.), and the Howard Hughes Medical Institute (C.R.B.) are gratefully acknowledged.
Footnotes
Internet Resources: The latest version of IsoStamp is available as a web application and for download. Selected examples of data collected with this procedure and applications are also provided.
Contributor Information
Christina M. Woo, Email: cmwoo@stanford.edu.
Carolyn R. Bertozzi, Email: bertozzi@stanford.edu.
Literature Cited
- Boyce M, Carrico IS, Ganguli AS, Yu S, Hangauer MJ, Hubbard SC, Kohler JJ, Bertozzi CR. Metabolic cross-talk allows labeling of O-linked β-N-acetylglucosamine-modified proteins via the N-acetylgalactosamine salvage pathway. Proc Natl Acad Sci. 2011;108:3141–3146. doi: 10.1073/pnas.1010045108. [DOI] [PMC free article] [PubMed] [Google Scholar]
- Breidenbach MA, Palaniappan KK, Pitcher AA, Bertozzi CR. Mapping yeast N-glycosites with isotopically recorded glycans. Mol Cell Proteomics. 2012;11:M111.015339. doi: 10.1074/mcp.M111.015339. [DOI] [PMC free article] [PubMed] [Google Scholar]
- Chang PV, Chen X, Smyrniotis C, Xenakis A, Hu T, Bertozzi CR, Wu P. Metabolic Labeling of Sialic Acids in Living Animals with Alkynyl Sugars. Angew Chem Int Ed. 2009;48:4030–4033. doi: 10.1002/anie.200806319. [DOI] [PMC free article] [PubMed] [Google Scholar]
- Chuh KN, Zaro BW, Piller F, Piller V, Pratt MR. Changes in Metabolic Chemical Reporter Structure Yield a Selective Probe of O-GlcNAc Modification. J Am Chem Soc. 2014;136:12283–12295. doi: 10.1021/ja504063c. [DOI] [PMC free article] [PubMed] [Google Scholar]
- Clark PM, Dweck JF, Mason DE, Hart CR, Buck SB, Peters EC, Agnew BJ, Hsieh-Wilson LC. Direct In-Gel Fluorescence Detection and Cellular Imaging of O-GlcNAc-Modified Proteins. J Am Chem Soc. 2008;130:11576–11577. doi: 10.1021/ja8030467. [DOI] [PMC free article] [PubMed] [Google Scholar]
- Fuster MM, Esko JD. The sweet and sour of cancer: Glycans as novel therapeutic targets. Nat Rev Cancer. 2005;5:526–542. doi: 10.1038/nrc1649. [DOI] [PubMed] [Google Scholar]
- Greis KD, Hayes BK, Comer FI, Kirk M, Barnes S, Lowary TL, Hart GW. Selective Detection and Site-Analysis of O-GlcNAc-Modified Glycopeptides by β-Elimination and Tandem Electrospray Mass Spectrometry. Anal Biochem. 1996;234:38–49. doi: 10.1006/abio.1996.0047. [DOI] [PubMed] [Google Scholar]
- Hagglund P, Bunkenborg J, Elortza F, Jensen ON, Roepstorff P. A new strategy for identification of N-glycosylated proteins and unambiguous assignment of their glycosylation sites using HILIC enrichment and partial deglycosylation. J Proteome Res. 2004;3:556–566. doi: 10.1021/pr034112b. [DOI] [PubMed] [Google Scholar]
- Hollingsworth MA, Swanson BJ. Mucins in Cancer: Protection and Control of the Cell Surface. Nat Rev Cancer. 2004;4:45–60. doi: 10.1038/nrc1251. [DOI] [PubMed] [Google Scholar]
- Hubbard SC, Boyce M, McVaugh CT, Peehl DM, Bertozzi CR. Cell surface glycoproteomic analysis of prostate cancer-derived PC-3 cells. Bioorg Med Chem Lett. 2011;21:4945–4950. doi: 10.1016/j.bmcl.2011.05.045. [DOI] [PMC free article] [PubMed] [Google Scholar]
- Ma J, Hart GW. Protein O-GlcNAcylation in diabetes and diabetic complications. Expert Rev Proteomics. 2013;10:365–380. doi: 10.1586/14789450.2013.820536. [DOI] [PMC free article] [PubMed] [Google Scholar]
- Medzihradszky KF, Kaasik K, Chalkley RJ. Tissue-specific glycosylation at the glycopeptide level. Mol Cell Prot. 2015 doi: 10.1074/mcp.M115.050393. [DOI] [PMC free article] [PubMed] [Google Scholar]
- Nilsson J, Ruetschi U, Halim A, Hesse C, Carlsohn E, Brinkmalm G, Larson G. Enrichment of glycopeptides for glycan structure and attachment site identification. Nat Meth. 2009;6:809–811. doi: 10.1038/nmeth.1392. [DOI] [PubMed] [Google Scholar]
- Palaniappan KK, Pitcher AA, Smart BP, Spiciarich DR, Iavarone AT, Bertozzi CR. Isotopic Signature Transfer and Mass Pattern Prediction (IsoStamp): An Enabling Technique for Chemically-Directed Proteomics. ACS Chem Biol. 2011;6:829–836. doi: 10.1021/cb100338x. [DOI] [PMC free article] [PubMed] [Google Scholar]
- Parodi AJ. Protein glucosylation and its role in protein folding. Annu Rev Biochem. 2000;69:69–93. doi: 10.1146/annurev.biochem.69.1.69. [DOI] [PubMed] [Google Scholar]
- Paszek MJ, DuFort CC, Rossier O, Bainer R, Mouw JK, Godula K, Hudak JE, Lakins JN, Wijekoon AC, Cassereau L, Rubashkin MG, Magbanua MJ, Thorn KS, Davidson MW, Rugo HS, Park JW, Hammer DA, Giannone G, Bertozzi CR, Weaver VM. The cancer glycocalyx mechanically primes integrin-mediated growth and survival. Nature. 2014 doi: 10.1038/nature13535. advanced online publication. [DOI] [PMC free article] [PubMed] [Google Scholar]
- Phetsang W, Blaskovich MAT, Butler MS, Huang JX, Zuegg J, Mamidyala SK, Ramu S, Kavanagh AM, Cooper MA. An azido-oxazolidinone antibiotic for live bacterial cell imaging and generation of antibiotic variants. Bioorg Med Chem. 2014;22:4490–4498. doi: 10.1016/j.bmc.2014.05.054. [DOI] [PMC free article] [PubMed] [Google Scholar]
- Pouria S, Corran PH, Smith AC, Smith HW, Hendry BM, Challacombe SJ, Tarelli E. Glycoform composition profiling of O-glycopeptides derived from human serum IgA1 by matrix-assisted laser desorption ionization-time of flight-mass spectrometry. Anal Biochem. 2004;330:257–263. doi: 10.1016/j.ab.2004.03.053. [DOI] [PubMed] [Google Scholar]
- Prescher JA, Dube DH, Bertozzi CR. Chemical remodelling of cell surfaces in living animals. Nature. 2004;430:873–877. doi: 10.1038/nature02791. [DOI] [PubMed] [Google Scholar]
- Song E, Hu Y, Hussein A, Yu CY, Tang H, Mechref Y. Characterization of the Glycosylation Site of Human PSA Prompted by Missense Mutation using LC–MS/MS. J Proteome Res. 2015;14:2872–2883. doi: 10.1021/acs.jproteome.5b00362. [DOI] [PMC free article] [PubMed] [Google Scholar]
- Song E, Mayampurath A, Yu CY, Tang H, Mechref Y. Glycoproteomics: Identifying the Glycosylation of Prostate Specific Antigen at Normal and High Isoelectric Points by LC–MS/MS. J Proteome Res. 2014;13:5570–5580. doi: 10.1021/pr500575r. [DOI] [PMC free article] [PubMed] [Google Scholar]
- Steentoft C, Vakhrushev SY, Joshi HJ, Kong Y, Vester-Christensen MB, Schjoldager KT, Lavrsen K, Dabelsteen S, Pedersen NB, Marcos-Silva L, Gupta R, Bennett EP, Mandel U, Brunak S, Wandall HH, Levery SB, Clausen H. Precision mapping of the human O-GalNAc glycoproteome through SimpleCell technology. The EMBO journal. 2013;32:1478–1488. doi: 10.1038/emboj.2013.79. [DOI] [PMC free article] [PubMed] [Google Scholar]
- Steentoft C, Vakhrushev SY, Vester-Christensen MB, Schjoldager KT, Kong Y, Bennett EP, Mandel U, Wandall H, Levery SB, Clausen H. Mining the O-glycoproteome using zinc-finger nuclease-glycoengineered SimpleCell lines. Nat Meth. 2011;8:977–982. doi: 10.1038/nmeth.1731. [DOI] [PubMed] [Google Scholar]
- Szychowski J, Mahdavi A, Hodas JJL, Bagert JD, Ngo JT, Landgraf P, Dieterich DC, Schuman EM, Tirrell DA. Cleavable Biotin Probes for Labeling of Biomolecules via Azide–Alkyne Cycloaddition. J Am Chem Soc. 2010;132:18351–18360. doi: 10.1021/ja1083909. [DOI] [PMC free article] [PubMed] [Google Scholar]
- Trinidad JC, Schoepfer R, Burlingame AL, Medzihradszky KF. N- and O-Glycosylation in the Murine Synaptosome. Mol Cell Prot. 2013;12:3474–3488. doi: 10.1074/mcp.M113.030007. [DOI] [PMC free article] [PubMed] [Google Scholar]
- Vosseller K, Trinidad JC, Chalkley RJ, Specht CG, Thalhammer A, Lynn AJ, Snedecor JO, Guan S, Medzihradszky KF, Maltby DA, Schoepfer R, Burlingame AL. O-linked N-acetylglucosamine proteomics of postsynaptic density preparations using lectin weak affinity chromatography and mass spectrometry. Mol Cell Prot. 2006;5:923–934. doi: 10.1074/mcp.T500040-MCP200. [DOI] [PubMed] [Google Scholar]
- Wang W, Hong S, Tran A, Jiang H, Triano R, Liu Y, Chen X, Wu P. Sulfated Ligands for the Copper(I)-Catalyzed Azide–Alkyne Cycloaddition. Chem Asian J. 2011;6:2796–2802. doi: 10.1002/asia.201100385. [DOI] [PMC free article] [PubMed] [Google Scholar]
- Woo CM, Iavarone AT, Spiciarich DR, Palaniappan KK, Bertozzi CR. Isotope-targeted glycoproteomics (IsoTaG): a mass-independent platform for intact N- and O-glycopeptide discovery and analysis. Nat Meth. 2015;12:561–567. doi: 10.1038/nmeth.3366. [DOI] [PMC free article] [PubMed] [Google Scholar]
- Wu SW, Pu TH, Viner R, Khoo KH. Novel LC-MS(2) product dependent parallel data acquisition function and data analysis workflow for sequencing and identification of intact glycopeptides. Anal Chem. 2014;86:5478–5486. doi: 10.1021/ac500945m. [DOI] [PubMed] [Google Scholar]
- Zachara NE, Hart GW. Cell signaling, the essential role of O-GlcNAc! BBA – Mol Cell Bio Lipids. 2006;1761:599–617. doi: 10.1016/j.bbalip.2006.04.007. [DOI] [PubMed] [Google Scholar]
- Zaro BW, Yang YY, Hang HC, Pratt MR. Chemical reporters for fluorescent detection and identification of O-GlcNAc-modified proteins reveal glycosylation of the ubiquitin ligase NEDD4-1. Proc Natl Acad Sci. 2011;108:8146–8151. doi: 10.1073/pnas.1102458108. [DOI] [PMC free article] [PubMed] [Google Scholar]
- Zhang H, Li XJ, Martin DB, Aebersold R. Identification and quantification of N-linked glycoproteins using hydrazide chemistry, stable isotope labeling and mass spectrometry. Nat Biotech. 2003;21:660–666. doi: 10.1038/nbt827. [DOI] [PubMed] [Google Scholar]
- Zielinska DF, Gnad F, Wiśniewski JR, Mann M. Precision Mapping of an In Vivo N-Glycoproteome Reveals Rigid Topological and Sequence Constraints. Cell. 141:897–907. doi: 10.1016/j.cell.2010.04.012. [DOI] [PubMed] [Google Scholar]
Key Reference
- Woo CM, Iavarone AT, Spiciarich DR, Palaniappan KK, Bertozzi CR. Isotope-targeted glycoproteomics (IsoTaG): a mass-independent platform for intact N- and O-glycopeptide discovery and analysis. Nat Meth. 2015;6561 doi: 10.1038/nmeth.3366. [DOI] [PMC free article] [PubMed] [Google Scholar]