

Abstract
Cytoplasmic citrate serves as an important regulator of gluconeogenesis and carbon source for de novo lipogenesis in the liver. For this reason, the sodium‐coupled citrate transporter (NaCT), a plasma membrane transporter that governs hepatic influx of plasma citrate in human, is being explored as a potential therapeutic target for metabolic disorders. As cytoplasmic citrate also originates from intracellular mitochondria, the relative contribution of these two pathways represents critical information necessary to underwrite confidence in this target. In this work, hepatic influx of plasma citrate was quantified via pharmacokinetic modeling of published clinical data. The influx was then compared to independent literature estimates of intracellular citrate flux in human liver. The results indicate that, under normal conditions, <10% of hepatic citrate originates from plasma. Similar estimates were determined experimentally in mice and rats. This suggests that NaCT inhibition will have a limited impact on hepatic citrate concentrations across species.
Study Highlights.
WHAT IS THE CURRENT KNOWLEDGE ON THE TOPIC? ☑ NaCT has been proposed as a therapeutic target for obesity and diabetes. However, no study identified the relative contribution of plasma citrate to hepatic citrate. • WHAT QUESTIONS DID THIS STUDY ADDRESS? ☑ What is the hepatic influx of plasma citrate in humans? What is the relative contribution of plasma citrate to hepatic citrate in humans, mice, and rats? Is plasma citrate a reasonable biomarker for NaCT inhibition? • WHAT THIS STUDY ADDS TO OUR KNOWLEDGE ☑ Under normal conditions, <10% of hepatic citrate originates from plasma in humans, mice, and rats. Liver is the major organ that clears citrate from plasma in humans. Plasma citrate could serve as a biomarker for NaCT inhibition in humans. • HOW THIS MIGHT CHANGE CLINICAL PHARMACOLOGY AND THERAPEUTICS ☑ Future studies should determine the effect of NaCT inhibition on hepatic citrate (preferably cytoplasmic citrate) concentrations, and their quantitative relationship to efficacy endpoints (e.g., glucose and lipid lowering) as means of evaluating confidence in rationale prior to efficacy‐based trials.
The sodium‐coupled citrate transporter (NaCT) has been proposed as a therapeutic target for obesity and diabetes.1 NaCT, coded by gene SLC13A5, is expressed predominately in the plasma membrane of mammalian liver, and at lower levels in the brain and testes.2 NaCT transports citrate from plasma into the cytoplasm of hepatocytes, where citrate serves as an important precursor of de novo lipogenesis and gluconeogenesis.2, 3 Citrate stimulates de novo lipogenesis and gluconeogenesis by activating acetyl‐CoA carboxylase (ACC) and promoting fructose‐1, 6‐bisphosphase (F‐1, 6‐BP) production (Figure 1).4, 5, 6 Conversely, citrate has an inhibitory effect on glycolysis by inhibiting phosphofructokinase (PFK).7 As such, inhibition of NaCT should reduce citrate flux from plasma into the liver and lower cytoplasmic citrate levels, which could, in turn, promote glycolysis and reduce lipogenesis and gluconeogenesis. This hypothesis is supported by rodent studies where SLC13A5 deletion confers protection from age and high‐fat diet‐induced adiposity and insulin resistance.1
Figure 1.
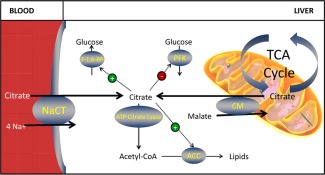
Schematic depiction of the biological pathways that involve citrate and the role of NaCT in supplying citrate for hepatic biosynthesis. Plasma and mitochondrial citrate can be transported into hepatic cytoplasm by NaCT and another citrate transporter located on the mitochondrial membrane. Cytoplasmic citrate from both sources can inhibit PFK, activate F‐1, 6‐BP, and ACC, and/or be broken down to form acetyl‐CoA, an important precursor in biosynthesis reactions.
Whether the effects of NaCT knockout in mice can be translated into humans is unclear, because of species‐specific differences with respect to substrate‐sensitivity8, 9 and cation‐dependency.10 Cross‐species translation is further complicated by the fact that there are at least two other transporters that play a role in citrate homeostasis: low‐affinity sodium‐dependent dicarboxylate cotransporter (NaDC1) encoded by SLC13A2, and high‐affinity sodium‐dependent dicarboxylate cotransporter (NaDC3) encoded by SLC13A3. Although NaCT is located primarily in the liver of both humans and mice, its relative importance to hepatic citrate uptake appears to be different across these species. While NaCT is the dominant citrate transporter transcribed in human hepatocytes, NaDC1 and NaDC3 contribute to citrate transport in mouse hepatocytes (in‐house data).
The goal of this work was to evaluate the therapeutic confidence in the rationale of NaCT inhibition in humans. One key question underscoring confidence in rationale is the fractional contribution of NaCT to hepatic citrate concentrations. It is known that there exist at least two sources of citrate in liver: one is the influx of plasma citrate majorly regulated by NaCT, and the other is the output of local tricarboxylic acid (TCA) cycle in mitochondria2 (Figure 1). In this work, the relative contribution of these two pathways to hepatic citrate was quantified. A model‐based analysis was performed using literature pharmacokinetic (PK) data on citrate. The model‐derived estimate of hepatic influx was then compared to intracellular citrate flux in the liver reported in the literature. The modeling results suggest that, in humans, although hepatic influx largely determines the rate of citrate clearance from the plasma (i.e., 85%), the rate is small relative to the intracellular flux occurring from the mitochondria as a consequence of the TCA cycle.
In order to more directly understand how much plasma citrate contributes to liver citrate levels, preclinical hepatic citrate enrichment studies were conducted in mice and rats. One study using mice infused with 13C‐citrate showed 25% 13C‐citrate enrichment in plasma at steady state, yet only 0.7% 13C‐citrate enrichment was found in the liver. Another study using fasting rats treated with 14C‐citrate demonstrated that fewer 14C radiolabels were incorporated into lipids extracted from liver than those from kidney or testes. Given that liver is the major organ synthesizing lipids, and lipogenesis occurs in the cytoplasm, the findings suggest that flux of citrate from plasma to the liver contributes minimally to the bulk production of lipids in the liver of fasting rats.
Overall, these results suggest that NaCT inhibition will marginally affect hepatic citrate concentrations and therefore cast uncertainty on the rationale supporting their development to treat metabolic disorders and translation of the observed metabolic benefits in rodents to humans. As such, future studies should explicitly determine the effect of such inhibitors on hepatic citrate (preferably cytoplasmic citrate) concentrations, efficacy endpoints (e.g., glucose and lipid lowering), and flux analysis as a means of evaluating confidence in rationale prior to efficacy‐based trials.
METHODS
Literature search results
Five articles that describe the clinical PK of citrate in healthy subjects were identified and used in this analysis.11, 12, 13, 14, 15 The means of longitudinal plasma citrate measurements, corresponding study size (n), and standard deviations (SD) were read from tables or digitized from figures (with PlotDigitizer.exe) to use in this modeling.
Five additional articles reporting intracellular citrate flux in the liver of healthy subjects were also identified and included in this study.16, 17, 18, 19, 20 The articles report in vivo intracellular citrate flux as estimates determined via noninvasive technologies, such as in vivo nuclear magnetic resonance (NMR) combined with 13C‐labeling technology, 1H, 2H, 13C magnetic resonance spectroscopy (MRS), or sampling glutamine through urine phenylacetylglutamine (PAGN) and apolipoproteinB‐100 (apoB‐100). The reported mean values of hepatic citrate flux with SD as well as n were utilized in this analysis.
Model‐based analysis of citrate PK in healthy humans
Citrate PK profiles in healthy subjects following i.v. and p.o. doses of citrate were analyzed simultaneously using classic compartment models (Eqs. (1), (2)) in NONMEM 7.2. NONMEM code and the data file are provided in Supporting Information I & II.
| (1) |
| (2) |
To account for the difference of subject numbers and endpoint variance in each study, the model fitting was weighted using √n/SD. In the formula, n is the number of subjects and SD is the standard deviation from the literature. With this setting, more weight was given to studies with larger sample populations and smaller variance. This analysis provided information on citrate clearance (CLelim), volume of distribution (Vd), baseline plasma citrate concentration (Cp(0)), and bioavailability of oral citrate (F) in healthy subjects.
Diagnostic plots of predicted vs. measured values were used to evaluate how well the models were able to fit the data. Furthermore, conditionally weighted residuals (CWRES) were plotted against predicted values and time to examine any potential bias of the model. A histogram of CWRES was used to evaluate if the errors are normally distributed. Simulated temporal and dose–response curves with observed data ± SD were overlaid to evaluate model performance.
Based on the calibrated parameters, the basal turnover of plasma citrate (TOcitratet) was calculated using Eq. (3):
| (3) |
Hepatic clearance of citrate (CLh) was calculated using Eq. (4), where Qh is hepatic blood flow and fp is the volume fraction of plasma in whole blood. Consistent with literature reports, the equation assumes a citrate absorption of 97%15 and negligible metabolism in the lung and intestine. As citrate does not bind plasma proteins7 nor traverse the plasma membrane of red blood cells,21 it is concluded that citrate is only localized to plasma as unbound molecules. The value of Qh assumed in this calculation is 20 mL/min/kg,22 and fp is 55%. F is the fractional oral bioavailability of citrate estimated using Eqs. (1) and (2):
| (4) |
The basal hepatic flux of citrate from plasma was calculated using Eq. (5):
| (5) |
Literature‐based analysis of hepatic citrate flux in human
Both fixed and random effect approaches were used to estimate the weighted mean of hepatic citrate flux in humans using R 3.0.2 with meta‐analysis library (metafor). The data from the literature and R code are provided in Supporting Information III & IV. The fixed effect approach assumed that the true mean was the same in all studies; as such, the flux from each study was weighted by sampling errors within the study only. In contrast, the random effect approach assumed that heterogeneity existed among the studies, and sampling errors of both within and between studies were used for weighting. Means and 95% confidence intervals (CIs) of the estimated values, combined with individual reported values, were included in one forest plot for visualization.
Preclinical evaluation of the contribution of plasma citrate to hepatic citrate levels
All procedures performed on animals minimized their suffering, complied with regulations and established guidelines, and were approved by a Pfizer Institutional Animal Care and Use Committee.
Mice 13C‐citrate infusion study
Male B6/C57 DIO mice (n = 8) from Jackson Laboratories (Bar Harbor, ME) arrived at 17 weeks of age following 12 weeks of high‐fat diet (HFD, D12459i with 60% calories from fat). After an additional 3‐week HFD acclimation period, the mice were implanted with a jugular vein cannula and allowed 4 days to recover. On day 4, all mice were fasted beginning at 5:00 pm. On day 5, after the overnight fast, mice were reconnected to jugular vein tubing in a disposable cage. U‐[13C]‐citrate was infused at 1.5 mmol/kg/hr for 5 minutes, followed by 0.15 mmol/kg/hr for 115 minutes. Blood samples were collected at 0, 5, 60, 90, and 120‐minute timepoints (n = 8 at each timepoint). All mice were euthanized at 120 minutes (n = 8) and livers were immediately harvested. The percentages of 13C‐citrate enrichment were analyzed in both blood and liver samples using mass spectrum.
Incorporation of radioactivity of 14C‐citrate into lipids using rats
Male Sprague‐Dawley (SD) rats (n = 8) at 8 weeks of age and fed a normal chow diet were used in this study. The rats were i.v. dosed with 0.4 mL of 50 µCi/mL 1, 5‐[14C]‐citrate on the morning of the experimental day. Twenty minutes after the dosing, rats were sacrificed using a lethal dose of pentobarbital. Liver, kidney, and testes were harvested to analyze the amount of radioactivity per gram of tissue using Bligh and Dryer extraction.23 Plasma radioactivity was quantified by measuring radioactivity in 10 µL of plasma added to 5 mL of Optiphase Supermix on a standard scintillation counter.
RESULTS
Clearance and turnover of plasma citrate in healthy humans
Human PK data were well described by the proposed model, yielding well‐defined parameters (Table 1 , Figure 2). Diagnostic plots revealed a good concordance between model predicted and observed plasma citrate concentrations. There was not any obvious trend of model residues vs. time, nor prediction. The distribution of residues appeared to be normal. Diagnostic plots are provided in Supporting Information V.
Table 1.
Citrate pharmacokinetic parameter estimates derived from healthy subjects
| Parameters | Description | Value | 95%CI | Unit |
|---|---|---|---|---|
| Cp(0) | Baseline plasma citrate | 0.13 | [0.11–0.14] | mM |
| kabs | Absorption rate | 0.02 | [0.01–0.04] | min−1 |
| CLelim | Elimination clearance | 7.79 | [5.70–10.45] | mL/min/kg |
| Vd | Central distribution volume | 259 | [242–281] | mL/kg |
| F | Fractional bioavailability | 0.37 | [0.20–0.64] | Unit‐less |
Figure 2.
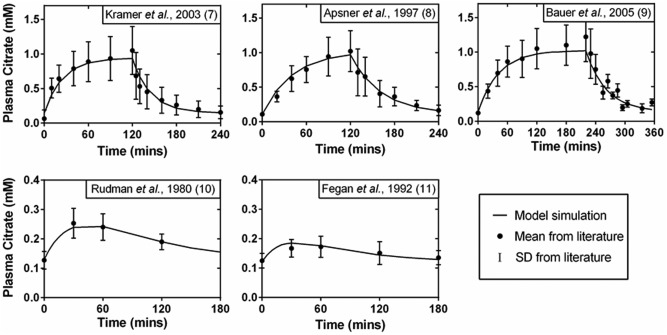
Fitting results of citrate PK profiles in healthy humans. Data were obtained from five independent studies, as labeled on the top of each panel. Citrate was i.v. infused at 0.5 mmol/kg/hr, 0.34 mmol/kg/hr, and 0.33 mmol/kg/hr for 120, 120, and 220 minutes as described in Kramer et al., 2003,11 Apsner et al., 1997,12 and Bauer et al., 2005,13 respectively. Citrate was p.o. dosed at 0.26 mmol/kg and 0.19 mmol/kg as in Rudman et al., 198014 and Fegan et al., 1992,15 respectively.
In healthy subjects, citrate clearance was estimated to be 7.79 mL/min/kg with a 95% CI of [5.70–10.45]. The baseline plasma citrate concentration was estimated to be 0.13 mM with a 95% CI of [0.11–0.14]. Using Eq. (3), the turnover of plasma citrate in healthy subjects was determined to be ∼20 g/day.
In healthy subjects, hepatic citrate clearance was calculated to be 6.60 mL/min/kg (Eq. (4)), accounting for ∼85% of total citrate clearance. With sequential measurements of plasma citrate in healthy subjects following i.v. and p.o. doses of citrate, the fraction of bioavailability was calibrated to 0.37 with a 95% CI of [0.20–0.64]. Given the assumed fractional absorption of 97%,15 the oral, first‐pass hepatic extraction of citrate is estimated to be 60% (with a 95% CI of [0.33–0.77]).
Based on the hepatic clearance and plasma concentration of citrate, the hepatic influx of plasma citrate was calculated maximally to be 17 g/day with a 95% CI of [9–20] (Eq. (5)).
Local citrate production in the liver of healthy humans
Analysis of reported hepatic citrate synthesis rates indicates that the rate of endogenous citrate production greatly exceeds the rate of flux from the plasma citrate. Using the five literature reported hepatic citrate synthesis rates, the fixed effect estimate of the intracellular citrate flux in the liver of healthy subjects was 222 g/day with a 95% CI of [202–242]. When the heterogeneity of the studies was taken into consideration, the mixed effect estimate was approximated to 303 g/day with a 95% CI of [119–487] (Figure 3). These results suggest that plasma citrate contributes no more than 10% of local citrate flux in the liver of healthy humans.
Figure 3.
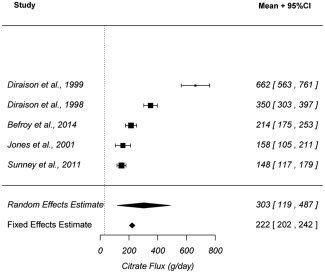
Forest plot of hepatic citrate flux in healthy humans. Intracellular citrate flux in the liver of healthy subjects from five articles were included in this analysis. Both fixed and random effect estimates with 95% CI are reported in the plot.
13C‐citrate infusion study using mice
Plasma citrate clearance in mice was determined to be 50 ml/min/kg. At steady state, the plasma citrate concentration increased by approximately one‐third over the endogenous level (i.e., from 0.15 mM to 0.2 mM). Given the maintenance infusion rate of 0.15 mmol/kg/hour in this study, the mice had a plasma citrate clearance (50 ml/min/kg) considerably higher than that in healthy humans (7.2 ml/min/kg).
The plasma enrichment of 13C‐citrate from the mice was plotted as a function of time in Figure 4 a. At the end of the infusion, when the animals were sacrificed and tissue samples were analyzed, 25 ± 1% of citrate measured in the plasma was associated with the 13C label (n = 8). In comparison, only 0.7 ± 0.3% of citrate measured in the liver was associated with the 13C label (n = 8) (Figure 4 b).
Figure 4.
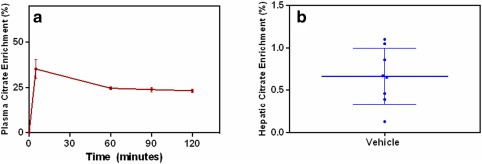
Plasma and hepatic enrichment of 13C‐citrate in mice i.v. infused with 13C‐citrate. (a) Plasma citrate enrichment was illustrated as a time sequential profile (red). (b) In the liver, the enrichment was a timepoint measurement (blue) taken 120 minutes after the infusion, when steady state was reached. For all the measurements, both mean and SD values are shown on the plots.
Incorporation of 14C‐citrate into lipids using fasting rats
Twenty minutes after dosing rats with 14C‐labeled citrate, radioactivity of 14C was found to be the highest in the lipids extracted from kidney (2,072 ± 643 dpm/mg tissue, n = 8), followed by the testes (1,090 ± 230 dpm/mg tissue, n = 8). Lipids extracted from liver displayed the least radioactivity at 450 ± 394 dpm/mg liver tissue (n = 8) (Figure 5 a). In the plasma, the radioactivity levels declined quickly, suggesting a short half‐life of plasma citrate in rats (Figure 5 b). At 20 minutes after i.v. 14C‐citrate infusion, the density of radioactivity reduced to half of that observed at 10 minutes after dosing.
Figure 5.
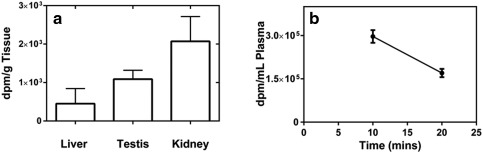
The radioactivity density of lipids and plasma from rats with i.v. 14C‐citrate bolus targeting 20 µCi/rat. (a) Radioactivity density of the lipids extracted from liver, kidney, and testes of SD rats at 20 minutes after dosing 14C‐citrate. (b) Radioactivity density of the plasma at 10 and 20 minutes after the dosing of 14C‐citrate. Error bars represent SD.
DISCUSSION
Citrate PK and hepatic flux in humans
In this study, whole body plasma citrate clearance in healthy humans was estimated to be 7.79 mL/min/kg, with a baseline citrate concentration of 0.13 mM. These two parameters combine to give a citrate turnover rate of 20 g/day, which is consistent with independent literature reports of 10 g/day determined by Nielsen.7 As 1 g of citric acid contains 2.5 calories,24 a turnover of 20 g/day of citrate corresponds to ∼50 calories daily, indicating a limited calorie exclusion resulting from a complete inhibition of plasma citrate utilization. The citrate intake from a typical diet is less than 10 g per day.7, 25 As such, a significant amount of the citrate found in plasma is provided via endogenous production. The tissues that are known to release citrate include muscle, bone, and prostate.7, 26
Hepatic citrate clearance was found to be 6.6 mL/min/kg, indicating that liver is the predominant organ that metabolizes plasma citrate (i.e., 85% of total clearance). This aligns with prior knowledge that the liver is an important organ involved in citrate metabolism,27 and with the fact that plasma citrate clearance is substantially decreased in subjects with impaired liver function.11, 12 A portion of the remaining 15% of plasma citrate clearance is likely due, at least in part, to the kidney. This is consistent with the understanding that the kidney also plays a role in citrate homeostasis.28, 29, 30 For example, in healthy humans the glomerular filtrate rate of citrate is ∼4 g per day, with 70–90% reabsorbed at the proximal tubule by active citrate transporters (SLC13A2 and SLC13A3) and only 10–30% remaining in the urine.31 As a result, the urine excretion of citrate is ∼0.4–1.2 g/day (i.e., 2–6% of daily citrate turnover).32, 33 However, depending on the metabolic capacity of the kidney, the reabsorbed citrate may or may not circulate back into plasma. If citrate is renally metabolized, it could lead to a net elimination of up to 4 g of citrate daily (20% of daily citrate turnover). Consistent with the physiologic case for the relatively minor role of kidney in human citrate clearance, the pharmacokinetics of citrate are unaffected by impairments in renal function.13, 15
Assuming that NaCT is entirely responsible for the hepatic clearance of citrate, an inhibitor of NaCT is expected to significantly affect circulating citrate concentrations. Simulations from the derived PK model indicate that the assumed level of inhibition will affect both the magnitude and time‐course citrate elevations. Maximum steady‐state elevations are expected to be approximately sevenfold, with a twofold increase at 87% NaCT inhibition Eq. (6), where fCLNaCT and fiNaCT are the fractional clearance through NaCT and fractional inhibition of NaCT, respectively):
| (6) |
In addition, the time to reach a new steady‐state citrate concentration will increase with inhibition, since inhibition affects the half‐life of citrate (e.g., baseline of 23 minutes3, 7 and up to 2.7 hours with complete NaCT inhibition, Figure 6 a,b). As such, elevations in plasma citrate are expected to represent an excellent biomarker of NaCT activity upon administration of an inhibitor, particularly when examined within the context of a PK model. However, such elevations in plasma citrate are expected to partially offset the effect of inhibition on flux and associated steady‐state hepatic citrate concentrations. For example, 50% inhibition of NaCT is expected to decrease flux by only 13% and near maximal inhibition (i.e., 87%) is expected to decrease flux by only 50%:
| (7) |
Figure 6.
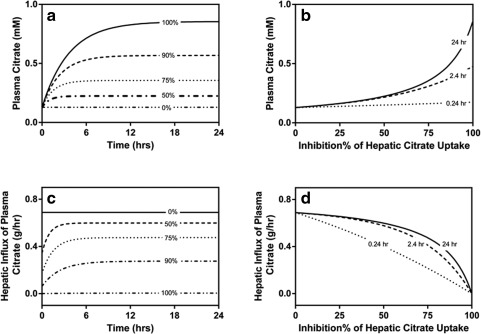
Simulation of plasma citrate and hepatic influx of plasma citrate in response to NaCT inhibition. (a) Time sequential profiles of plasma citrate in response to inhibition. (b) Time‐dependence of plasma citrate elevations across a range of NaCT inhibition. (c) Time sequential profiles of hepatic influx of plasma citrate in response to inhibition. (d) Time‐dependence of hepatic citrate influx across a range of NaCT inhibition.
While these results suggest that NaCT inhibition will marginally affect hepatic citrate concentrations, an even greater limitation is indicated by the estimated basal intracellular flux of 200–300 g/day. This suggests that the plasma citrate influx pathway in which NaCT is involved (i.e., 17 g/day) is a relatively minor contributor (i.e., <10%) to the overall flux of citrate within the liver.
Of course, this assessment is indirect in that it involves two independent, complex, and unique approaches to estimate the two flux pathways (e.g., pharmacokinetic analysis for extracellular flux and noninvasive imaging for the intracellular flux). The pharmacokinetic analysis also involves certain assumptions (e.g., negligible gut and lung metabolism), which, if invalid, would overestimate the hepatic citrate clearance. In addition, the accuracy of technologies used in the estimation of in vivo hepatic citrate flux (e.g., in vivo NMR combined with 13C‐labeling technology, 1H, 2H, 13C MRS, or sampling glutamine through urine PAGN and apoB‐100) are still under evaluation. These estimates of in vivo intracellular flux are also determined at the level of whole liver, with no distinction as to subcellular compartmentalization (e.g., cytoplasm vs. mitochondria) which, if available, might lead to a different assessment of the relative importance of the two pathways. In order to get a more direct estimate of the contribution of citrate flux from plasma to the net hepatic citrate concentration, preclinical studies were conducted whereby hepatic enrichment of labeled citrate could be assessed.
Citrate PK in mice and rats
Using fasting mice, we were able to demonstrate that the hepatic influx of plasma citrate was very low compared to intracellular citrate pools within the liver. In our studies, hepatic 13C‐citrate enrichment is only 2.8% of that observed in the plasma (i.e., 0.7% in liver vs. 25% in plasma) at steady state. Consistent with our conclusions for human, these results suggest that inhibition of plasma citrate flux would marginally affect hepatic citrate concentrations in mice, as most hepatic citrate seemingly originates from the TCA cycle. Unfortunately, an orthogonal assessment through inhibition of plasma citrate flux is precluded by the lack of selective inhibitors for the predominate hepatic citrate transporters expressed in mice (i.e., SLC13A2 and A3). Furthermore, since NaCT is a relatively minor citrate transporter in mice, the use of specific NaCT inhibitors in mice will likely underestimate the potential effects in humans.
Using fasting rats, we demonstrated that the flux of plasma citrate also minimally contributes to liver citrate. The total lipids extracted from rat liver contained a lower density of 14C radioactivity than those from kidney and testes. It is known that liver is the major organ synthesizing total lipids in rats, and its contribution is ∼37%.34 In contrast, kidneys contribute only 0.7%, and testes 0.1%.34 After taking tissue weight into consideration, liver should still contribute about 10‐fold more radioactivity than the kidney (3.7%/g liver vs. 0.38%/g kidney in rats). The old numbers were based on human liver and kidney weight (1470 and 308 g, respectively). As we are discussing rat physiology, the numbers are now updated based on rat liver and kidney weight (10 and 1.825 g, respectively). However, in this study the density of radioactivity in liver lipids is only 22% of that in kidney lipids. This finding again suggests that there is a large local pool of citrate in the liver that significantly dilutes the radioactivity from 14C‐citrate. In addition, since lipid synthesis mainly occurs in the cytoplasm, it is highly likely that the influx of plasma citrate contributed minimally to the citrate level in the cytoplasm of rat hepatocytes.
Here it is worth noting that the current study designs utilized fasted rodents and that circadian rhythms in citrate homeostasis associated with feeding might provide slightly different results. For example, after meals, plasma citrate concentrations have been reported to increase about 20% compared to that in fasting humans.35 In addition, it has been reported that glucagon stimulates citrate uptake by upregulating NaCT expression in rats.36
CONCLUSION
Hepatic cytoplasmic citric acid is an important biochemical precursor and physiological regulator that is associated with potential therapeutic implications. Understanding the kinetics of plasma citrate is generally useful in evaluating the potential effects of pharmacological perturbations in citrate flux.
From this work, we conclude that the liver is the major organ of citrate clearance in humans. We also conclude that plasma citrate could serve as a potential biomarker for NaCT inhibition, but that elevations in plasma citrate will partially offset the desired effect of inhibition at the level of flux. In addition, both modeling results in humans and experimental data in rodents indicate that influx of plasma citrate contributes marginally (relative to intracellular flux via the TCA cycle) to hepatic citrate concentrations. The specific molecular mechanism behind the metabolic benefits observed in NaCT knockout mice is unclear and further investigations are necessary to determine if the physiological effects can be explained by their exquisite sensitivity to cytoplasmic citrate concentrations. As such, future development of NaCT inhibitors should, at a minimum, focus on developing the quantitative relationship between NaCT function, cytoplasmic citrate concentrations, and downstream physiology (e.g., glycolysis, gluconeogenesis, and de novo lipogenesis).
Supporting information
Supporting Information
Supporting Information
Supporting Information
Supporting Information
Supporting Information
Acknowledgments
We thank James Gosset, Gianluca Nucci, Fatema Abdurrob, Yimin Zhu, and Qingyun Yan for their advice and assistance with these studies.
Conflict of Interest
The authors declare no conflicts of interest.
Author Contributions
Z.L., T.S.M., and D.M.E. wrote the article; Z.L. and T.S.M. designed the research; Z.L. and D.M.E. performed the research; Z.L. analyzed and modeled the data; D.M.E. contributed new reagents and analytical tools.
References
- 1. Birkenfeld, A.L. et al Deletion of the mammalian INDY homolog mimics aspects of dietary restriction and protects against adiposity and insulin resistance in mice. Cell Metab. 14, 184–195 (2011). [DOI] [PMC free article] [PubMed] [Google Scholar]
- 2. Sun, J. et al Mitochondrial and plasma membrane citrate transporters: discovery of selective inhibitors and application to structure/function analysis. Mol. Cell. Pharmacol. 2, 101–110 (2010). [PMC free article] [PubMed] [Google Scholar]
- 3. Willmes, D.M. & Birkenfeld, A.L. The role of INDY in metabolic regulation. Comput. Struct. Biotechnol. J. 6, e201303020 (2013). [DOI] [PMC free article] [PubMed] [Google Scholar]
- 4. Usenik, A. & Legisa, M. Evolution of allosteric citrate binding sites on 6‐phosphofructo‐1‐kinase. PLoS One 5, e15447 (2010). [DOI] [PMC free article] [PubMed] [Google Scholar]
- 5. Mlakar, T. & Legisa, M. citrate inhibition‐resistant form of 6‐phosphofructo‐1‐kinase from Aspergillus niger. Appl. Environ. Microbiol. 72, 4515–4521 (2006). [DOI] [PMC free article] [PubMed] [Google Scholar]
- 6. Sola, M.M. , Oliver, F.J. , Salto, R. , Gutierrez, M. & Vargas, A. Citrate inhibition of rat‐kidney cortex phosphofructokinase. Mol. Cell. Biochem. 135, 123–128 (1994). [DOI] [PubMed] [Google Scholar]
- 7. Nielsen, T.T. Plasma citrate in relation to glucose and free fatty acid metabolism in man. Danish Med. Bull. 30, 357–378 (1983). [PubMed] [Google Scholar]
- 8. Inoue, K. , Zhuang, L. & Ganapathy, V. Human Na+ ‐coupled citrate transporter: primary structure, genomic organization, and transport function. Biochem. Biophys. Res. Commun. 299, 465–471 (2002). [DOI] [PubMed] [Google Scholar]
- 9. Gopal, E . et al Expression and functional features of NaCT, a sodium‐coupled citrate transporter, in human and rat livers and cell lines. Am. J. Physiol. Gastrointest. Liver Physiol. 292, G402–408 (2007). [DOI] [PubMed] [Google Scholar]
- 10. Zwart, R. , Peeva, P.M. , Rong, J.X. & Sher, E. Electrophysiological characterization of human and mouse sodium‐dependent citrate transporters (NaCT/SLC13A5) reveal species differences with respect to substrate‐sensitivity and cation‐dependency. J. Pharmacol. Exp. Ther. 355, 247–254 (2015). [DOI] [PubMed] [Google Scholar]
- 11. Kramer, L. et al Citrate pharmacokinetics and metabolism in cirrhotic and noncirrhotic critically ill patients. Crit. Care Med. 31, 2450–2455 (2003). [DOI] [PubMed] [Google Scholar]
- 12. Apsner, R. et al Impairment of citrate metabolism in acute hepatic failure. Wien. Klin. Wochenschr. 109, 123–127 (1997). [PubMed] [Google Scholar]
- 13. Bauer, E. , Derfler, K. , Joukhadar, C. & Druml, W. Citrate kinetics in patients receiving long‐term hemodialysis therapy. Am. J. Kidney Dis. 46, 903–907 (2005). [DOI] [PubMed] [Google Scholar]
- 14. Rudman, D. et al Hypocitraturia in patients with gastrointestinal malabsorption. N. Engl. J. Med. 303, 657–661 (1980). [DOI] [PubMed] [Google Scholar]
- 15. Fegan, J. , Khan, R. , Poindexter, J. & Pak, CY. Gastrointestinal citrate absorption in nephrolithiasis. J. Urol. 147, 1212–1214 (1992). [DOI] [PubMed] [Google Scholar]
- 16. Jones, J.G. , Solomon, M.A. , Cole, S.M. , Sherry, A.D. & Malloy, C.R. An integrated (2)H and (13)C NMR study of gluconeogenesis and TCA cycle flux in humans. Am. J. Physiol. Endocrinol. Metab. 281, E848–856 (2001). [DOI] [PubMed] [Google Scholar]
- 17. Diraison, F. , Large, V. , Maugeais, C. , Krempf, M. & Beylot, M. Noninvasive tracing of human liver metabolism: comparison of phenylacetate and apoB‐100 to sample glutamine. Am. J. Physiol. 277, E529–536 (1999). [DOI] [PubMed] [Google Scholar]
- 18. Diraison, F. , Large, V. , Brunengraber, H. & Beylot, M. Non‐invasive tracing of liver intermediary metabolism in normal subjects and in moderately hyperglycaemic NIDDM subjects. Evidence against increased gluconeogenesis and hepatic fatty acid oxidation in NIDDM. Diabetologia 41, 212–220 (1998). [DOI] [PubMed] [Google Scholar]
- 19. Sunny, N.E. , Parks, E.J. , Browning, J.D. & Burgess, S.C. Excessive hepatic mitochondrial TCA cycle and gluconeogenesis in humans with nonalcoholic fatty liver disease. Cell Metab. 14, 804–810 (2011). [DOI] [PMC free article] [PubMed] [Google Scholar]
- 20. Befroy, D.E. et al Direct assessment of hepatic mitochondrial oxidative and anaplerotic fluxes in humans using dynamic 13C magnetic resonance spectroscopy. Nat. Med. 20, 98–102 (2014). [DOI] [PMC free article] [PubMed] [Google Scholar]
- 21. Mariano, F. et al Blood and ultrafiltrate dosage of citrate as a useful and routine tool during continuous venovenous haemodiafiltration in septic shock patients. Nephrol. Dial. Transplant. 26, 3882–3888 (2011). [DOI] [PubMed] [Google Scholar]
- 22. Eipel, C. , Abshagen, K. & Vollmar, B. Regulation of hepatic blood flow: the hepatic arterial buffer response revisited. World J. Gastroenterol. 16, 6046–6057 (2010). [DOI] [PMC free article] [PubMed] [Google Scholar]
- 23. Bligh, E.G. & Dyer, W.J. A rapid method of total lipid extraction and purification. Can. J. Biochem. Physiol. 37, 911–917 (1959). [DOI] [PubMed] [Google Scholar]
- 24. Merrill, A.L. & Watt, B.K. Energy Value of Foods: Basis and Derivation (U.S. Dept. of Agriculture, Washington, D.C, 1955). [Google Scholar]
- 25. Wright, E. Dietary citric acid. Nutr. (Lond) 29, 367–372 (1975). [Google Scholar]
- 26. Mazurek, M.P. et al Molecular origin of plasma membrane citrate transporter in human prostate epithelial cells. EMBO Rep. 11, 431–437 (2010). [DOI] [PMC free article] [PubMed] [Google Scholar]
- 27. Gordon, E.E. & Craigie, A. Effect of intravenous glucose on splanchnic and peripheral metabolism of endogenous pyruvate and citrate in patients with cirrhosis and in subjects without liver disease. J. Lab. Clin. Med. 55, 841–848 (1960). [PubMed] [Google Scholar]
- 28. Hamm, L.L. Renal handling of citrate. Kidney Int. 38, 728–735 (1990). [DOI] [PubMed] [Google Scholar]
- 29. Simpson, D.P. Citrate excretion: a window on renal metabolism. Am. J. Physiol. 244, F223–234 (1983). [DOI] [PubMed] [Google Scholar]
- 30. Pajor, A.M. Sodium‐coupled transporters for Krebs cycle intermediates. Annu. Rev. Physiol. 61, 663–682 (1999). [DOI] [PubMed] [Google Scholar]
- 31. Hess, B. Urinary citrate and citrate metabolism In Urinary Tract Stone Disease (eds. Rao N.P., Preminger G.M., Kavanagh J.P.) 181–184 (Springer, London, 2011). [Google Scholar]
- 32. Goldberg, H. , Grass, L. , Vogl, R. , Rapoport, A. & Oreopoulos, D.G. Urine citrate and renal stone disease. Can. Med. Assoc. J. 141, 217–221 (1989). [PMC free article] [PubMed] [Google Scholar]
- 33. Conte, A. , Roca, P. , Gianotti, M. & Grases, F. On the relation between citrate and calcium in normal and stone‐former subjects. Int. Urol. Nephrol. 21, 369–373 (1989). [DOI] [PubMed] [Google Scholar]
- 34. Gandemer, G. , Pascal, G. & Durand, G. Lipogenic capacity and relative contribution of the different tissues and organs to lipid synthesis in male rat. Reprod. Nutr. Dev. 23, 575–586 (1983). [DOI] [PubMed] [Google Scholar]
- 35. Thomassen, A. et al Circadian plasma citrate rhythms in juvenile diabetics. Acta Med. Scand. 210, 163–171 (1981). [DOI] [PubMed] [Google Scholar]
- 36. Neuschafer‐Rube, F. et al The mammalian INDY homolog is induced by CREB in a rat model of type 2 diabetes. Diabetes 63, 1048–1057 (2014). [DOI] [PMC free article] [PubMed] [Google Scholar]
Associated Data
This section collects any data citations, data availability statements, or supplementary materials included in this article.
Supplementary Materials
Supporting Information
Supporting Information
Supporting Information
Supporting Information
Supporting Information