

Abstract
Purpose
RG7112 is a small-molecule MDM2 antagonist. MDM2 is a negative regulator of the tumor suppressor p53 and frequently overexpressed in leukemias. Thus, a Phase I study of RG7112 in patients with hematologic malignancies was conducted.
Experimental Design
Primary study objectives included determination of the dose and safety profile of RG7112. Secondary objectives included evaluation of pharmacokinetics, pharmacodynamics, such as TP53-mutation status and MDM2 expression, and preliminary clinical activity. Patients were divided into 2 cohorts: Stratum A (relapsed/refractory AML (except APL), ALL, and CML) and Stratum B (relapsed/refractory CLL/sCLL). Some Stratum A patients were treated at the MTD to assess clinical activity.
Results
RG7112 was administered to 116 patients (96 patients in Stratum A and 20 patients in Stratum B). All patients experienced at least 1 adverse event, and 3 DLTs were reported. PK analysis indicated that twice-daily dosing enhanced daily exposure. Anti-leukemia activity was observed in the 30 patients with AML assessed at the MTD included 5 patients who met IWG criteria for response. Exploratory analysis revealed TP53 mutations in 14% of Stratum A patients and in 40% of Stratum B patients. Two patients with TP53 mutations exhibited clinical activity. p53 target genes were induced only in TP53 wild-type leukemic cells. Baseline expression levels of MDM2 correlated positively with clinical response.
Conclusions
RG7112 demonstrated clinical activity against relapsed/refractory AML and CLL/sCLL. MDM2 inhibition resulted in p53 stabilization and transcriptional activation of p53-target genes. We provide proof-of-concept that MDM2 inhibition restores p53 function and generates clinical responses in hematologic malignancies.
Keywords: MDM2, p53, clinical trial, leukemia
Introduction
The tumor suppressor p53 plays a pivotal role in preventing cancer development. P53 is a transcription factor activated by cellular stress that regulates multiple downstream targets implicated in cell cycle control, apoptosis, DNA repair and senescence (1). Inactivation of p53 occurs frequently in cancer cells (2), leading to uncontrolled proliferation and escape from apoptosis. In non-stressed cells, the level of p53 is tightly controlled by murine double minute 2 homologue (MDM2). MDM2 is a key negative regulator of p53 that directly binds the transactivation domain to inhibit its activity (3). Moreover, MDM2 targets p53 for proteasomal degradation through its E3 ubiquitin-ligase activity (3, 4). Blocking the p53-MDM2 interaction may overcome the oncogenic consequences of MDM2 overproduction as well as the pathways associated with inhibiting functional p53, thus restoring p53 tumor-suppressor function (5).
RG7112 is a potent and selective antagonist of the p53-MDM2 interaction that belongs to the Nutlin family of compounds (6–8). RG7112 binds the p53 pocket on the surface of MDM2 and mimics the interaction of three amino acid residues (Phe19, Trp23 and Leu26) that are critical for binding of MDM2 to p53, hence effectively preventing their interaction (9). Treatment of cultured human cancer cells harboring wild type p53 with RG7112 leads to stabilization and accumulation of p53, blocks cell cycle progression in the G1 and G2 phases and induces apoptosis (6). Additionally, preclinical leukemia models have demonstrated sensitivity to RG7112 with rapid induction of apoptosis (6). Moreover, overexpression of MDM2 occurs frequently in human leukemias (10). We previously demonstrated sensitivity to apoptosis in vitro in acute myeloid leukemia (AML) (11)and chronic lymphocytic leukemia (CLL) upon exposure to Nutlin-3a (12), the first MDM2 antagonist (11). Here, we present the Phase 1, open-label, dose-escalation trial of RG7112 in patients with relapsed/refractory AML, acute lymphocytic leukemia (ALL), chronic myelogenous leukemia-blast crisis (CML-BC) and chronic lymphocytic leukemia/small cell lymphocytic leukemia (CLL/sCLL).
Patients and Methods
The primary objectives of this Phase 1 study (NCT00623870) were to determine the maximum tolerated dose (MTD), the dose limiting toxicities (DLTs) and the safety profile of RG7112. The secondary objectives included evaluation of pharmacokinetic (PK) parameters and pharmacodynamic markers for the original crystalline and an alternative amorphous formulation of the compound and assessment of preliminary clinical activity.
Patients and Study Design
NO21279 was a dose-escalation design with two strata: (A) acute leukemias, including AML, ALL and CML-BC (excluding acute promyelocytic leukemia [APL]); and (B) chronic leukemias, including CLL and sCLL (Supplementary Table 1). All patients were previously treated with relapsed and/or refractory disease and were not considered to be candidates for standard therapies. The trial implemented standard inclusion/exclusion criteria (see Supplementary Methods. Patients signed informed consent, and the study was conducted in accordance with the principles of the “Declaration of Helsinki” and Good Clinical Practice (GCP). RG7112 is a CYP3A4 substrate and inhibitor. Patient did not receive other drugs from these classes where feasible (see Supplementary Methods).
Dosing
The starting dose for the first cohort in both strata was 20 mg/m2 of the crystalline formulation of RG7112, administered orally once-daily (QD). Dose escalation within each stratum initially used the crystalline formulation and an accelerated dose-titration design until Grade 2 toxicity was demonstrated. This protocol was followed by escalation using a standard 3 + 3 design. RG7112 was administered with or without food, dependent on the specific version of the protocol. There was no intrapatient dose escalation.
PK data from a concomitant bioavailability and food-effect study using alternative formulations of RG7112 (NP25299) suggested that an amorphous formulation of RG7112 may improve the variability of exposure seen with the crystalline formulation of the compound used in this study (13). These data also indicated that administering RG7112 with a high-fat, high-calorie meal improved exposure and variability (13). Therefore, after starting this study, the protocol was amended to include the evaluation of an alternative, amorphous formulation of RG7112 in Stratum A patients and to evaluate the effect of dosing with a high-fat/high-calorie meal.
RG7112 was dosed orally for 10 days (initially for PK purposes, one single dose was added on day -3 in Cycle 1) followed by 18 days of rest in a 28-day cycle (Supplementary Table 1). Dose escalations and consideration of DLTs and MTDs were conducted independently for each stratum. Additionally, the dosing schedule was changed to twice-daily (BID) to improve absorption and gastrointestinal (GI) tolerance at doses greater than 1000 mg/m2. When BID dosing was implemented, the single dose on day -3 was removed. For purposes of PK evaluation in patients receiving BID dosing, only one morning dose was given on day 10 in Cycle 1. For the crystalline formulation, doses of 20 to 1920 mg/m2/day RG7112 were administered either as a single dose on Day -3 (followed by a 72-h washout) then QD for 10 days (Day 1–10) or BID for 10 days (no Day -3 dosing). When dosing began with the amorphous escalation in Stratum A, the dose was changed to a BID (1000 mg or 1500 mg) flat dose for convenience. Another 28 Stratum A patients were treated at the MTD in the efficacy extension, or tail portion, of the study to explore early signals of efficacy. TP53 status was analyzed in blood samples for all patients and in bone marrow samples for patients in the amorphous escalation and the tail. At least 16 patients with wild-type p53 AML or ALL were accrued into the efficacy extension cohort as defined by the protocol (Supplementary Table 1).
Assessments
The study was conducted at 12 centers: 5 in the United States, 3 in the United Kingdom, 2 in Canada and 2 in Italy. During screening, patients were assessed by bone marrow aspirates, biopsies and hematology assessments to confirm leukemia status. For Stratum B patients, imaging was performed for staging per investigator discretion. Adverse events (AEs), physical examinations and blood work were assessed approximately weekly for the first three 28-day cycles and at the beginning and end of treatment dosing in cycle 4 and beyond. Patients were also examined for QTc elongation.
Safety
Adverse events (AEs) were graded according to the National Cancer Institute’s Common Terminology Criteria for Adverse Events (NCI-CTCAE), version 3.0 (14). Monitoring of AEs continued for up to 28 days after the last dose of a study drug had been administered or until any ongoing event resolved or stabilized. DLTs were assessed during the first treatment cycle (see Supplementary Methods).
Efficacy analysis
In Stratum A patients, efficacy by a hematology assessment and bone marrow assessment (performed at investigator’s discretion after cycle 2) every 28 days prior to the start of each cycle was evaluated according to the International Working Group criteria (15). Patients were scored as having a complete response (CR), and CR without full platelet recovery (pCR) or a partial response (PR). Although not defined in the protocol, the morphologic leukemia-free state (MLFS), or clearance of bone marrow blasts without recovery of normal peripheral counts, was also assessed as a category of partial response (PR).
Tumor responses in patients in Stratum B were evaluated according to NCI-Working Group criteria (16) every 28 days prior to the start of each subsequent cycle. Imaging for response assessment was performed at the discretion the investigator.
Pharmacokinetic analysis
Plasma PK assessments were conducted for all patients during the first cycle of treatment on the first and last day of dosing immediately prior to dosing, and at multiple post dose time points for measurements of RG7112 concentrations using a validated LC/MS/MS method. Bone marrow PK assessments for RG7112 were performed for all patients prior to the start of dosing in Cycle 1 and 2 and prior to dosing on the last dosing day (Day 10) in Cycle 1. Bone marrow samples for RG7112 were assayed using a method modified from the plasma PK assay.
The following PK parameters were estimated using standard non-compartmental methods: AUCinf - the area under the plasma concentration-time curve from 0 to infinity; AUCτ - the area under the plasma concentration-time curve over one dosing interval; Cmax - maximum observed plasma concentration; tmax - time to reach maximum plasma concentration; and t1/2 - terminal half-life, computed as (ln 2)/kel, where kel - apparent elimination rate, computed as the magnitude of the slope from the log-linear regression of the apparent terminal elimination phase of the plasma concentration-time curve.
Pharmacodynamic analysis
Pharmacodynamic samples were collected before and after administration of RG7112 to measure MIC-1 (macrophage inhibitor cytokine-1) protein in serum using ELISA and reported as percent of change from baseline due to large interpatient variability in baseline MIC-1 levels.
Biomarker analysis
In patients that received the crystalline formulation of RG7112, analysis of TP53 mutations was performed on Miltenyi magnetic-activated cell sorting (MACS) (CD33 or CD34 antibody for selection of AML and CD19 for ALL/CLL)-separated blood. In patients from the amorphous escalation and tail groups, analysis of TP53 mutations was obtained from BD Vacutainer Cell Preparation Tubes (CPT)-separated blood and MACS-separated bone marrow. This analysis was performed by Caris Life Sciences (Phoenix, AZ, USA) using the PCR-based TP53 test. This test reports single nucleotide substitutions or deletions in exons 2–11 and their splice sites (17).
Exploratory analysis of mRNA levels for a panel of 24 direct and indirect p53 target genes (Supplementary Table 2) were evaluated in all patients by qRT-PCR from pre- and post-dose MACS-separated blood and bone marrow using Applied Biosciences Taqman Low-Density Array (TLDA) cards, in which all samples from each patient were analyzed concurrently (i.e., at 0, 6, 24, 48, 240 [day 10], 246 [day 10 + 6 h] and 264 [day 11] h).
MDM2-mRNA concentrations were assessed in amorphous escalation and tail by qRT-PCR with 50-ng total RNA from blood samples collected into Paxgene tubes and MACs-isolated leukemia cells from bone marrow. TaqMan (Invitrogen, Carlsbad, CA, USA) probes were designed to detect MDM2 mRNA and the reference mRNA, beta-glucuronidase, simultaneously using two different fluorescent reporters. Relative gene expression was calculated based on delta Ct of mdm2 to housekeeping gene.
In selected samples with sufficient available cells, immunoblot analysis for BBC3 and TP53 was performed, and induction of apoptosis was determined by flow cytometry of annexin V and propidium iodide as described previously (11).
Statistical analyses
Standard summary statistics were calculated and presented for PK, safety, demography and biomarker data. Spearman’s correlation coefficients were calculated for MIC-1 vs AUCSS and for best response in AML patients vs relative gene expression levels of MDM2. P-values were calculated using the null hypothesis of Spearman’s correlation coefficient = 0. No adjustments were made for multiple comparisons.
For biomarker analysis, the statistical analysis approach was used to analyze the peak fold change over all follow-up time points of each patient. Consequently, average peak fold changes were calculated and reported. Genes with a fold change ≥ 2 and p value ≤ 0.01 were considered significantly induced or suppressed.
A linear mixed model was used to analyze mRNA level fold changes of all the follow-up time points relative to the baseline, assuming a linear relationship between fold changes and the logarithms of the assigned dose levels. Fold changes for the same patient over different followup time points were assumed to be similar, and their averages were calculated and the average fold changes at the maximum tolerated dose (MTD) are reported.
Results
A total of 116 patients were enrolled into either Stratum A (N = 96) or Stratum B (N = 20) of this dose-escalation study, inclusive of efficacy extension testing in the tail cohort. TP53 testing of the patients in the tail assured that at least 16 patients with wild-type p53 AML were treated (Supplementary Table 3). This population was heavily pretreated having at least one previous cancer therapy regimen: mean (SD) of 3.4 ±1.98 and 4.7 ± 2.92 for Stratum A and Stratum B, respectively (Supplementary Table 4).
Safety results
All patients enrolled in the study (N = 116) were safety-evaluable and experienced at least 1 AE, with 81 of 116 patients experiencing Grade 3 AEs regardless of attribution and 34 of 116 patients experiencing Grade 4 AEs across all cohorts during all cycles of therapy (Table 1; Supplementary Table 5). Serious adverse events (SAEs) were reported in 82 patients across all cohorts. The most frequently reported SAEs (> 10% of patients) were febrile neutropenia and pneumonia. Eighteen patients discontinued the study due to an AE, most commonly (> 3%) febrile neutropenia (3 patients) and pneumonia (3 patients). Most of the AEs leading to discontinuation were of Grade 3 (8 patients) or Grade 4 (7 patients) severity; however, 3 patients with Grade 2 AEs (nausea, abdominal pain and atrioventricular block) were also discontinued from the study.
Table 1.
On-study adverse events > 10% of total and Grade 3 or 4 (all patients)
| TOTAL, n (%) | Grade 3, n (%) | Grade 4, n (%) | |
|---|---|---|---|
| Total | 116 (100) | 81 (70) | 34 (29) |
| Nausea | 79 (68) | 11 (9) | 0 |
| Diarrhea | 65 (56) | 8 (7) | 0 |
| Vomiting | 42 (36) | 6 (5) | 0 |
| Fatigue | 34 (29) | 5 (4) | 0 |
| Abdominal pain | 31 (27) | 10 (9) | 1 (< 1) |
| Febrile neutropenia | 31 (27) | 22 (19) | 3 (3) |
| Decreased appetite | 29 (25) | 2 (2) | 0 |
| Hypokalemia | 25 (22) | 11 (9) | 3 (3) |
| Headache | 20 (17) | 1 (< 1) | 0 |
| Pneumonia | 20 (17) | 14 (12) | 2 (2) |
| Pyrexia | 18 (16) | 5 (4) | 0 |
| Epistaxis | 15 (13) | 2 (2) | 0 |
| Hypomagnesemia | 15 (13) | 2 (2) | 0 |
| Anemia | 14 (12) | 6 (5) | 4 (3) |
| Thrombocytopenia | 15 (13) | 3 (3) | 9 (8) |
| Hypotension | 14 (12) | 5 (4) | 0 |
| Hypocalcemia | 14(12) | 5(4) | 0 |
| Asthenia | 13 (11) | 1 (< 1) | 0 |
| Constipation | 13 (11) | 1 (< 1) | 0 |
There were 3 DLTs in Stratum A in this study: Grade 4 pericarditis in 1 patient and Grade 3 nausea in 2 patients. These events were all considered to be related to study treatment. As mentioned previously, a fourth patient in Stratum A experienced laboratory abnormalities consistent with tumor lysis syndrome, which met DLT laboratory criteria, and the protocol was subsequently amended. There were no clinically relevant imbalances in AEs between Stratum A cohorts treated with a QD or BID dosing regimen. The MTD of 1500 mg BID in Stratum A was based on GI tolerability, and the severity of the AEs was related to exposure. The same proportion of patients treated at the MTD also experienced AEs leading to study discontinuation as those enrolled in Stratum A overall. For Stratum B patients, escalation was halted without DLTs due to excessive pill burden, moderate exposure levels and limited clinical activity. The highest dose level tested was 1920 mg/m2 BID. Review of QTcF data revealed no evidence of dose or exposure effects after treatment with RG7112.
Thirty-one deaths occurred on study, none of which were considered to be related to the study treatment. The majority of deaths in the study (17/31) were due to disease progression, an additional 5 were due to underlying disease. Twenty-seven of these 31 deaths occurred in the Stratum A, 14 of which occurred at the MTD. Other primary causes of death reported in Stratum A included common complications of relapse leukemia including pneumonia (n = 1), septic shock (n = 1), cerebral hemorrhage (n = 1), subdural hemorrhage (n =1), acute renal failure (n = 1), clostridium difficile colitis (n =1) and fungal infection (n = 1). There were 4 deaths on study in Stratum B, including 2 patients with disease progression and 1 patient with pneumonia and pulmonary sepsis. The fourth patient died due to hemorrhagic stroke related to ongoing thrombocytopenia.
Efficacy dose escalation/extension results
Stratum A
During dose escalation, evidence of clinical anti-leukemia activity was evident, with a reduction in peripheral blast counts. Most patients had return of leukemia prior to initiating a second cycle. One patient with AML in the dose-escalation cohort obtained CRp and continued on therapy for 6 cycles before relapsing.
Forty-three Stratum A patients were treated at the MTD dose 1500 mg BID (including dose escalation and extension). Of these, 5 patients died prior to hematologic malignancy evaluation (day 28) and could not be assessed. An additional 5 patients withdrew early due to a variety of reasons (e.g., AE, hospice decision). In total, 33 patients treated at the MTD dose were evaluable for hematologic malignancy response (Supplementary Table 3). In this evaluable group, 30 patients had a diagnosis of AML, two patients obtained CR, and 1 patient obtained CRp for a CR rate of 10% (3/30). Two patients obtained PRs, one of which was considered MLFS without peripheral recovery, for a marrow clearance rate of 13% (4/30). All responses occurred within the first cycle of therapy. Nine patients had stable disease. Sixteen patients progressed during the first cycle of treatment including two prior to complete dosing. The 2 CR patients were able to bridge to allogeneic transplant, with one engrafting with a maintained remission. There were 3 patients with diagnosis of ALL; 2 had stable disease and 1 progressed on study.
Clinical activity, including CRs, occurred in patients who were primary refractory to 1 or 2 cytarabine-containing chemotherapy regimens. RG7112 also demonstrated clinical activity in extremely poor prognosis patients with multiple relapses and therapy-related disease (Supplementary Table 3). Most responses were observed after the initial cycle of treatment.
Stratum B
Patients in Stratum B also demonstrated evidence of clinical activity, including decreases in peripheral lymphocyte counts, although most of these were transient. Of the 19 patients assessed, 1 patient with CLL (history of prior Richter’s transformation) had PR and continued on treatment for 25 cycles. Fifteen patients had stable disease, ranging from 2 to 6 cycles, and 3 patients progressed during the first cycle. Even at the highest doses tested (1920 mg/m2), exposures in CLL patients were lower than the anticipated therapeutic range, complicating a true assessment of anti-leukemic activity in this heavily pretreated CLL population.
Pharmacokinetic and pharmacodynamic results
We examined the PK of RG7112 in two formulations. The mean PK profiles by dose following drug administration at steady-state (Day 10) are presented in Supplementary Data 5. PK parameters are summarized in Supplementary Fig. 1. The dose-exposure (Cmax, Ctrough and AUC) relationship was approximately linear (Fig. 1A), although there was high interpatient variability (CV approximately 70%). A possible absorption plateau was evident when doses exceeded 810 mg/m2. The median half –life (t ½) was 1 – 1.5 days. Accumulation was not apparent. BID dosing enhanced daily exposure (Supplementary Fig. 1).
Figure 1.
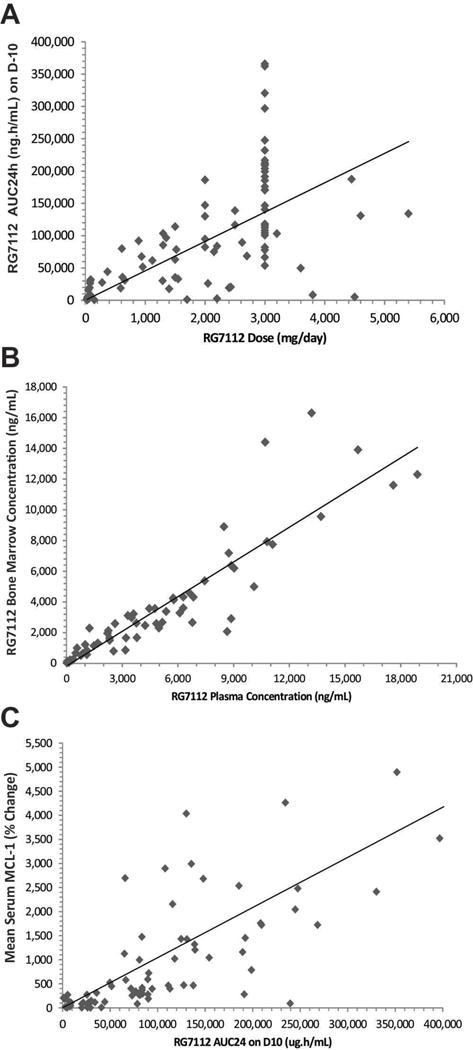
RG7112 pharmacokinetics and pharmacodynamics data. A, Correlation between RG7112 dose (mg/day) and exposure (AUC2 24 h [ng/h/mL]) for Stratum A and Stratum B on day 10. The diamonds represent individual patients. B, Correlation between RG7112 levels in bone marrow (ng/mL) and plasma concentration (ng/mL). The diamonds represent individual patients. C, Correlation between mean serum MIC-1 levels (% change) and RG1172 plasma levels (AUC24 [μg/h/mL] on day 10. The diamonds represent individual patients. MIC-1, macrophage inhibitory cytokine-1; AUC, area under curve; D, day.
For patients treated at MTD, a single-dose regimen of 1500 mg BID for 10 days of an amorphous formulation yielded an average AUC24 of 175,529 ng/h/mL (N = 30 evaluable for PK, CV 47%) on Day 10. The predicted minimum target exposure for efficacy based on animal models was an AUC24 of 200,000 ng/h/mL. Of the patients treated at the MTD, only 11 out of 30 (37%) appeared to have adequate exposure. In AML patients, the patient’s best response correlated with steady-state AUC (Spearman’s correlation coefficient = −.47 and P = .0001). AML patients treated at the MTD that showed clinical activity (CR, CRp, PR and SD) had higher median steady-state AUC than patients that progressed, 221,691 ng/h/mL versus 113,885 ng/h/mL, respectively (Supplementary Tables 6 and 7).
The bone marrow level of RG7112 changed as a function of plasma concentration (Fig. 1B) or dose (data not shown) and was approximately 50% of the blood level at high doses/exposures. Serum levels of MIC-1, a secreted protein that is strongly induced by activated p53 (18), were used to assess pharmacodynamic effects of RG7112. Daily dosing yielded higher MIC-1 levels on the last day of dosing, which was partially due to an accumulation of MIC-1 (median t1/2 = 46 h). Analysis of patients on 10-day consecutive dosing of 20 to 2430 mg/m2/day (given as 1215 mg/m2 BID) showed that the minimum level of RG7112 required for p53 induction was 320 mg/m2/day. MIC-1 levels were elevated at RG7112 plasma concentrations of > 2 μg/mL or AUC24 > 50,000 ng/h/mL, highly correlated with exposure (AUC24) at steady state (Fig. 1C). MIC-1 levels in serum (from both tumor and normal cellular sources) did not correlate with clinical activity.
Biomarker results
TP53 mutational analysis identified TP53 mutations in 19 of 96 patients tested, with more mutations detected in Stratum B patients 40% (6 of 15) than in Stratum A patients 16% (13 of 81; Supplementary Table 8). Each mutation was only detected once, and 2 patients had 2 different mutations. There were 2 patients whose blood and bone marrow results were discordant with mutation in the bone marrow and wild type in the blood. This difference is likely related to malignant cell prevalence discrepancy between bone marrow and blood, as one patient had no peripheral blasts and the other patient had low peripheral blasts.
Most patients with mutant p53 failed to show evidence of response. Two AML patients with p53 mutations demonstrated clinical activity by decreased peripheral blast counts, but none had sustained clinical improvement. Patient 8421, with an R175H mutation, had 43% peripheral blasts on day 1, and after receiving 9 doses the peripheral blasts of this patient decreased to 0% on day 22. This patient also had tumor lysis syndrome. Patient 8635 showed a decrease in peripheral blasts from 42% on day 1 to 14% on day 28. Patient 9604 with sCLL/CLL and prior history of transformation to large-cell lymphoma (Richter’s transformation), which was not evident at the time of treatment with RG7112, had a 2-bp splice deletion in p53. The patient began treatment in cohort 2 and continued for 25 cycles (over 2 years) with stable disease by clinical exam and PET CT. Although not part of the study procedures, a repeated p53 analysis upon progression demonstrated the same 2-bp deletion in p53 and no additional p53 abnormalities.
The release of p53 from the p53-MDM2 complex also activates MDM2 expression. Relative MDM2 gene expression levels analyzed by RT-PCR were significantly increased after treatment (P < .001). In blood, the MDM2 relative median gene expression levels increased 1.9-fold from baseline at day 2 (24 h post dose) and 2.8-fold on day 10 (the last day of dosing). In bone marrow, the MDM2 relative median gene expression levels increased 2.0-fold on day 10. The increase in MDM2 expression levels at day 10 of Cycle 1 in the blood (n = 34) of Stratum A patients correlated with exposure (Fig. 2a; Pearson’s correlation coefficient = .57 and P = .0005). A correlation was also seen with bone marrow (n = 16) on day 10 (Spearman’s correlation coefficient= .59 and P = .02). There was a trend on day 2 (24 h post dose,) for increase in MDM2 expression levels to correlated with the p53-activation biomarker MIC-1 in the blood, albeit with lower significance than with exposure (Fig. 2b, Pearson’s correlation coefficient = .29 and P = .11).
Figure 2.
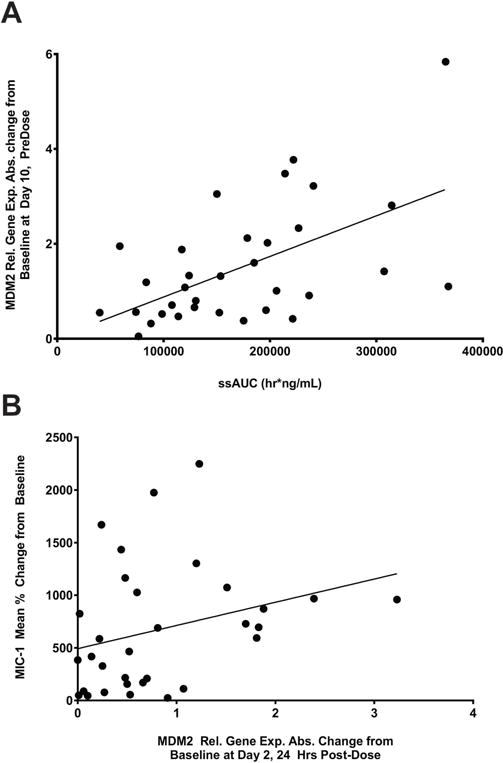
Increased drug exposure to RG7112 correlates with increased MDM2 mRNA levels. A, Scatter plot of the absolute change from baseline of MDM2 relative gene expression levels at day 10 pre-dose of cycle 1 in the blood vs AUCss (hr/ng/mL) of Stratum A patients. The circles represent individual patients. AUCss,area under curve at steady state; MDM2,murine double minute 2. B, Scatter plot of the absolute change from baseline of MDM2 relative gene expression levels at day 2 24 h post-dose in the blood vs MIC-1 of Stratum A patients. The circles represent individual patients. MIC-1,macrophage inhibitory cytokine-1; MDM2,murine double minute 2.
Table 2 shows the baseline MDM2 relative gene expression level in blood separated by response. In the limited number of samples tested, the best response in AML patients showed a trend with the relative mean gene expression levels of MDM2 in blood at baseline. The best response also correlated (P = .03) with the absolute change in MDM2 relative mean gene expression in blood on day 10. Biomarker analyses were for exploratory purposes only. No adjustment was made for multiple comparisons.
Table 2.
Baseline relative MDM2 gene expression by best hematological response in the blood of AML patients
| CR (N = 3) |
CRp (N = 2) |
PR (N = 3) |
SD (N = 21) |
PD (N = 40) |
MS (N = 15) |
Overall (N = 84) |
|
|---|---|---|---|---|---|---|---|
| n | 2 | 1 | 2 | 10 | 17 | 9 | 41 |
| Mean | 1.66 | 0.73 | 0.75 | 0.8 | 0.54 | 0.64 | 0.7 |
CR, complete response; CRp, complete response without full platelet recovery; PR, partial response; SD, stable disease; PD, progressive disease; MS, missing or assessment not done; MDM2, murine double mutant 2; AML, acute myelogenous leukemia
Induction of p53, p53 targets and apoptosis
MDM2 inhibition is expected to increase cellular p53 levels, activate p53-target genes and induce apoptosis in leukemia cells (11, 12, 19). The statistical analysis for the peak fold change over all the follow-up time points of each patient was assessed using patients who were assigned to a dose of 810 mg BID or higher (Fig. 3). Among these patients, a dose higher than 810 mg BID did not change gene expression significantly. As shown in Fig. 3A, 10 genes were significantly induced (≥ 2-fold induction above baseline and P ≤ 0.01) in response to RG7112 treatment, all of which are known p53 targets. The cell cycle regulator CDKN1A and the pro-apoptotic BH3 protein BBC3/PUMA were strongly (> 5-fold) induced genes. Because MDM2 inhibitors, such as RG7112, act by inhibiting p53 degradation but not p53 transcription, the mRNA levels of p53 and housekeeping GAPDH were not significantly affected by treatment, as expected. Importantly, these 10 genes were induced only in p53 wild-type, and not in p53-mutant, samples (Fig. 3B), consistent with specificity for RG7112 as an inducer of p53. The modest induction of CDKN1A (maximal 3-fold) may suggest a cell cycle effect in these cells (Fig. 3B).
Figure 3.
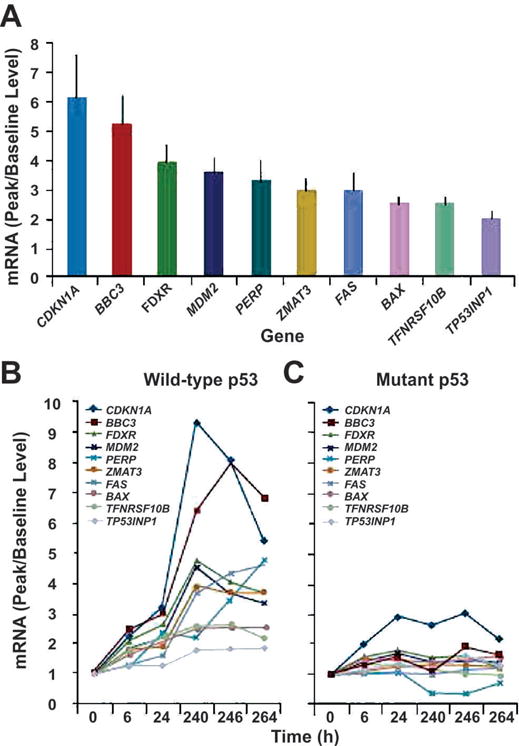
RG7112 induces p53 target gene expression in circulating leukemia blasts. A, mRNA expression levels (peak relative to baseline expression) of p53-target genes significantly induced in leukemia samples. B, Expression of p53-target genes in p53 wild-type samples (left) and p53 mutant samples. Gene induction occurred in a wild-type p53 manner. No genes were significantly induced in p53-mutant samples.
Next, we investigated time-course changes of these 10 induced genes. As shown in Fig. 3B, gene induction occurred as early as 6 hours of treatment and reached a peak after 10 days of therapy (240 – 264 h). For the purpose of biomarker analysis of only p53-target genes, clinical activity was defined as 50% reduction in blasts. The strongest induction of p53-target genes was observed in leukemic cells with wild-type p53 for the p53-target genes BAX, BBC3 (PUMA), FDXR, MDM2 and ZMAT3 (Fig. 3B). Activation of these genes occurred within 6 h of treatment (Fig. 3B). The death domain-carrying and apoptosis-inducing genes, FAS and TNFRSF10B, in addition to the cell cycle-related, p53-target gene CDKN1A, peaked within 10 to 11 days (Fig. 3A). Another p53-target gene, TP53NP1, was activated at 10 to 11 days. Patients who showed signs of clinical activity vs non-responders with wild type p53 differentially expressed increased levels of PMA-induced protein 1 (PMAIP1) (2.3×; P = .0047), which binds to MCL-1 and promotes activation of caspases and apoptosis. Other cell cycle or apoptosis-related genes, such as XPO1 or APAF1, were not affected. Table 3 shows the list of genes induced in patients with wild type p53 treated at MTD (1500mg/m2 BID, n=20), with serial samples available. With the exception of three genes (i.e., PERP, FAS, and TPINP1), the list of genes is shown in Fig. 3.
Table 3.
mRNA fold-changes (average over all time points) in p53-target genes in wild type p53 leukemia samples at MTD
| Gene | Fold change | Standard error | P-value |
|---|---|---|---|
| BAX | 1.85 | 0.15 | < .0001 |
| BBC3 | 3.67 | 0.60 | < .001 |
| CDKN1A | 3.95 | 0.83 | .0005 |
| FDXR | 2.63 | 0.35 | < .0001 |
| MDM2 | 2.37 | 0.23 | < .0001 |
| TNFRSF10B | 1.82 | 0.19 | < .0001 |
| ZMAT3 | 2.09 | 0.24 | < .0001 |
Induction of PUMA and TP53, followed by apoptosis, was documented in the limited samples available by immunoblot and flow cytometry analysis. Supplementary Fig. 2 shows induction of PUMA and apoptosis in a patient with CLL whose white blood count decreased by > 50%.
Discussion
In this Phase 1 study of RG7112, an MDM2 antagonist, we have demonstrated proof-of-concept in AML, with activation of p53 target genes and complete remissions in extremely poor prognosis, relapsed/refractory patients. Activity was also seen in patients with CLL/sCLL. Responses in patients with acute leukemia allowed normal recovery of peripheral counts and bridging to allogeneic transplantation. While active, this oral compound had significant GI toxicity including nausea, vomiting and diarrhea, which required prophylaxis and treatment. The MTD was based on GI tolerance. Variability in exposure at the MTD limited some patients from achieving target therapeutic exposures, which is apparent from AUC24 data for the overall response group (CR, PR, SD or HI [hematologic improvement]) at the MTD vs those patients who progressed during the initial cycle.
No molecular marker(s) has yet been identified, which predicts response to an MDM2 antagonist. Data collected for chromosomal (e.g., translocations) and molecular (e.g., FLT3 mutations) leukemic prognostic markers did not demonstrate any predictive value to differentiate between the responders vs non-responders in this Phase 1 study. This class of agents is only predicted to be effective in patients with at least 1 wild-type TP53 allele. However, wild-type TP53 status alone does not predict response to MDM2 antagonists. Evidence of activity in patients with p53 mutation could be due to multiple clones being present, (only some of which are mutant), mutation in a single allele with retention of the wild-type allele, or that certain TP53 mutations may still have functional p53 activity and the ability to respond. A marker of functional TP53 activity that can be correlated with response in patients with wild type, and possibly mutant, protein needs to be identified. Elevation of MDM2 in leukemia cells at baseline correlated with clinical response in this small population of patients, as previously reported by us in vitro (12), but it was not sufficient as a single predictive marker of sensitivity to treatment with an MDM2 antagonist. A 4-gene molecular signature that includes MDM2 is currently being investigated as a potential predictor of sensitivity (20). In this study a total of 10, among 24, genes were significantly changed in a wild-type p53 manner. All of the 10 genes have been shown to be p53 targets, and results provided a proof of concept that MDM2 inhibition by RG7112 activates p53 in vivo and induces a broad panel of p53 target genes in leukemia cells. The target gene induced most effectively, CDKN1A (p21), is a critical cell cycle regulator, which may counteract induction of apoptosis (21, 22).
An important question for the long-term use of MDM2 antagonists in cancer patients is whether an MDM2 antagonist may select for a mutant population of tumor cells. While this study was not designed to answer that question, one CLL/sCLL patient with a 2-bp p53 deletion maintained stable disease for more than 2 years. Repeat analysis of p53-mutational status in the tumor at progression showed the identical mutation and no new mutations.
While RG7112 has demonstrated activity as a monotherapy in relapsed/refractory AML, the future development of MDM2 antagonists for treatment of leukemia will require combination therapies. Results of a study combining this compound with cytarabine (both low and intermediate doses) have been presented (23). Evidence for activity of combinations with non-chemotherapeutic targeted agents has been developed, including combinations (24–35). MDM2 is critical for normal hematopoiesis, and treatment with an MDM2 antagonist leads to significant marrow suppression of both leukemic and normal progenitors. As expected, complications of neutropenia and thrombocytopenia, including sepsis and hemorrhage, were seen in this heavily pretreated AML population. Monotherapy efficacy was also evident, including patients who achieved complete remissions with hematopoietic recovery and ability to bridge to transplant, warranting further evaluation of MDM2 antagonist therapy of acute leukemias.
The RG7112 molecule has several disadvantages, including a high dose required for efficacy leading to GI intolerance and variability of exposure at the MTD. To address these issues, development of the Nutlin MDM2 antagonists will continue with a more potent compound RG7388, which has an identical p53 binding properties and mechanism of action, and is now in Phase 1 clinical development in AML (35).
Supplementary Material
Translational Relevance.
The tumor suppressor p53 is frequently dysregulated in cancer. One of the mechanisms by which p53 activity can be restored is by inhibiting the interaction with its negative regulator MDM2, which is frequently overexpressed in leukemias. Here, we report the results of a multicenter Phase I proof-of-concept trial of RG7112, a small-molecule antagonist of MDM2. We demonstrate clinical activity in patients with relapsed/refractory leukemias, such as AML, ALL, CML and CLL, in which baseline MDM2 levels positively correlated with clinical response. Moreover, we show that inhibition of MDM2 activity can stabilize p53, activate p53-target genes and induce apoptosis, indicating that p53 tumor-suppressor function can be restored. However, TP53 status did not define response to RG7112. The results support further investigation of an MDM2 antagonist in heme malignancies.
Acknowledgments
We thank the patients who participated in this study and their families. Additionally, we thank Hagop M. Kantarijan, Susan O’Brien, Gautam Borthakur, Theresa McQueen, Mary A. Kelly, Lyubovir Vassilev, as well as the nurses, investigators and others on local study teams for their contributions to this trial.
Support
This work was supported in part by Hoffmann-LaRoche, Inc. and by grants from the National Institutes of Health (P01 CA49639 and CA16672) to M.A and by the Paul and Mary Haas Chair in Genetics to M.A. Support for third-party writing assistance for this manuscript was provided by Hoffmann-La Roche, Inc.
Footnotes
Note: Supplementary data for this article are available at Clinical Cancer Research Online (http://clincancerres.aacrjournals.org/).
Authors’ disclosures of potential conflict of interest: The authors report no conflict of interest regarding the data in this study.
Author Contributions
Conception and design: MA, GC, SB, PB, LJ, SM, MR, RR, JZ, GN
Collection or assembly of data: all
Data analysis and interpretation: MA, VR, GMNG, XH, KK, GC, SB, PB, LJ, SM, MR, RR, JZ, GN
Manuscript writing: all
Final approval of manuscript: all
References
- 1.Vogelstein B, Lane D, Levine AJ. Surfing the p53 network. Nature. 2000;408:307–10. doi: 10.1038/35042675. [DOI] [PubMed] [Google Scholar]
- 2.Xu-Monette ZY, Medeiros LJ, Li Y, Orlowski RZ, Andreeff M, Bueso-Ramos CE, et al. Dysfunction of the TP53 tumor suppressor gene in lymphoid malignancies. Blood. 2012;119:3668–83. doi: 10.1182/blood-2011-11-366062. [DOI] [PMC free article] [PubMed] [Google Scholar]
- 3.Marine JC, Lozano G. Mdm2-mediated ubiquitylation: p53 and beyond. Cell Death Differ. 2010;17:93–102. doi: 10.1038/cdd.2009.68. [DOI] [PubMed] [Google Scholar]
- 4.Momand J, Zambetti GP, Olson DC, George D, Levine AJ. The mdm-2 oncogene product forms a complex with the p53 protein and inhibits p53-mediated transactivation. Cell. 1992;69:1237–45. doi: 10.1016/0092-8674(92)90644-r. [DOI] [PubMed] [Google Scholar]
- 5.Chene P. Inhibiting the p53-MDM2 interaction: an important target for cancer therapy. Nat Rev Cancer. 2003;3:102–9. doi: 10.1038/nrc991. [DOI] [PubMed] [Google Scholar]
- 6.Tovar C, Graves B, Packman K, Filipovic Z, Higgins B, Xia M, et al. MDM2 small-molecule antagonist RG7112 activates p53 signaling and regresses human tumors in preclinical cancer models. Cancer Res. 2013;73:2587–97. doi: 10.1158/0008-5472.CAN-12-2807. [DOI] [PubMed] [Google Scholar]
- 7.Vassilev LT, Vu BT, Graves B, Carvajal D, Podlaski F, Filipovic Z, et al. In vivo activation of the p53 pathway by small-molecule antagonists of MDM2. Science. 2004;303:844–8. doi: 10.1126/science.1092472. [DOI] [PubMed] [Google Scholar]
- 8.Vu B, Wovkulich P, Pizzolato G, Lovey A, Ding Q, Jiang N, et al. Discovery of RG7112: A Small-Molecule MDM2 Inhibitor in Clinical Development. ACS Med Chem Lett. 2013;4:466–9. doi: 10.1021/ml4000657. [DOI] [PMC free article] [PubMed] [Google Scholar]
- 9.Fry DC, Wartchow C, Graves B, Janson C, Lukacs C, Kammlott U, et al. Deconstruction of a nutlin: dissecting the binding determinants of a potent protein-protein interaction inhibitor. ACS Med Chem Lett. 2013;4:660–5. doi: 10.1021/ml400062c. [DOI] [PMC free article] [PubMed] [Google Scholar]
- 10.Bueso-Ramos CE, Yang Y, deLeon E, McCown P, Stass SA, Albitar M. The human MDM-2 oncogene is overexpressed in leukemias. Blood. 1993;82:2617–23. [PubMed] [Google Scholar]
- 11.Kojima K, Konopleva M, Samudio IJ, Shikami M, Cabreira-Hansen M, McQueen T, et al. MDM2 antagonists induce p53-dependent apoptosis in AML: implications for leukemia therapy. Blood. 2005;106:3150–9. doi: 10.1182/blood-2005-02-0553. [DOI] [PMC free article] [PubMed] [Google Scholar]
- 12.Kojima K, Konopleva M, McQueen T, O’Brien S, Plunkett W, Andreeff M. Mdm2 inhibitor Nutlin-3a induces p53-mediated apoptosis by transcription-dependent and transcription-independent mechanisms and may overcome Atm-mediated resistance to fludarabine in chronic lymphocytic leukemia. Blood. 2006;108:993–1000. doi: 10.1182/blood-2005-12-5148. [DOI] [PMC free article] [PubMed] [Google Scholar]
- 13.Patnaik A, Tocher A, Beeram M, Nemunaitis J, Weiss G, Nichols G. Clinical pharmacology of RG7112, an MDM2 antagonist, in patients with advanced solid tumors. Proceedings of the 104th Annual Meeting of the American Association for Cancer Research. 2013;LB-201 [Google Scholar]
- 14.Trotti A, Colevas AD, Setser A, Rusch V, Jaques D, Budach V, et al. CTCAE v3.0: development of a comprehensive grading system for the adverse effects of cancer treatment. Semin Radiat Oncol. 2003;13:176–81. doi: 10.1016/S1053-4296(03)00031-6. [DOI] [PubMed] [Google Scholar]
- 15.Hallek M, Cheson BD, Catovsky D, Caligaris-Cappio F, Dighiero G, Dohner H, et al. Guidelines for the diagnosis and treatment of chronic lymphocytic leukemia: a report from the International Workshop on Chronic Lymphocytic Leukemia updating the National Cancer Institute-Working Group 1996 guidelines. Blood. 2008;111:5446–56. doi: 10.1182/blood-2007-06-093906. [DOI] [PMC free article] [PubMed] [Google Scholar]
- 16.Cheson BD, Bennett JM, Kopecky KJ, Buchner T, Willman CL, Estey EH, et al. Revised recommendations of the International Working Group for Diagnosis, Standardization of Response Criteria, Treatment Outcomes, and Reporting Standards for Therapeutic Trials in Acute Myeloid Leukemia. J Clin Oncol. 2003;21:4642–9. doi: 10.1200/JCO.2003.04.036. [DOI] [PubMed] [Google Scholar]
- 17.Dicker F, Herholz H, Schnittger S, Nakao A, Patten N, Wu L, et al. The detection of TP53 mutations in chronic lymphocytic leukemia independently predicts rapid disease progression and is highly correlated with a complex aberrant karyotype. Leukemia. 2009;23:117–24. doi: 10.1038/leu.2008.274. [DOI] [PubMed] [Google Scholar]
- 18.Yang H, Filipovic Z, Brown D, Breit SN, Vassilev LT. Macrophage inhibitory cytokine-1: a novel biomarker for p53 pathway activation. Mol Cancer Ther. 2003;2:1023–9. [PubMed] [Google Scholar]
- 19.Kojima K, Konopleva M, Samudio IJ, Schober WD, Bornmann WG, Andreeff M. Concomitant inhibition of MDM2 and Bcl-2 protein function synergistically induce mitochondrial apoptosis in AML. Cell Cycle. 2006;5:2778–86. doi: 10.4161/cc.5.23.3520. [DOI] [PubMed] [Google Scholar]
- 20.Zhong H, Chen G, Jukofsky L, Geho D, Han SW, Birzele F, et al. MDM2 antagonist clinical response association with a gene expression signature in acute myeloid leukaemia. Br J Haematol. 2015 doi: 10.1111/bjh.13411. in press. [DOI] [PMC free article] [PubMed] [Google Scholar]
- 21.Drakos E, Thomaides A, Medeiros LJ, Li J, Leventaki V, Konopleva M, et al. Inhibition of p53-murine double minute 2 interaction by nutlin-3A stabilizes p53 and induces cell cycle arrest and apoptosis in Hodgkin lymphoma. Clin Cancer Res. 2007;13:3380–7. doi: 10.1158/1078-0432.CCR-06-2581. [DOI] [PubMed] [Google Scholar]
- 22.Kobayashi T, Consoli U, Andreeff M, Shiku H, Deisseroth AB, Zhang W. Activation of p21WAF1/Cip1 expression by a temperature-sensitive mutant of human p53 does not lead to apoptosis. Oncogene. 1995;11:2311–6. [PubMed] [Google Scholar]
- 23.Yee K, Martinelli G, Assouline S, Kasner M, Vey N, Kelly KB. Phase 1b study of the MDM2 antagonist RG7112 in combination with 2 doses/schedules of cytobarine. Blood. 2013;122:498. [Google Scholar]
- 24.Carter BZ, Mak DH, Schober WD, Koller E, Pinilla C, Vassilev LT, et al. Simultaneous activation of p53 and inhibition of XIAP enhance the activation of apoptosis signaling pathways in AML. Blood. 2010;115:306–14. doi: 10.1182/blood-2009-03-212563. [DOI] [PMC free article] [PubMed] [Google Scholar]
- 25.Drakos E, Atsaves V, Li J, Leventaki V, Andreeff M, Medeiros LJ, et al. Stabilization and activation of p53 downregulates mTOR signaling through AMPK in mantle cell lymphoma. Leukemia. 2009;23:784–90. doi: 10.1038/leu.2008.348. [DOI] [PubMed] [Google Scholar]
- 26.Kojima K, Konopleva M, Samudio IJ, Ruvolo V, Andreeff M. Mitogen-activated protein kinase kinase inhibition enhances nuclear proapoptotic function of p53 in acute myelogenous leukemia cells. Cancer Res. 2007;67:3210–9. doi: 10.1158/0008-5472.CAN-06-2712. [DOI] [PubMed] [Google Scholar]
- 27.Kojima K, Konopleva M, Tsao T, Andreeff M, Ishida H, Shiotsu Y, et al. Selective FLT3 inhibitor FI-700 neutralizes Mcl-1 and enhances p53-mediated apoptosis in AML cells with activating mutations of FLT3 through Mcl-1/Noxa axis. Leukemia. 2010;24:33–43. doi: 10.1038/leu.2009.212. [DOI] [PubMed] [Google Scholar]
- 28.Kojima K, Konopleva M, Tsao T, Nakakuma H, Andreeff M. Concomitant inhibition of Mdm2-p53 interaction and Aurora kinases activates the p53-dependent postmitotic checkpoints and synergistically induces p53-mediated mitochondrial apoptosis along with reduced endoreduplication in acute myelogenous leukemia. Blood. 2008;112:2886–95. doi: 10.1182/blood-2008-01-128611. [DOI] [PMC free article] [PubMed] [Google Scholar]
- 29.Kojima K, Kornblau SM, Ruvolo V, Dilip A, Duvvuri S, Davis RE, et al. Prognostic impact and targeting of CRM1 in acute myeloid leukemia. Blood. 2013;121:4166–74. doi: 10.1182/blood-2012-08-447581. [DOI] [PMC free article] [PubMed] [Google Scholar]
- 30.Kojima K, McQueen T, Chen Y, Jacamo R, Konopleva M, Shinojima N, et al. p53 activation of mesenchymal stromal cells partially abrogates microenvironment-mediated resistance to FLT3 inhibition in AML through HIF-1alpha-mediated down-regulation of CXCL12. Blood. 2011;118:4431–9. doi: 10.1182/blood-2011-02-334136. [DOI] [PMC free article] [PubMed] [Google Scholar]
- 31.Kojima K, Shimanuki M, Shikami M, Andreeff M, Nakakuma H. Cyclin-dependent kinase 1 inhibitor RO-3306 enhances p53-mediated Bax activation and mitochondrial apoptosis in AML. Cancer Sci. 2009;100:1128–36. doi: 10.1111/j.1349-7006.2009.01150.x. [DOI] [PMC free article] [PubMed] [Google Scholar]
- 32.Kojima K, Shimanuki M, Shikami M, Samudio IJ, Ruvolo V, Corn P, et al. The dual PI3 kinase/mTOR inhibitor PI-103 prevents p53 induction by Mdm2 inhibition but enhances p53-mediated mitochondrial apoptosis in p53 wild-type AML. Leukemia. 2008;22:1728–36. doi: 10.1038/leu.2008.158. [DOI] [PubMed] [Google Scholar]
- 33.Thompson T, Andreeff M, Studzinski GP, Vassilev LT. 1,25-dihydroxyvitamin D3 enhances the apoptotic activity of MDM2 antagonist nutlin-3a in acute myeloid leukemia cells expressing wild-type p53. Mol Cancer Ther. 2010;9:1158–68. doi: 10.1158/1535-7163.MCT-09-1036. [DOI] [PMC free article] [PubMed] [Google Scholar]
- 34.Yoshimura M, Ishizawa J, Ruvolo V, Dilip A, Quintas-Cardama A, McDonnell TJ, et al. Induction of p53-mediated transcription and apoptosis by exportin-1 (XPO1) inhibition in mantle cell lymphoma. Cancer Sci. 2014;105:795–801. doi: 10.1111/cas.12430. [DOI] [PMC free article] [PubMed] [Google Scholar]
- 35.Ding Q, Zhang Z, Liu JJ, Jiang N, Zhang J, Ross TM, et al. Discovery of RG7388, a potent and selective p53-MDM2 inhibitor in clinical development. J Med Chem. 2013;56:5979–83. doi: 10.1021/jm400487c. [DOI] [PubMed] [Google Scholar]
Associated Data
This section collects any data citations, data availability statements, or supplementary materials included in this article.