Abstract
Nanoparticles are widely used as contrast and therapeutic agents. As such, imaging modalities that can accurately estimate their distribution in-vivo are actively sought. We present here our method Magneto Acoustic Tomography (MAT), which uses magnetomotive force due to a short pulsed magnetic field to induce ultrasound in the magnetic nanoparticle labeled tissue and estimates an image of the distribution of the nanoparticles in-vivo with ultrasound imaging resolution. In this study, we image the distribution of superparamagnetic iron oxide nanoparticles (IONP) using MAT method. In-vivo imaging was performed on live, nude mice with IONP injected into lymph node derived cancer of the prostate tumors induced over the hind limb of the mice. Our experimental results indicate that the MAT method is capable of imaging the distribution of IONPs in-vivo. Therefore, MAT could become an imaging modality for high resolution reconstruction of MNP distribution in the body.
Keywords: Magneto motive force, Magnetic nano particle, in-vivo, magneto acoustic tomography, ultrasound
Graphical abstract
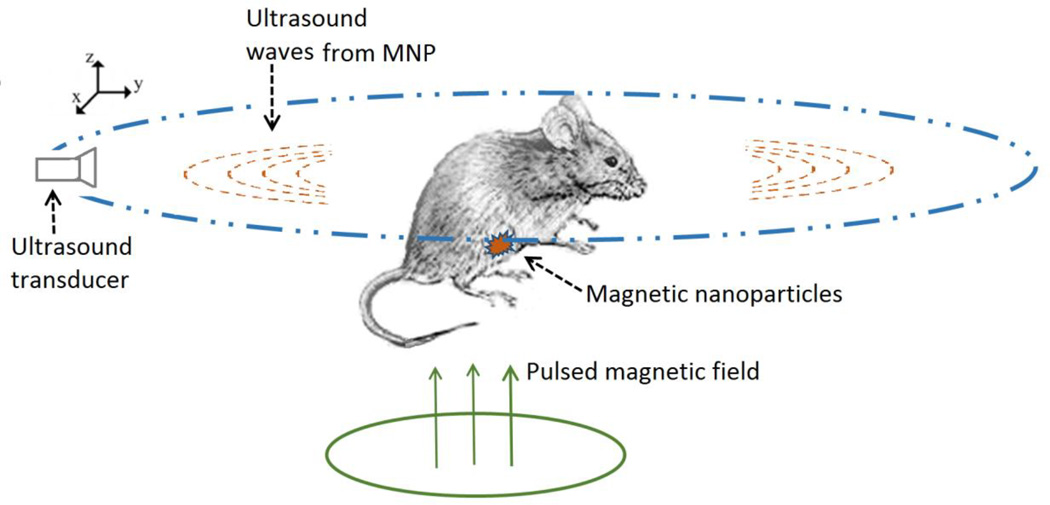
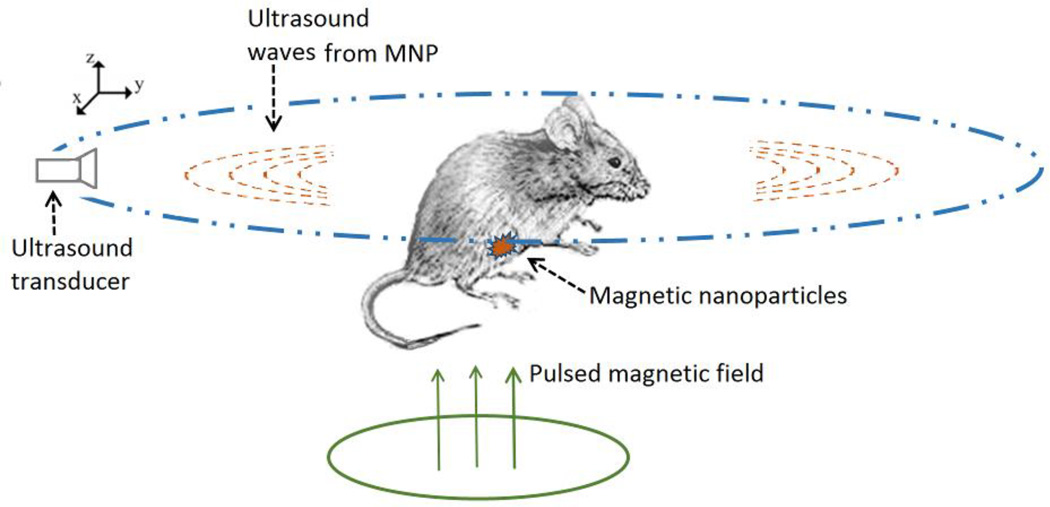
In magneto acoustic tomography a short pulsed magnetic field is applied to induce ultrasound in tissue labeled with magnetic nanoparticle through magneto motive force. Using ultrasound transducers placed around the object this ultrasound wave is measured. The reconstructed image from the ultrasound signal is a representation of the distribution of the magnetic nanoparticles in the tissue. This is shown in the present study with in-vivo experiments to detect and image the distribution of IONPs in live, nude mice with induced lymph node derived cancer of the prostate tumors over the hind limb.
Introduction
In recent years, magnetic nanoparticles (MNPs) have been widely used as contrast agents in a variety of clinical and molecular imaging modalities [1]. Target specificity is typically accomplished by coating MNPs with appropriate tumor/tissue specific markers, such as antibodies, allowing them to bind to the tumor region [2–3]. These nanoparticles can then be imaged within the tumors for clinical applications such as detection or pre-treatment planning. For instance, there is a wide consensus that early detection of cancer improves both 5-year survival rates and quality of life for patients. As seen in clinical data from 24,740 cases, five-year breast cancer survival rates can reach 96.2% if the tumor is diagnosed when the size is less than 5 mm [4]. This has led to significant effort in exploration of contrast agents and biomarker indicating tumors [5]. Also, techniques are being actively developed to image cancer through the use of indigenous tissue properties such as elastic properties [12] or electrical properties (EP) at various electromagnetic wavelengths [6–11]. The goal of these efforts is to obtain highly sensitive, good resolution detection of tumors.
In addition to magnetic nanoparticles being used as imaging contrast agents, they are also being actively investigated as therapeutic agents owing to the ability to heat MNPs by alternating radiofrequency (RF) magnetic fields. Thus, the use of magnetic nanoparticles could lead to theranostic (therapeutic and diagnostic) applications in cancer management [13–15]. For these reasons, developing high spatial resolution imaging techniques for the detection of the distribution of these MNPs in tissue is desired.
Several imaging techniques for estimating the distribution of nanoparticles in tumors have been explored in recent years. Magnetic resonance imaging (MRI) was first used to image magnetic nanoparticle-labeled molecular targets, as it can provide an enhanced imaging contrast because of its nature and properties significantly shortening T2 relaxation time [16] [17]. The reduced relaxation time of the signal in MRI is seen to depend on the concentration of the magnetic nanoparticles used, and research is ongoing to be able to reliably detect these nanoparticles under shortened relaxation times at nanoparticle concentration levels in the 1–10 mg Fe/ml range [18]. Using the sweep imaging with fourier transformation (SWIFT) MRI technique, quantitative imaging of up to 3 mg Fe/ml concentration of iron oxide nanoparticles (IONPs) is possible [18][19]. CT scanning has also been explored as another approach for estimating the distribution of magnetic nanoparticles [20]. The IONP distribution above 10 mg Fe/ml is well recognized in the CT images with the sensitivity limited below this concentration [20]. In addition, the cost of MRI or CT imaging systems represents an economic burden for large scale screening for early cancer detection applications [21]. Another approach that has been explored for detecting MNPs is based on the heating effect [15],[22] which applies alternating magnetic fields and raises the temperature of the MNP labeled tumor. This raises the temperature distribution around the tumor which is then used to estimate its location. However, this technique is limited by its ability detect superficial tumors at depths of up to 1.5 cm under the surface. It is also limited by the amount of heat applicable to the tissue for diagnostic purposes. On the other hand, ultrasound penetrates soft tissue with imaging depths of tens of centimeters in the current ultrasound systems in the few MHz frequency range [23]; in this frequency range, the imaging resolution is better than 1 mm. In addition, ultrasound based systems could provide a cost effective imaging alternative to MRI or CT.
Recently, several ultrasound-based imaging techniques have been developed in which a secondary effect of the nanoparticles is being used to indicate their presence. Photoacoustic (PA) imaging is based on the detection of changes in optical absorption properties due to the presence of nanoparticles. In PA imaging, nano agents with well-characterized absorption spectrums absorb the applied laser pulses. This energy then converts to heat, generating acoustic waves detectable with an ultrasound receiver [24][25]. In magneto-motive force based nanoparticle detection, an RF magnetic field is applied to the tissue labeled with MNPs experiencing a mechanical force from the magnetic field. The resultant mechanical fields from this force can then be used to image the nanoparticles present in the tissue, which is a diamagnetic medium without such magnetic forces. Imaging methods using these magneto-motive forces, leading to the displacement in MNP labeled tissue, have been proposed for reconstructing these nanoparticle distributions [26–29]. One such technique is based on displacement measurements using optical coherence tomography (OCT) called magneto-motive optical coherent tomography (MM-OCT) [26][27]. However, MM-OCT has limited detection depth due to the strong scattering of light in tissues. Alternatively, ultrasound based methods using B-mode or M-mode ultrasound measurements of magnetic nanoparticle displacement for deep tissue imaging have been proposed as presented in magneto-motive ultrasound imaging (MM-US)[28][29]. These previously used imaging methods using magneto-motive force either apply continuous alternating magnetic fields or millisecond long, alternating pulsed magnetic fields to generate tissue displacement images and perform measurement of the displacement which is prominently induced along the direction of the force.
In our new method called magneto acoustic tomography (MAT) [30], we apply a short, microsecond duration magnetic pulse to the tissue with MNP. This leads to a short pulsed magneto motive force acting on the MNP creating acoustic vibrations that spread in all directions throughout the medium. In addition, these acoustic vibrations are at the same frequency as the dynamic magnetic field, which is chosen to match the ultrasound frequency range. This allows recording of these acoustic waves with ultrasound transducers placed around the object in this study. This measured signal can then be used to reconstruct the acoustic source distribution in the object by using possible ultrasound imaging approaches [31][32] leading to the reconstructed images having a good resolution of ultrasound imaging and good imaging depth in soft tissue. The imaging resolution and depth are primarily governed by the ultrasound system used. The imaging resolution is a function of the ultrasound bandwidth and the imaging depth is governed by the ultrasound attenuation in tissue. In the MAT method the ultrasound transducer is used only in the sensing mode unlike traditional ultrasound imaging where the transducer acts as both transmitter and receiver of acoustic waves. This allows the MAT method to have improved imaging bandwidth, limited mainly by the receiving bandwidth of the transducer, leading to better resolution. Also, as compared to traditional ultrasound imaging, the MAT method has lower ultrasound attenuation due to the tissue from the reduced travel path of the acoustic waves from the MNPs embedded in tissue to the sensing transducer leading to improved imaging depth. The MAT method is similar to magneto acoustic tomography with magnetic induction (MAT-MI), which is being explored for high resolution bioimpedance imaging [7][33][34]. With MAT-MI a combination of pulsed and static magnetic fields are used to generate acoustic fields by using Lorentz force; this acoustic field can be used to estimate the high resolution conductivity distribution of the tissue.
Different magnetic materials such as Fe, Ni, Mn, Co, Cr, Gd in their metal, metal alloy or oxide forms can be used as magnetic contrast agents [35][36]. However, because metals and metal alloys are prone to oxidation and corrosion, stable metal oxides are widely used as MNP contrast agents. Toxicity considerations are also a factor in the choice of materials for a contrast agent. The presence of iron in human bodies and the low toxicity profile [37] have led to iron based nanoparticles being actively studied as contrast agents. Other materials that could be highly toxic require proper coating or chelation when used as contrast agent [36].
In this paper, we present our work on in-vivo imaging of the iron oxide based nanoparticles (IONP). The particles chosen are small (around 10–20 nm) which leads to these particles having superparamagnetic properties. This allows the particles to have good stability in colloidal solutions [28]. Using these particles injected into the prostate tumor induced over the hind limb of the mouse, we performed in-vivo MAT imaging of these nanoparticles indicating their presence and distribution in tumors. An ultrasound scanning system measuring acoustic vibrations along directions perpendicular to the magnetic field is used for the imaging.
Theory
Magneto acoustic signal generation
In magneto acoustic tomography based IONP detection, a time varying magnetic field B1 (r, t) is applied over the object space Ω. This field is generated by applying a pulsed current through coils placed in the xy plane as seen in Fig. 1. This gives rise to magnetic fields which are primarily along the z direction over the object space. Also, when the applied current pulse duration is in the microsecond range, the corresponding magnetic field is in the MHz frequency range. In biological tissue, such a field can uniformly penetrate through the object and be considered to be quasi-static [38–39] and fully determined by the coil geometry carrying the pulsed current. This allows the separation of the spatial and temporal components of the magnetic field as follows
| (1) |
Where Bz is the magnetic field acting along the z direction in space, f (t) is the time dependence of the field. The magnetic nanoparticles present in such a field experience the magneto-motive force along the z direction as described by the following [28][40]:
| (2) |
Where χnp is the magnetic susceptibility of the particles, Vnp is the volume of the nanoparticles and fnp is the volume fraction of the nanoparticles and µ0 the magnetic permeability constant.
Fig 1.
Schematic diagram of magnetic nanoparticle imaging using magneto acoustic tomography method with a short pulsed magnetic field.
For a biological tissue medium behaving as an inviscid fluid, the linearized Navier-Stoke’s equation describing the relationship of the pressure wave and the applied force is as follows [7][23][41]
| (3) |
where p(r, t) is the pressure, v(r, t) is the velocity at a point r in the medium, ρ0 is the density of the medium.
Taking the divergence of the above equation and combining it with the continuity equation in the medium for such an acoustic wave, gives the wave equation for pressure distribution:
| (4) |
Where βs is the compressibility of the medium, which is ~ 1500 m/s for biological tissue. As seen here, the divergence of the magneto motive force acts as the source for the pressure wave which propagates in all directions in the medium.
The pressure in the medium is given by the Green’s function solution to equation 4:
| (5) |
Where r' is the location of the acoustic source, r is the location detector, ∇r' implies derivative with respect to source space r', the Green’s function for this solution where . The volume integration is carried out over the acoustic source distribution in the object space Ω. This equation gives the observed pressure for an impulse source, i.e., a source with its time function as δ(t). An induced acoustic source field with time dependence h (t) and the transducer impulse response r (t) leads to an observed pressure p (r, t)⊗h(t)⊗r(t), where ⊗ is the convolution operator. The Green’s function for this time dependence can be written as , where hr (t) = h(t)⊗r(t) [42].
Image Reconstruction
Equation 5 shows the pressure signal received by an ideal point receiver. With such a receiver collecting pressure signals on an aperture enclosing the object (∑) in an acoustically homogeneous medium, the initial pressure distribution is related to the acoustic source as [7] can be determined by time reversing the acoustic waves [31]. This gives the acoustic source distribution in the medium as:
| (6) |
where rd is a point on the detection surface, r is a point in the object space, and the double prime represents the second derivative over time. In this equation a term corresponding to the first derivative is neglected as its contribution is negligible compared to the second derivative term [7][31].
Methods
Imaging System
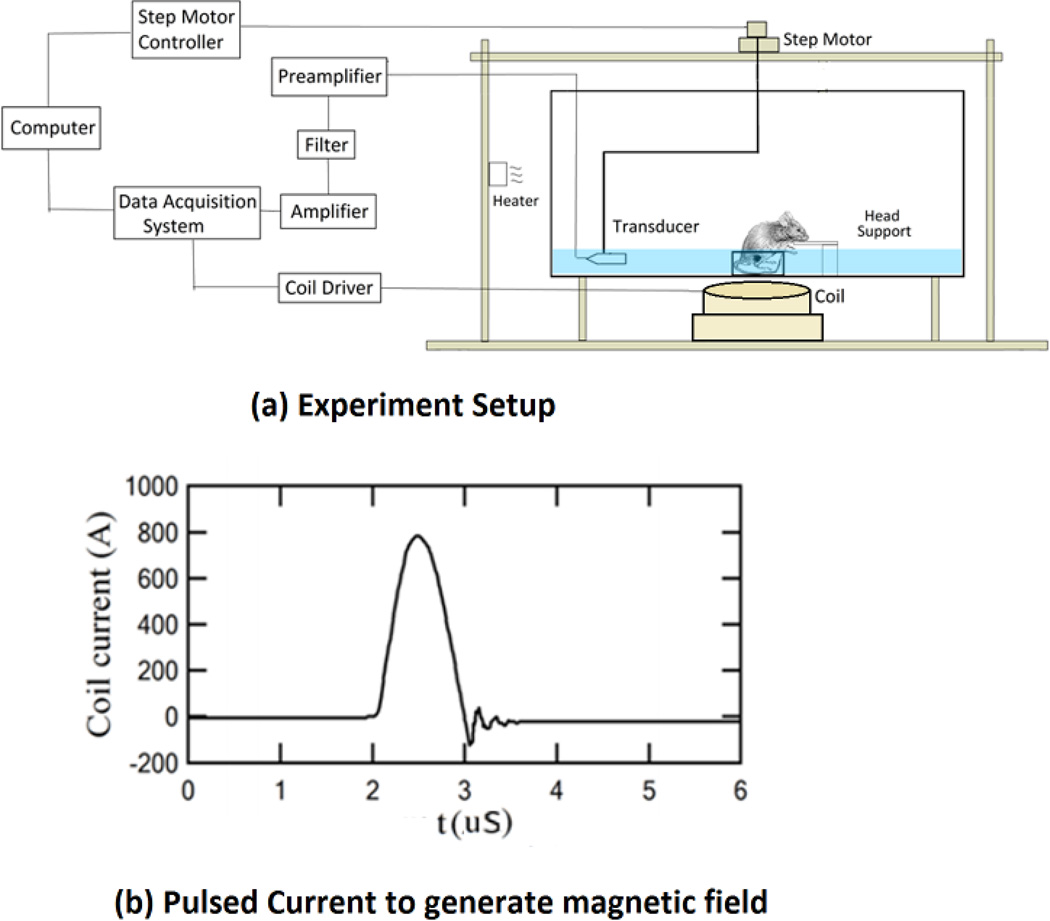
Figure 2a shows the schematic diagram of the magneto acoustic tomography imaging system for the mouse experiment. In this setup, a coil consisting of 3 turns of wire placed in the same plane, with a maximum outer diameter of 70 mm and 2 mm thickness (APP Inc., Freeville, NY, USA), is used to apply a microsecond long magnetic pulse to the object region. This coil is placed horizontally very close to the tank wall to maximize the magnetic field in the object region. It is driven by a customized magnetic stimulator using a capacitor and high power switch to apply a pulsed current to generate the magnetic field. This capacitor in the stimulator can be charged from 0–24 kV applied to the coil by the solid state switch (APP Inc., Freeville, NY, USA). Fig. 2b shows the current through the coil at 24 kV capacitor voltage. The force contribution due to the magnetic field at this voltage is leading to a force of ~ 2.6*10−20 N per particle giving rise to a pressure of ~1.5 Pa in the medium from the previously described method in [30]. However, due to the large current through the coil, electromagnetic interference is observed at the ultrasound signal measuring transducers. In the imaging experiments the charging voltage is set to 16 kV giving optimum SNR for the ultrasound recording.
Fig 2.
(a) Schematic diagram of the MAT imaging setup. The coil placed close to the tank is used to deliver the pulsed magnetic field to the imaging object. (b) The waveform of the applied current to the coil generates the micro second long magnetic pulse.
The imaging region of the object and the transducer with a diameter of 25 mm and a nominal peak frequency of 0.5 MHz (TRS ceramic, PA, USA) were immersed in the plastic tank of distilled water. The transducer has a bandwidth of 60% around the center frequency and the scanning performed using a rotational stage (B5990TS, Velmex Inc., USA) over 180 degrees with a step size of 2 degrees around the object. Piezoelectric signals collected by the transducer were amplified with a low-noise ultrasound amplifier and a bandpass filter with 75 kHz to 1 MHz cutoff frequencies (5660B, Olympus, MA,USA, and VP2000, Reson, Denmark) before entering the data acquisition system which acquired 2048 data points for each channel with a 5 MHz sampling rate. The data is averaged 200 times for each channel and recorded in the PC also synchronizing the magnetic stimulation, the data acquisition timing and the motor’s position.
Additionally, after the magneto acoustic imaging experiment, pulse echo imaging of the object is performed with a commercial ultrasound scanner, a 64-channel US system (OPEN system, Lecoeur Electronique, Chuelles, France). The US system was connected to a 64-element US phased-array transducer (P7-4, ATL) with the elements arranged in a linear array configuration with interelement spacing of 0.18 mm. The center frequency of the transducer is 5 MHz; its bandwidth is 3 MHz. This system is operated in the pulse echo mode with transmission from each channel and corresponding echo recording from all channels forming one measurement then repeated for all 64 elements. This data is then beamformed using the synthetic aperture based backprojection algorithm to reconstruct the ultrasound image corresponding to the imaging cross section of the MAT method [23][43].
Mouse tumor model preparation
For the in-vivo imaging experiments, prostate tumors are introduced over the hind limb of seven week old nude mice by injecting LNCap cells into the limb. These LNCap cell lines commonly used in cancer research come from human prostate adenocarcinoma [44]. For inducing the tumor, 1e6 cells suspended in 0.1 mL Matrigel matrix (50% Matrigel and 50% LNCaP growth medium) are subcutaneously injected into the hind limb of each of the nude mice weighing ~ 24 gm. The tumors grow for 4 to 6 weeks and approximately reach a diameter of 5–10 mm. These mice are then used for the experiments.
In-vivo imaging experiment
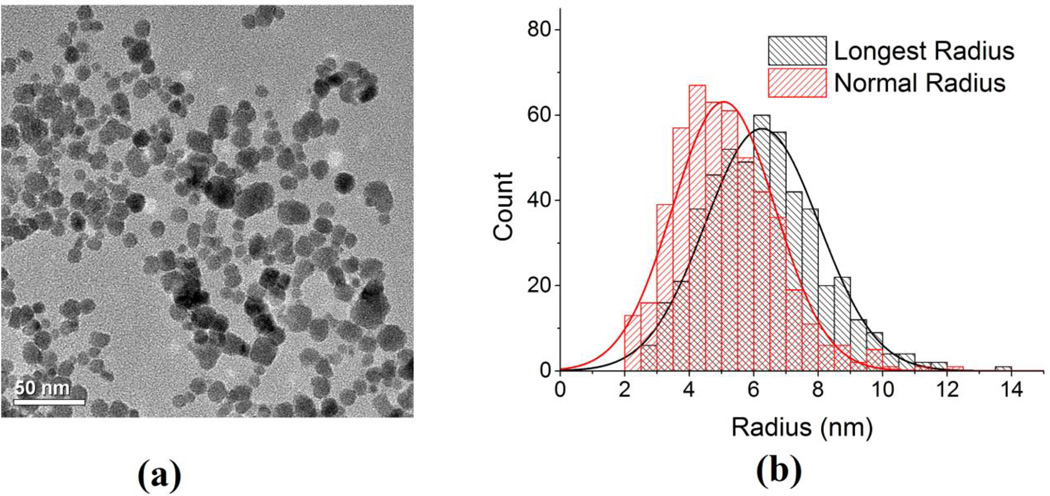
For the experiments, we use commercially available, water soluble ferrofluid superparamagnetic nanoparticles, EMG 308 (Ferrotec, NH, USA). The EMG 308 (χnp = 0.5) consists of Fe2O3 with a particle diameter of ~15 nm in the suspension [30][45]. Transmission electron microscopy (TEM) image of aqueous EMG-308 is shown in Fig 3a and the histogram of the particle size distribution is shown in Fig 3b. For the mouse imaging experiments, an aqueous solution of EMG 308 is used with an IONP concentration of 4 mg Fe/ml; a volume of 50–75 ul is injected into the center of the tumor with a single application.
Fig 3.
(a) Room temperature transmission electron microscopy (TEM) images of aqueous EMG-308 IONPs were acquired with a FEI Tecnai T12 microscope (FEI, Inc., Hillsboro, OR) operating at 120 kV. A 200 mesh copper grid with formvar and carbon supports was dipped into a ~1 mg Fe/ml IONP suspension, then removed and allowed to dry before imaging. (b) The histogram of the longest radius and the radius normal to it were measured using Image J (NIH).
The mouse in the imaging experiment setup is seen in Fig. 2a. As seen in this figure, the anesthetized mouse with the tumor is placed inside a cup, in a sitting position, and fixed with a cooled agar gel placed around the tumor region in the cup. Also, since the tumors are present over the hind limbs, they are less affected by the cardiac motion. The cup region with the tumor is immersed under warm water for coupling of the acoustic signal with the ultrasound transducer, while the head of the mouse is held outside the water to allow for breathing. Additionally, a heater with a thermostat is used to maintain the temperature (~36° C) in the tank during the experiment. The mouse is anesthetized using IP injection of mixture of Ketamine 100mg/kg and Xylazine 10mg/kg for the imaging experiments. After the imaging experiment, the mouse, under anesthesia, is sacrificed by cervical dislocation and the tumor excised for histological analysis. The histological section is stained with Prussian blue stain and counter stained with nuclear fast red.
These experiments have been approved by the Institutional Animal Care and Use Committee (IACUC) for animal research at the University of Minnesota.
MAT image reconstruction
For the image reconstruction we use the modified time reversal algorithm presented in the theory section. It is seen through studies of ultrasound image reconstruction theory [46][47] that there is data redundancy in the measured ultrasound signal from around the object. A half view angle corresponding to 180 degrees of scanning for data collection around the imaging object is sufficient for the tomographic reconstruction. In the present study, we used 180 degree scans to avoid potential signal distortion from the ultrasound pressure waves traversing through the abdominal regions of the mouse reaching the transducer possibly containing gases. Also, the reduced scan angle leads to reducing the scan time. The ultrasound transducers available have a limited bandwidth around the center frequency of about 60–70% acting as a bandpass filter on the received pressure signal as seen in the theory section. This filter, as seen in the frequency domain, creates a signal windowing function around the center frequency and behaves much like a Gaussian low pass filter combined with the temporal derivatives needed for ultrasound image reconstruction as seen in equation 6 [48]. The temporal derivatives of the measured pressure signal used in the image reconstruction could lead to amplification of high frequency noise present. However, as the band pass filtering of the transducer already contains the temporal derivatives, we further modify the image reconstruction in equation 6 by substituting the pressure signal, p, instead of its derivatives, p", for a given transducer location.
In the experiments, the time varying magnetic field leads to electromagnetic interference (EMI) at the ultrasound transducer. This continues for a certain duration due to the turn off transients associated with the stimulator and the impulse response of the transducer. The observed EMI signal in the experimental data has significant, low frequency variations. This noise on time reversal leads to slow varying spatial signals interfering with the reconstruction of the low spatial frequency component of the acoustic source distribution. This leads to errors in IONP distribution imaging, so the received acoustic signal is further bandpass filtered to eliminate most of the low and high frequency noise. A simple filter implemented for this purpose in frequency domain is
I/Q demodulation based envelope detection is performed on the filtered signal, and the ultrasound image reconstruction algorithm as described above is applied to estimate the acoustic source distribution [23].
Results
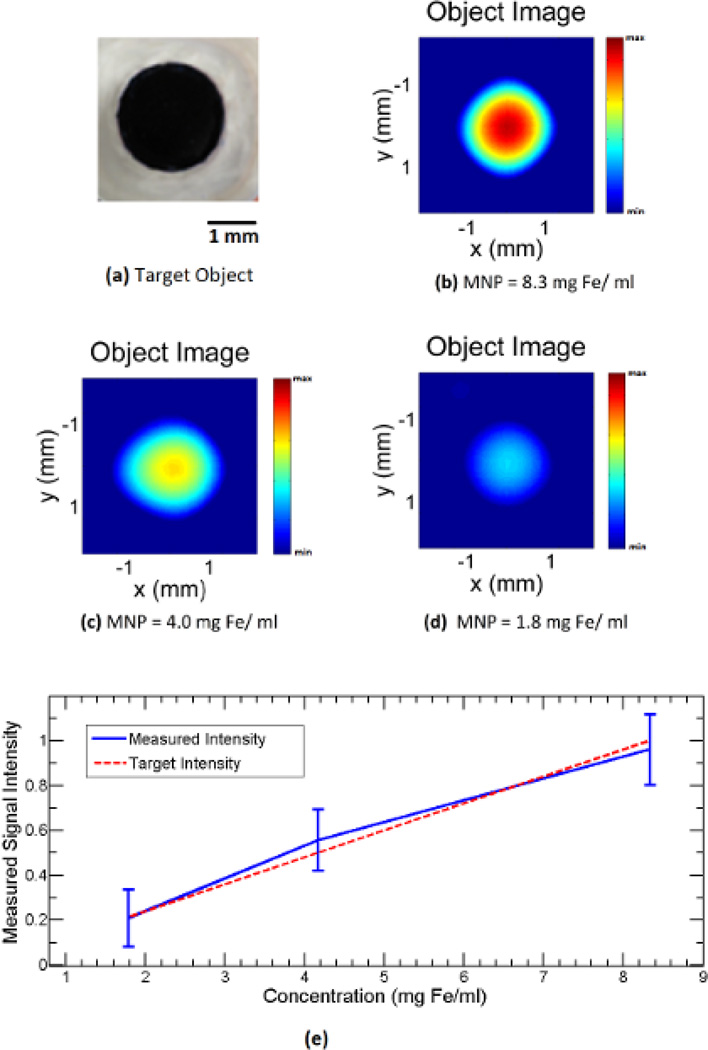
We performed magneto acoustic tomography experiments in live nude mice using the proposed system. In the experiment result seen in Fig 4, we used an agar gel phantom with nanoparticles embedded to test the signal due to the magneto motive force. The phantom as seen in Fig 4a consists of 1% agar gel with a 1.5 mm circular agar gel inclusion infused with iron oxide nanoparticles. A thin piece of plastic is placed between the inclusion and the background to prevent diffusion of nanoparticles. The concentration of nanoparticles in the inclusion is varied from 8.3, 4, and 1.8 mg Fe/ml to perform three different experiments. The MAT image of the phantom is reconstructed as described in the methods section. The intensity of the signals used in the image reconstruction is normalized to the maximum signal measured in the experiment. The reconstructed image corresponding to the inclusion concentration of 8.3, 4, and 1.8 mg Fe/ml is shown in Figs. 4b, 4c and 4d respectively. It can be seen then that the image intensity varies with the concentration of nanoparticles. Also, the average image intensity and variation in the inclusion region for the three phantoms were plotted with respect to the concentration as seen in Fig. 4e, which shows the linear dependence of the magneto-motive signal on the nanoparticles concentration. In addition, the resolution of the imaging system is ~1.5 mm [49][50]. The effect of this on the reconstruction leads to distortion in the image of the object with the image intensity varying through the inclusion region as seen in the Fig. 4.
Fig 4.
Imaging experiment with a small circular inclusion of IONP at different concentrations in 1 % background agar gel. (a) Top view photo of the imaging object. (b),(c),(d) MAT images of the object with IONP concentration of ~8.3, 4.0, 1.8 mg Fe/ml respectively. (e) Plot of the measured image intensity with respect to the IONP concentration.
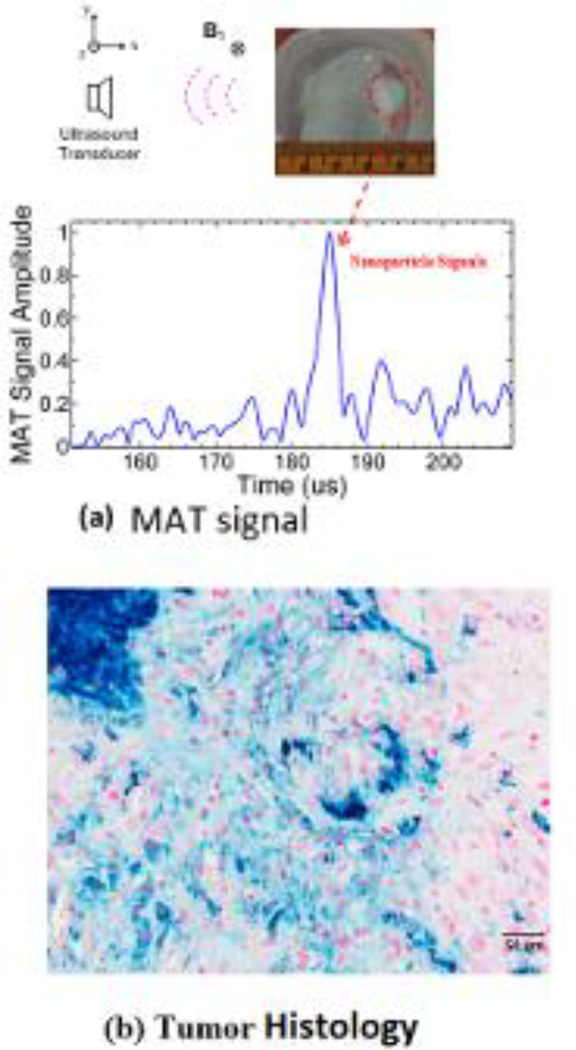
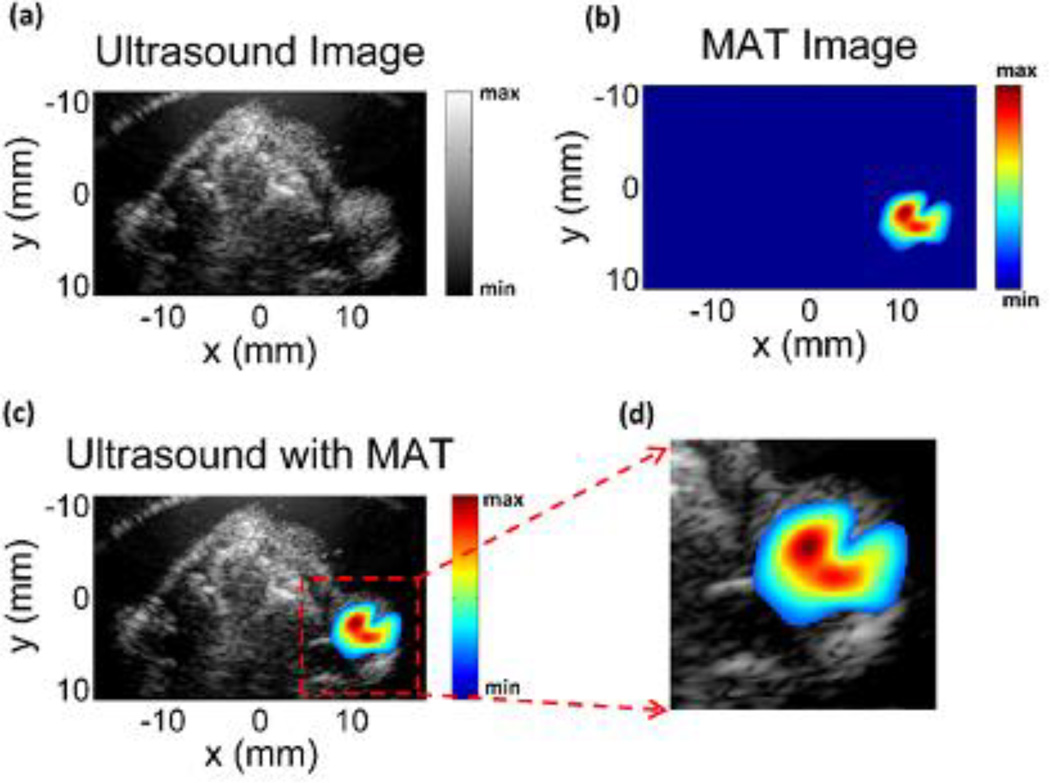
Experiments were also performed to image five mouse tumors with the nanoparticles injected as described in the methods section. Fig. 5a is the imaged mouse and the tumor region, about 7 mm, in the experiment phantom with the corresponding orientation of the scanning transducer and applied magnetic field. The signal collected from this location is processed as described in the methods section, and this envelope detected signal is shown in Fig. 5b. It can be seen from the figure that strong signals are present around 183–187 us corresponding with the location of the tumor region; the spread in the signal of around 4 us corresponds to the distribution of the nanoparticles in the tumor. The background signal strength is approximately 3–4 times lower than the IONP signals. Histological slices of the tumor stained with Prussian blue can be seen in Fig. 5c, confirming the presence of the injected nanoparticles. The measured magneto acoustic signals are used to reconstruct the distribution of the IONP using the back projection algorithm. The image reconstruction result can be seen in Fig. 6. The ultrasound (US) image of the mouse is in Fig. 6a showing the imaged cross-section with the tumor present superficially over the right hind limb of the mouse. As the pulsed magnetic field is not applied during the imaging, the signal from the IONPs, due to the magneto motive force, is absent. The intensity of ultrasound speckle distribution is fairly uniform throughout the reconstructed image. The MAT image showing the IONP distribution can be seen in Fig. 6b. The noise baseline of the reconstruction from the imaging system is used as the floor of the reliable signal that can be measured and masked out from the MAT image. Fig. 6c shows the overlaying of the MAT image on the ultrasound image of the mouse; the IONP signal is strongly present in the region over the hind limb of the mouse indicating the tumor. Fig. 6d shows the tumor region with the overlaying MAT image. From the non-uniform intensity of the reconstructed IONP distribution, we can also see the heterogeneous distribution of the nanoparticles due to the IONP injection in the tumor region, seen in the histology from Fig. 5c.
Fig 5.
(a) Top view photo of the imaging object showing the tumor region in the mouse and the corresponding MAT signal due to the embedded IONPs. (b) Histological cross section of the tumor injected with IONPs. The section is stained with Prussian blue stain and counter stained with nuclear fast red with the blue areas indicating the IONPs.
Fig 6.
(a) Ultrasound image (US) of the mouse corresponding to the magneto acoustic tomography imaging cross-section showing the tumor on the right hind limb of the mouse. (b) Magneto acoustic tomography image of the magnetic nanoparticles injected in the mouse tumor. (c) Combined MAT and ultrasound image indicating the tumor with the nanoparticles present in the region. (d) Reconstructed image area highlighting the tumor region.
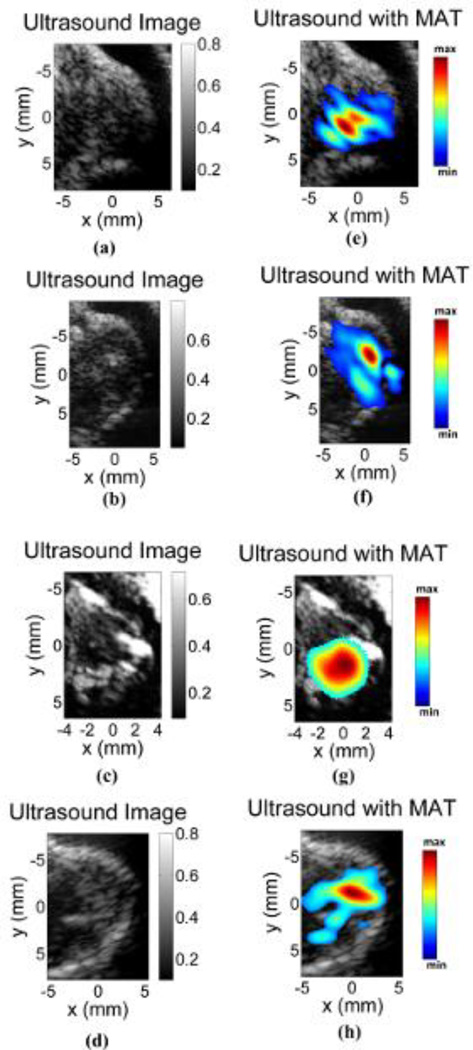
To further validate the MAT method for in-vivo IONP imaging, four more tumor images were obtained as shown in Fig. 7. Figs. 7a – 7d, show the ultrasound image of the tumor regions without the magnetic pulse stimulation. The corresponding images with IONP distribution estimated from MAT images are shown in Figs. 7e – 7h. The presence of the IONP in the mouse can be clearly seen in the MAT images. However, as the IONP distribution is not uniform from the injection, the intensity distribution of the reconstruction varies throughout; and as seen in Fig. 7h from the smaller region of IONP in the reconstruction, the dose of the nanoparticles retained in the imaging region could be small.
Fig 7.
MAT image of four tumors. (a)–(d) Ultrasound image corresponding to the pulse echo imaging method without the applied magnetic pulse. (e)–(h) MAT images overlying the ultrasound image showing the IONPs present in the tumor region.
Discussion
We applied magnetoacoustic tomography (MAT) methods using a short pulsed magnetic field to image magnetic nanoparticles applied to prostate tumors in a mouse model. The preliminary in-vivo study shows that the images of the IONP present in the tumor are reconstructable. Further, we tested the strength of the MAT signal which is proportional to the dependence on the concentration of magnetic nanoparticles for a phantom with uniform z distribution of nanoparticles. The acoustic source creating the MAT pressure signal is the divergence of the magneto motive force. This is dominant along the z direction in the experimental setup over the object region and depends on the z distribution of the IONPs in this MAT setup. Therefore, to further obtain a quantitative map of the IONP distribution, this z dependence of the acoustic source would have to be taken into account. This can be achieved by varying the z profile of the magnetic field and performing multiple measurements and combining them as used in multi excitation methods proposed in electrical properties imaging [51][52]. This could give a quantitative distribution which could be useful in designing therapeutic applications.
The MAT signal from the IONPs are in the same frequency range as the applied RF pulsed field, matched to the ultrasound scanner being used to measure the signal for optimum signal recording. The ultrasound systems have a limited bandwidth around a center frequency governing the resolution of the image reconstruction. The ultrasound resolution can be obtained, for the tomographic reconstruction method used in the current study, by estimating the point spread function of the imaging system. This is done by using a point source in eqn (5), ∇· Fm (r) =δ (r), and substituting the estimated pressure in eqn (6). This gives the reconstruction of a point source with this imaging system, which is an estimate of the imaging point spread function. The current ultrasound imaging system used in MAT imaging has a center frequency of 500 kHz leading to an imaging resolution better than 2 mm shown in previous resolution estimating experiments and simulations of the point spread function of the ultrasound system [49][50]. The imaging depth of the MAT system is governed by the attenuation of the ultrasound wave travelling through tissue. Unlike ultrasound, the magnetic field in the low MHz range used in MAT method does not get attenuated by the tissue [38–39]. The strength of the ultrasound wave decays exponentially: p (x) = p (0) exp(−α x), where x is the depth of the MAT source from the sensor, p(0), p(x) is strength of the signal at the source and sensor, α is the ultrasound attenuation coefficient. The attenuation coefficient α is around 1 dB/cm for most soft tissue at 1 MHz frequency. In the current system the signal from the MNPs embedded in the tumors on the surface of the mouse leads to an imaging contrast of 5–7 times due to the improvement in SNR from the signal averaging from various measurement directions present in the image reconstruction method [42]. This imaging contrast is proportional to the strength of the signal which is obtained at the surface of the body of the mouse. Assuming an imaging contrast of 2 would be the limit of the imaging depth, with the exponential decay of the pressure wave, this contrast would be obtained for an imaging depth of around 10 cm in soft tissue. The spatial distribution of the magnetic field generated in the MAT method is governed by the geometry of the coils [38][39]. In the present study we use a 5 cm diameter coil and the imaging region is located 2.5 cm from the coil surface. To obtain a similar strength magnetic field at a larger depth either a larger diameter coil or coil arrays could be used.
In the current imaging setup a single transducer scanning mechanically around the object is used for the data acquisition. For the data to image a tumor region with the tomographic method used, 50 minutes of scanning time is required (140° view angle). However, the use of ultrasound imaging arrays to acquire this data in parallel could significantly shorten this time. After this data acquisition, an ultrasound back-projection algorithm with built-in data filtering is used to reconstruct the acoustic source from IONPs. Thus, each of the presented tomographic images of the nanoparticles’ spatial distributions can be produced less than 5 seconds by a computer with an Intel Core i7 processor.
In the MAT method, though, we apply a very large magnetic field of around 120 mT at ultrasound frequencies which can lead to induced electric fields in the sample to be around 550 V/m. This is comparable to the stimulating strength in transcranial magnetic stimulation (TMS). However, the total energy applied to the samples in MAT is much lower than TMS, as the MAT pulse duration is at the microsecond level instead of hundreds of microseconds in TMS. Additionally, the temperature rise due to a microsecond long pulse applied to the IONP at the concentration of EMG 308 is around the mK range [35], and also the pulse is repeated at a slow repetition frequency under 50 Hz further dissipating the heat deposited leading to unsubstantial temperature rise in the object. Thus the use of a short duration pulse reduces the amount of energy deposited in the tissue.
The acoustic homogeneity assumption used in the theoretical derivation in this study restricts the proposed imaging method to primarily soft tissue imaging. The acoustic heterogeneity of soft tissue is less than 10%, and its effect can be negligible for those imaging techniques based on the acoustic measurements of induced ultrasound signals [53][54].
In these in-vivo imaging studies we performed intratumoral injections to have efficient accumulation of the non-targeted superparamagnetic nanoparticles. These intratumoral injections lead to the uneven distribution of nanoparticles in the tumor. In future studies using tumor specific antibodies, the magnetic nanoparticles would be applied systemically through blood; and on accumulation in the tumor, it would be imaged as a potential method for early detection of tumors for screening purposes. Also, superparamagnetic iron oxide nanoparticles are seen to have low cytotoxicity concerns [37] enabling them to be more suitable for cellular/molecular biomarkers in biomedical applications which could be a concern with contrast agents required for some imaging methods such as radionuclide imaging.
Conclusion
In conclusion, we demonstrated the capability of the MAT method to detect and reconstruct the distribution of superparamagnetic iron oxide nanoparticles embedded in-vivo within live, nude mice containing induced LNCap prostate tumors. As this is an ultrasound based imaging method using a short pulsed magnetic field, the present method has good resolution and imaging depth for potential applications in imaging tumors within soft tissue.
Supplementary Material
Acknowledgement
This work was supported in part by NIH EB014353, EB017069, EB006433, and IEM Cancer Animal Core Lab. The authors would like to thank Dr. Michael Ethridge for useful discussions with magnetic nanoparticles. Also, we would like to thank Katie R. Hurley (Department of Chemistry, University of Minnesota) for TEM preparation, imaging and measurements of the radii of EMG-308.
Footnotes
Publisher's Disclaimer: This is a PDF file of an unedited manuscript that has been accepted for publication. As a service to our customers we are providing this early version of the manuscript. The manuscript will undergo copyediting, typesetting, and review of the resulting proof before it is published in its final citable form. Please note that during the production process errors may be discovered which could affect the content, and all legal disclaimers that apply to the journal pertain.
References
- 1.Kalambur VS, Han B, Hammer BE, Shield TW, Bischof JC. In vitro characterization of movement, heating and visualization of magnetic nanoparticles for biomedical applications. Nanotechnology. 2005;16:1221. [Google Scholar]
- 2.Ito A, Kuga Y, Honda H, Kikkawa H, Horiuchi A, Watanabe Y, Kobayashi T. Magnetite nanoparticle-loaded anti-HER2 immunoliposomes for combination of antibody therapy with hyperthermia. Cancer Lett. 2004;212:167–175. doi: 10.1016/j.canlet.2004.03.038. [DOI] [PubMed] [Google Scholar]
- 3.Le B, Shinkai M, Kitade T, Honda H, Yoshida J, Wakabayashi T, Kobayashi T. Preparation of tumor-specific magnetoliposomes and their application for hyperthermia. J. Chem. Eng. Jpn. 2001;34:66–72. [Google Scholar]
- 4.Carter CL, Allen C, Hensen DE. Relation of tumor size, lymph node status, and survival in 24740 breast cancer cases. Cancer. 1989;63:181–187. doi: 10.1002/1097-0142(19890101)63:1<181::aid-cncr2820630129>3.0.co;2-h. [DOI] [PubMed] [Google Scholar]
- 5.He B, Baird R, Butera R, Datta A, George S, Hecht B, Hero A, Lazzi G, Lee RC, Liang J, Neuman M, Peng GCY, Perreault EJ, Ramasubramanian M, Wang MD, Wikswo J, Yang GZ, Zhang YT. Grand Challenges in Interfacing Engineering with Life Sciences and Medicine. IEEE Trans. Biomed. Eng. 2013;60(3):589–598. doi: 10.1109/TBME.2013.2244886. [DOI] [PubMed] [Google Scholar]
- 6.Zhang XT, Liu J, He B. Magnetic Resonance Based Electrical Properties Tomography: A Review. IEEE Rev. Biomed. Eng. 2014;7:87–96. doi: 10.1109/RBME.2013.2297206. [DOI] [PMC free article] [PubMed] [Google Scholar]
- 7.Xu Y, He B. Magnetoacoustic tomography with magnetic induction (MAT-MI) Phys. Med. Biol. 2005;50:5175–5187. doi: 10.1088/0031-9155/50/21/015. [DOI] [PMC free article] [PubMed] [Google Scholar]
- 8.Gao N, Zhu S, He B. Estimation of electrical conductivity distribution within the human head from magnetic flux density measurement. Phys. Med. Biol. 2005;50:2675–2687. doi: 10.1088/0031-9155/50/11/016. [DOI] [PubMed] [Google Scholar]
- 9.Yang R, Li X, Song A, He B, Yan R. 3-D Reconstruction Solution to Current Density Imaging Based on Acoustoelectric Effect by Deconvolution: A Simulation Study. IEEE Trans. Biomed. Eng. 2013A;60(5):1181–1190. doi: 10.1109/TBME.2012.2228641. [DOI] [PubMed] [Google Scholar]
- 10.Bond EJ, Li X, Hagness SC, Van Veen BD. Microwave imaging via space-time beamforming for early detection of breast cancer. IEEE Trans. Antennas Propag. 2003;51(8):1690–1705. [Google Scholar]
- 11.Zhang HF, Maslov K, Stoica G, Wang LV. Functional photoacoustic microscopy for high-resolution and noninvasive in vivo imaging. Nat Biotechnol. 2006;24:848–851. doi: 10.1038/nbt1220. [DOI] [PubMed] [Google Scholar]
- 12.Bercoff J, Tanter M, Fink M. Supersonic shear imaging: a new technique for soft tissue elasticity mapping. IEEE Trans. Ultrason. Ferroelectr. Freq. Control. 2004;51(4):396–409. doi: 10.1109/tuffc.2004.1295425. [DOI] [PubMed] [Google Scholar]
- 13.Hanh M, Singh A, Sharma P, Brown S, Moudgil B. Nanoparticles as contrast agents for in-vivo bioimaging: current status and future perspectives. Anal. Bioanal. Chem. 2011;399:3–27. doi: 10.1007/s00216-010-4207-5. [DOI] [PubMed] [Google Scholar]
- 14.Ethridge M, Bischof JC. Optimizing Magnetic Nanoparticle Based Thermal Therapies Within the Physical Limits of Heating. Ann. Biomed. Eng. 2013;41:77–88. doi: 10.1007/s10439-012-0633-1. [DOI] [PubMed] [Google Scholar]
- 15.Gescheit IM, Ben-David M, Gannot I. A proposed method for thermal specific bioimaging and therapy technique for diagnosis and treatment of malignant tumors by using magentic nanoparticles. Adv. Optic. Technol. 2008;10:275080. [Google Scholar]
- 16.Artemov D, Mori N, Okollie B, Bhujwalla ZM. MR molecular imaging of the HER 2/neu receptor in breast cancer cells using targeted iron oxide nanoparticles. Magn. Reson. Med. 2003;49:403–408. doi: 10.1002/mrm.10406. [DOI] [PubMed] [Google Scholar]
- 17.Bulte JWM, Kraitchman DL. Iron oxide MR contrast agents for molecular and cellular imaging. NMR Biomed. 2004;17:484–499. doi: 10.1002/nbm.924. [DOI] [PubMed] [Google Scholar]
- 18.Zhang J, Chamberlain R, Etheridge M, Idiyatullin D, Corum C, Bischof J, Garwood M. Quantifying iron-oxide nanoparticles at high concentration based on longitudinal relaxation using a three-dimensional SWIFT look-locker sequence. Magn. Reson. Med. 2014;71:1982–1988. doi: 10.1002/mrm.25181. [DOI] [PMC free article] [PubMed] [Google Scholar]
- 19.Etheridge ML, Hurley KR, Zhang J, Jeon S, Ring HL, Hogan C, Haynes CL, Garwood M, Bischof JC. Accounting for biological aggregation in heating and imaging of magnetic nanoparticles. Technology. 2014;0:1–15. doi: 10.1142/S2339547814500198. [DOI] [PMC free article] [PubMed] [Google Scholar]
- 20.Gneveckow U, Jordan A, Scholz R, Brüss V, Waldöfner N, Ricke J, Feussner A, Hildebrandt B, Rau B, Wust P. Description and characterization of the novel hyperthermia- and thermoablation-system MFH 300F for clinical magnetic fluid hyperthermia. Med. Phys. 2004;31:1444–1451. doi: 10.1118/1.1748629. [DOI] [PubMed] [Google Scholar]
- 21.Steinberg I, Ben-David M, Gannot I. A new method for tumor detection using induced acoustic waves from tagged magnetic nanoparticles. Nanomedicine. 2012;8:569–579. doi: 10.1016/j.nano.2011.09.011. [DOI] [PubMed] [Google Scholar]
- 22.Levy A, Dayan A, Ben-David M, Gannot I. A new thermography based early detection of cancer approach based on magnetic nanoparticles theory simulation and in vitro validation. Nanomedicine. 2010;6:786–796. doi: 10.1016/j.nano.2010.06.007. [DOI] [PubMed] [Google Scholar]
- 23.Cobbold RSC. Foundations of Biomedical Ultrasound. New York: Oxford University Press; 2007. [Google Scholar]
- 24.Oraevsky AA, Karabutov AA, Savateeva EV. Enhancement of optoacoustic tissue contrast with absorbing nanoparticles. Proc. SPIE. 2010;4434:60–69. [Google Scholar]
- 25.Wang Y, Xie X, Wang X, Ku G, Gill KL, O’Neal DP, Stoica G, Wang LV. Photoacoustic tomography of a nanoshell contrast agent in the in vivo rat brain. Nano Lett. 2004;4:1689–1692. [Google Scholar]
- 26.Oldenburg A, Toublan F, Suslick K, Wei K, Boppart SA. Magnetomotive contrast for in vivo optical coherence tomography. Opt. Express. 2005;13:6597. doi: 10.1364/opex.13.006597. [DOI] [PubMed] [Google Scholar]
- 27.John R, Rezaeipoor R, Adie SG, Chaney EJ, Oldenburg AL, Marjanovic M, Haldar JP, Sutton BP, Boppart SA. In vivo magnetomotive optical molecular imaging using targeted magnetic nanoprobes. Proc. Natl. Acad. Sci. USA. 2010;107:8085. doi: 10.1073/pnas.0913679107. [DOI] [PMC free article] [PubMed] [Google Scholar]
- 28.Mehrmohammadi M, Oh J, Ma L, Yantsen E, Larson T, Mallidi S, Park S, Johnston KP, Sokolov K, Milner T. Imaging of iron oxide nanoparticles using magneto-motive ultrasound 2007. IEEE Int. Ultrason. Symp. 2007:652–655. [Google Scholar]
- 29.Oh J, Feldman MD, Kim J, Condit C, Emelianov S, Milner TE. Detection of magnetic nanoparticles in tissue using magneto-motive ultrasound. Nanotechnology. 2006;17:4183–4190. doi: 10.1088/0957-4484/17/16/031. [DOI] [PubMed] [Google Scholar]
- 30.Hu G, He B. Magnetoacoustic imaging of magnetic iron oxide nanoparticles embedded in biological tissues with microsecond magnetic stimulation. Appl. Phys. Lett. 2012;100:013704. doi: 10.1063/1.3675457. [DOI] [PMC free article] [PubMed] [Google Scholar]
- 31.Xu Y, Wang LV. Time reversal and its application to tomography with diffracting sources. Phys. Rev. Lett. 2004;92:033902. doi: 10.1103/PhysRevLett.92.033902. [DOI] [PubMed] [Google Scholar]
- 32.Ranganathan K, Walker WF. A novel beamformer design method for medical ultrasound. Part I: Theory IEEE Trans. Ultrason. Ferroelectr. Freq. Control. 2003;50:15–24. doi: 10.1109/tuffc.2003.1176522. [DOI] [PubMed] [Google Scholar]
- 33.Xia R, Li X, He B. Magnetoacoustic tomographic imaging of electrical impedance with magnetic induction. Appl. Phys. 2007;91:083903. doi: 10.1063/1.2772763. [DOI] [PMC free article] [PubMed] [Google Scholar]
- 34.Zhou L, Zhu S, He B. A Reconstruction Algorithm of Magnetoacoustic Tomography with Magnetic Induction for Acoustically Inhomogeneous Tissue. IEEE Trans. Biomed. Eng. 2014;61(6):1739–1746. doi: 10.1109/TBME.2014.2304494. [DOI] [PMC free article] [PubMed] [Google Scholar]
- 35.Rosensweig RE. Heating magnetic fluid with alternating magnetic field. J. Magn. Magn. Mater. 2002;252:370–374. [Google Scholar]
- 36.Fang C, Zhang M. Multifunctional magnetic nanoparticles for medical imaging applications. J. Mater. Chem. 2009;19:6258–6266. doi: 10.1039/b902182e. [DOI] [PMC free article] [PubMed] [Google Scholar]
- 37.Weissleder R, Stark DD, Engelstad BL, Bacon BR, Compton CC, White DL, Jacobs P, Lewis J. Superparamagnetic iron oxide: pharmacokinetics and toxicity. AJR Am. J. Roentgenol. 1989;152:167–173. doi: 10.2214/ajr.152.1.167. [DOI] [PubMed] [Google Scholar]
- 38.Mariappan L, He B. Magneto acoustic tomography with magnetic induction: bioimpedance reconstruction through vector source imaging. IEEE Trans. Med. Imaging. 2013;3:619–627. doi: 10.1109/TMI.2013.2239656. [DOI] [PMC free article] [PubMed] [Google Scholar]
- 39.Wang W, Eisenberg SR. A three-dimensional finite element method for computing magnetically induced currents in tissues. IEEE Trans. Magn. 1994;30(6):5015–5023. [Google Scholar]
- 40.Pankhurst QA, Connolly J, Jones SK, Dobson J. Applications of magnetic nanoparticles in biomedicine. J. Phys. D. Appl. Phys. 2003;36:R167. [Google Scholar]
- 41.Roth J, Basser PJ, Wikswo JP., Jr A theoretical model for magneto-acoustic imaging of bioelectric currents. IEEE Trans. Biomed. Eng. 1994;41(8):723–728. doi: 10.1109/10.310087. [DOI] [PubMed] [Google Scholar]
- 42.Mariappan L, Li X, He B. B-scan based acoustic source reconstruction for magnetoacoustic tomography with magnetic induction (MAT-MI) IEEE Trans. Biomed. Eng. 2011;5(8):713–720. doi: 10.1109/TBME.2010.2094618. [DOI] [PMC free article] [PubMed] [Google Scholar]
- 43.Shao Q, Morgounova E, Jiang C, Choi J, Bischof J, Ashkenazi S. In vivo photoacoustic lifetime imaging of tumor hypoxia in small animals. J. Biomed. Opt. 2013;18:076019. doi: 10.1117/1.JBO.18.7.076019. [DOI] [PMC free article] [PubMed] [Google Scholar]
- 44.Jiang C, Qin Z, Bischof J. Membrane-targeting approaches for enhanced cancer cell destruction with irreversible electroporation. Ann. Biomed. Eng. 2014;42:1. doi: 10.1007/s10439-013-0882-7. [DOI] [PubMed] [Google Scholar]
- 45.Bio-Medical Ferrofluids, Ferrotec Inc. [Accessed 18 July 2014];2012 Available from: https://ferrofluid.ferrotec.com/products/ferrofluid/emg. [Google Scholar]
- 46.Xu Y, Wang LHV. Reconstructions in limited-view thermoacoustic tomography. Med. Phys. 2004;31(4):724–733. doi: 10.1118/1.1644531. [DOI] [PubMed] [Google Scholar]
- 47.Anastasio MA, Zhang J, Pan X, Zou Y, Ku G, Wang LV. Half-Time Image Reconstruction in Thermoacoustic Tomography. IEEE Trans. Med. Imaging. 2005;24:2. doi: 10.1109/tmi.2004.839682. [DOI] [PubMed] [Google Scholar]
- 48.Xu M, Wang LH. Pulsed-microwave-induced termoacoustictomography: filtered backprojection in a circular measurement configuration. Med. Phys. 2002;29:1661–1669. doi: 10.1118/1.1493778. [DOI] [PubMed] [Google Scholar]
- 49.Hu G, He B. Magnetoacoustic imaging of electrical conductivity of biological tissues with magnetic induction at a spatial resolution better than 2 mm. PLOS ONE. 2011;6:e23421. doi: 10.1371/journal.pone.0023421. [DOI] [PMC free article] [PubMed] [Google Scholar]
- 50.Mariappan L, Hu G, He B. Magnetoacoustic tomography with magnetic induction for high-resolution bioimepedance imaging through vector source reconstruction under the static field of MRI magnet. Med. Phys. 2014;41(2):022902. doi: 10.1118/1.4862836. [DOI] [PMC free article] [PubMed] [Google Scholar]
- 51.Li X, He B. Multi-Excitation Magnetoacoustic Tomography with Magnetic Induction for Bioimpedance Imaging. IEEE Trans. Med. Imaging. 2010;29(10):1759–1767. doi: 10.1109/TMI.2010.2052063. [DOI] [PMC free article] [PubMed] [Google Scholar]
- 52.Zhang X, Zhu S, He B. Imaging electric properties of biological tissues by RF field mapping in MRI. IEEE Trans. Med. Imaging. 2010;29(2):474–481. doi: 10.1109/TMI.2009.2036843. [DOI] [PMC free article] [PubMed] [Google Scholar]
- 53.Xu Y, Wang LV. Effects of acoustic heterogeneity on thermoacoustic tomography in the breast. IEEE Trans. Ultrason. Ferroelectr. Freq. Control. 2003;50:1134–1146. doi: 10.1109/tuffc.2003.1235325. [DOI] [PubMed] [Google Scholar]
- 54.Wang X, Pang Y, Ku G, Xie X, Stoica G, Wang LV. Noninvasive laser-induced photoacoustic tomography for structural and functional in vivo imaging of the brain. Nat. Biotechnol. 2003;21:803–806. doi: 10.1038/nbt839. [DOI] [PubMed] [Google Scholar]
Associated Data
This section collects any data citations, data availability statements, or supplementary materials included in this article.


