

Abstract
In visual suppression paradigms, transcranial magnetic stimulation (TMS) applied ∼90 ms after visual stimulus presentation over occipital visual areas can robustly interfere with visual perception, thereby most likely affecting feedback activity from higher areas (Amassian VE, Cracco RQ, Maccabee PJ, Cracco JB, Rudell A, Eberle L. 1989. Suppression of visual perception by magnetic coil stimulation of human occipital cortex. Electroencephalogr Clin Neurophysiol 74:458–462.). It is speculated that the observed effects might stem primarily from the disruption of V1 activity. This hypothesis, although under debate, argues in favor of a special role of V1 in visual awareness. In this study, we combine TMS, functional magnetic resonance imaging, and calculation of the induced electric field to study the neural correlates of visual suppression. For parafoveal visual stimulation in the lower right half of the visual field, area V2d is shown to be the likely TMS target based on its anatomical location close to the skull surface. Furthermore, isolated stimulation of area V3 also results in robust visual suppression. Notably, V3 stimulation does not directly affect the feedback from higher visual areas that is relayed mainly via V2 to V1. These findings support the view that intact activity patterns in several early visual areas (rather than merely in V1) are likewise important for the perception of the stimulus.
Keywords: area V2, primary visual cortex, transcranial magnetic stimulation, visual awareness, visual suppression
Introduction
Studies applying transcranial magnetic stimulation (TMS) to the occipital cortex have contributed substantially to our understanding of the role of early visual areas in representing conscious visual percepts and helped to decipher the temporal dynamics of their interplay with midlevel and higher visual areas. Amassian et al. (1989) demonstrated that the perception of briefly flashed letters is suppressed when followed by an occipital TMS pulse after a delay of 80–100 ms. Since then, visual suppression paradigms were successfully applied to, for example, study the unconscious processing of stimulus characteristics like color and orientation (Boyer et al. 2005) or facial expressions (Jolij and Lamme 2005). Studies targeting the temporal window of the suppression effect showed that motion perception can be affected at later time points for stimulation close to the occipital pole (in the following called “occipital TMS”) compared with V5/MT stimulation (Beckers and Zeki 1995; Silvanto, Lavie, and Walsh 2005). Likewise, phosphenes induced by V5/MT stimulation can be affected by subsequent subthreshold occipital magnetic pulses (Pascual-Leone and Walsh 2001), and phosphenes induced by occipital TMS are affected by preceding subthreshold pulses applied to V5/MT (Silvanto, Cowey, et al. 2005). In combination, these studies demonstrate that occipital TMS mainly targets feedback information from higher to early visual areas that is necessary for conscious visual perception.
In most studies, placement of the TMS coil over early visual areas was performed relative to the inion or was guided by structural magnetic resonance images (e.g., Pascual-Leone and Walsh 2001; Boyer et al. 2005; Silvanto, Lavie, and Walsh 2005). The initial coil position was then fine-tuned using a functional TMS criterion such as the generation of phosphenes or of a suppression effect, respectively, at a certain position in the visual field. As the neural correlates underlying these functional TMS effects are unclear up to now, precise conclusions about the cortical structures targeted in this way remain elusive. Based on the fact that the TMS coil was placed close to the midline, in some studies, it was assumed that the observed effects stem predominantly from a stimulation of V1, in turn supporting a special role of V1 in conscious visual perception (Beckers and Zeki 1995; Pascual-Leone and Walsh 2001; Silvanto, Cowey, et al. 2005; Silvanto, Lavie, and Walsh 2005). In other studies, less strong assumptions were made concerning the neural targets, despite using roughly similar coil positions (Kamitani and Shimojo 1999; Silvanto et al. 2008). Up to now, only few studies have tried to localize the exact structures that are targeted by TMS applied over early visual areas. In one study, the spatial arrangement of the suppression patterns of a circular coil placed symmetrically around the midline was compared with the known visual field defects of patients (Kastner et al. 1998). It was concluded that areas V2/V3 are the main targets for eccentricities exceeding 4°, whereas no exact conclusions could be drawn for smaller eccentricities. Another study demonstrated that suppression for coil positions over extrastriate areas localized by retinotopic mapping, making it questionable if V1 is indeed the main target of occipital TMS (Kammer, Puls, Erb, and Grodd 2005). In this study, the findings were attributed to the disruption of feedback projections from higher areas to V1. However, this interpretation is contradicted by the results presented here.
We determined the visual areas targeted by TMS to induce suppression by combining a systematic mapping of the suppression effect, retinotopic mapping using functional magnetic resonance imaging (fMRI), distance measurements of the putative target areas to the skull surface, and calculation of the induced electric field. For parafoveal visual stimuli in the lower right half of the visual field—as frequently used in studies of visual suppression—, it was found that V2d is the likely target for TMS. Next, by reversing the TMS current direction, we excluded the possibilities that a particular area was accidently favored by our choice of current direction, or that TMS targets smooth feedback projections in white matter leading to V1 rather than affecting mainly gray matter. Finally, using optimized stimulus positions, a robust suppression effect was demonstrated when TMS preferentially targeted V3. In sum, our results make it unlikely that a single visual area such as V1 in isolation is the neural correlate of the visual suppression effect. Rather, intact activity patterns in several early visual areas are likewise important for the perception of the stimulus. Based on its anatomical position, area V2d seems to be the predominant target for the direct TMS effects for most stimulus positions in the visual field. On the other hand, a specific targeting of V1 seems hardly to be possible, as for the subjects tested, there was no coil position and no position of the visual stimulus that would yield stronger electric fields in V1d than V2d.
Material and Methods
General Procedures
Eight healthy subjects (age 22–33 years, 4 females) with no history of neurological disorders were included in the study. They had either normal or corrected-to-normal vision. Informed written consent was obtained for each subject prior to the first experiment. The study was approved by the local ethics committee of the Medical Faculty of the University of Tübingen. Each subject participated in several experimental sessions, in which he/she was familiarized with the overall procedure, and the TMS pretests were performed, the TMS mapping was acquired, and the fMRI data were recorded. Two successive sessions were separated by 1 week or more to prevent putative TMS carryover effects and to limit the strain on the subject. One subject was excluded from the study as the signal-to-noise ratio of the fMRI data turned out to be too low to reliably determine the positions of the visual areas.
TMS Mapping: Stimuli and Behavioral Task
The standard visual suppression paradigm (Amassian et al. 1989; Kammer, Puls, Strasburger, et al. 2005) was used in which perception of a briefly presented visual stimulus is disrupted by a subsequent TMS pulse applied over early visual areas. Subjects were sitting in a comfortable chair in front of a monitor positioned 60 cm away from their eyes. A chin rest was used to minimize head movements and testing started after an initial period of 15 min of dark adaptation. Subjects had to perform a 4 alternative forced choice (4 AFC) task in which they reported the orientation of a U-shaped hook shown in the lower right half of the visual field by pressing 1 of 4 buttons (Fig. 1A). They were instructed to “respond swiftly, but without sacrificing accuracy.” A trial lasted for 3 s during which a small fixation point was continuously shown, with a gap of 0.5 s between trials. The stimulus appeared 1 s after trial onset for one screen refresh cycle (100-Hz refresh rate) at an eccentricity of 0.45° (top left corner) to 0.9° (bottom right corner). Both the fixation point and the stimulus were shown at a luminance of 20 cd/m2 on a dark background (2 cd/m2). Presentation of the visual stimuli, triggering of the TMS stimulator, and recording of the subjects’ responses was done using Cogent 2000 (University College London, UK). The stimulus position was chosen to meet 2 competing goals. On the one hand, it is as foveal as possible in order to mimic the positions of visual stimuli and induced phosphenes, respectively, as used in previous studies (Kammer, Puls, Strasburger, et al. 2005; Silvanto, Cowey, et al. 2005). On the other hand, the TMS intensity necessary to elicit suppression increases markedly for foveal targets (Kastner et al. 1998), forcing us to show the stimulus slightly parafoveally to keep intensities in a tolerable range. Additionally, the delineation of individual visual areas using fMRI gets unreliable for eccentricities too close to the fovea (see below).
Figure 1.

(A) Typical curve for one subject demonstrating the impact of TMS on performance, depending on the stimulus onset asynchrony (SOA) between the visual stimulus and the TMS pulse. The top right sketch depicts the stimulus position in the visual display. (B) Grid of preplanned coil positions (7-mm spacing), centered around a previously determined hot spot. Using the curvature information derived from the reconstructed head, the coil plane was automatically adjusted to be tangential to the skull surface. (C) Dependence of the TMS effect on the grid position shown for one representative subject. Bar height and color depict the amount of reduction in performance. Please note the abrupt change in performance between neighboring coil positions showing the maximal TMS effect (red) and no effect at all (blue) which occurs within 7 mm. (D) Same plot as depicted in (C), overlaid on the individual reconstructed left hemisphere. Color and size of the spheres code the amount of performance drop at the corresponding coil position. The white sphere (highlighted by the red arrow) represents the CoM of the TMS map, which is projected onto the hemisphere. (E) Electric field distribution for an occipital coil position, normalized to the maximal field strength (coded in red). The field decays quickly with increasing distance to the skull surface.
TMS Mapping: Experimental Procedures and Data Analysis
The visual suppression effect was mapped using a Medtronic MagPro X100 stimulator (MagVenture, Farum, Denmark) with a MC-B70 butterfly coil. In order to minimize TMS intensity, biphasic pulses were applied, and the optimal coil orientation was used with the handle pointing to the left (Corthout et al. 2001). The coil position was monitored using a neuronavigation system (BrainView, Fraunhofer IPA, Germany; see Kammer et al. 2007 for a description of the system). The spatial accuracy of neuronavigation was checked prior to TMS mapping and immediately afterward. The positions of clearly visible landmarks (e.g., the nasion and inion) were determined in the magnetic resonance (MR) image as well as on the real head using a pointing device, and these 2 positions as displayed by the neuronavigation system were visually compared to check for any discrepancies. The combination of the chin rest stabilizing the frontal part of the head and the TMS coil attached to the occipital part resulted in very stable head positions, as also monitored by the neuronavigation system. Movements were usually kept below 1 mm while testing a particular grid position. In some subjects, testing some of the most inferior grid points resulted in slight twitches of the neck muscles. However, even in these cases, the spatial position as given by the neuronavigation system usually stayed stable, and blocks with movements >1 mm were repeated.
In preexperiments, the coil position showing the most reliable suppression effect was roughly determined (“hot spot” search), thereby employing the same stimuli and the 4 AFC task also used in the subsequent mapping experiments. The timing of the TMS pulse relative to the visual stimulus was optimized to get a behavioral performance of 50–60% at the lowest TMS intensity possible. Depending on the subject, the most effective time point for the TMS pulse ranged from 80 to 95 ms. The performance level of 50–60% was chosen in order to start with a TMS intensity yielding stable suppression but at the same time being still in the dynamic range of the performance curve of the 4 AFC task. Using too high intensities would have resulted in floor effects (i.e., too many map positions with maximal suppression) that would have diminished the spatial resolution of our mapping procedure.
A grid of coil positions centered around the hot spot was automatically planned using custom-written MATLAB (The MathWorks, Natick, MA) routines, based on the surface reconstruction of the head done in BrainVoyager (Fig. 1B). High spatial resolution of the mapping procedure was ensured by using a regular grid with an equidistant spacing of 7 mm, in turn allowing us to precisely relate the TMS results to the individual brain anatomy. A custom-made holding device was used to reliably keep the position of the coil in a range of 1 mm or better to the preplanned position during the time period needed to test a particular grid point. At each grid position, the visual suppression effect was measured using 40 trials showing the visual stimulus in the right hemifield. Intermingled were 10 control trials with the stimulus in the left hemifield in order to check for the subject's fatigue and attention. Starting with the hot spot, the coil was systematically moved outwards in a radial fashion until behavioral performance reached 95% or higher again (Fig. 1C,D). Based on the mapping data, a spatial center of mass (CoM) of the suppression effect caused by TMS was determined (Fig. 1D). The coordinates of each coil position were weighted with the corresponding amount of performance drop, and the average of the resulting values was taken as CoM. The CoM was subsequently projected onto the reconstructed left hemisphere to determine the center of the cortical tissue that was most strongly affected by the TMS pulse.
It is well established that the impact of biphasic TMS pulses on cortical neurons depends on current direction. The visual suppression effect is stronger when the initial current flows from medial to lateral than in the opposite direction (Corthout et al. 2001). The TMS intensity, which is necessary to induce phosphenes, depends systematically on the orientation of the TMS coil in relation to the gyrus underneath the coil center (Kammer et al. 2007). In the motor system, motor thresholds for biphasic stimuli differ by approximately 20% when comparing pulses having the optimal and reversed current directions, respectively (Kammer et al. 2001). Also, the reversed direction can induce different I-wave patterns (di Lazzaro et al. 2001, 2004), indicating that partially different neural subpopulations are affected. We therefore attempted to exclude the possibility that our findings were biased by a consistent relationship between the orientation of the induced currents and the anatomy of the underlying gyri. In each subject, we determined the gyrus that was closest to the cortical projection of the TMS CoM, manually fitted a line to it, and measured the angle by which the line deviated from the horizontal direction as given by the TMS coil handle. Inspection of the resulting values, pooled across subjects, allowed us to check for a putative consistent orientation of the gyrus relative to the induced currents. The procedure described above was repeated using the mean coordinates of V1d, V2d, and V3 as determined by fMRI instead of the cortical TMS CoM projection. Finally, in order to further exclude the possibility that our choice of current direction biased the results in favor of a particular visual area, the TMS mapping was repeated in 4 subjects with the reversed current direction.
It was previously hypothesized that TMS might primarily target white matter fibers projecting to V1 rather than cortical gray matter even for coil positions over extrastriate areas (Kammer, Puls, Erb, and Grodd 2005). This view is contradicted by the finding that TMS applied to the motor cortex mainly induces I-waves (di Lazzaro et al. 2004). A predominant induction of D-waves is only seen for suboptimal coil orientations at which significantly higher intensities are needed to evoke motor responses. Also, in vitro and modeling studies suggest that nerve bends, terminals, and branches represent low-threshold points that are more easily excited by TMS than straight or smoothly curved fiber parts (Hause 1975; Tranchina and Nicholson 1986; Amassian et al. 1992; Maccabee et al. 1993, 1998; Nagarajan et al. 1993; Abdeen and Stuchly 1994; Hyodo and Ueno 1996). The stronger the electric field at these low-threshold points, the more likely they get activated. As cortical neurons possess complex geometric shapes with many low-threshold points, it is thought that TMS mainly targets gray matter rather than more smoothly curved white matter bundles.
This is in marked contrast to smoothly curved peripheral nerves where excitation is thought to occur at the peaks of the spatial derivative of the field component parallel to the fiber (Roth et al. 1991; Maccabee et al. 1998). These positions are clearly offset from the point at which the electric field itself peaks. Although the position of the maximum of the electric field induced along a nerve fiber stays constant when reversing the current direction, the position of the maximal spatial derivative clearly changes. In other words, the position at which a nerve fiber is most strongly affected by the TMS pulse changes with current direction. Using mammalian phrenic nerve preparations, it has been demonstrated that this also holds for biphasic TMS stimuli as the second half of the pulse affects the membrane potential more strongly than the first half (Maccabee et al. 1998). This has been confirmed for the stimulation of the facial nerve in humans (Corthout et al. 2001). We therefore reasoned that if smooth white matter bundles projecting to V1 were the target of TMS in visual suppression, they should at least partly behave like peripheral neurons. Reversing the current direction should shift the position at which the fibers are maximally excited and therefore shift the CoMs of the TMS maps (the effective component of the induced field is given by the projection of the electric field vector onto the fiber, so that a shift would also be observed if the targeted fibers were not perfectly parallel to the induced field, but obliquely oriented). Finding no systematic shift when reversing the current direction would therefore further support gray matter as being the main TMS target, also in case of visual suppression. To summarize, 2 different scenarios can explain how a current reversal could systematically affect the TMS CoM positions. As outlined above, one scenario is based on the putative stimulation of white matter bundles. Alternatively, gray matter excitability might depend on current orientation, and this dependency might be different for the different visual areas. Finding no systematic change of the CoM positions would therefore strengthen the view that the gray matter of the visual area directly underneath the CoM is consistently the main TMS target in case of visual suppression.
Retinotopic Mapping: Stimuli and Behavioral Task
In the fMRI experiments, stimuli were presented on a screen located 100 cm away from the subject's eyes by means of a liquid crystal display projector (Model JVC DLA-SX21). For visual mapping, phase-encoded black and white checkerboard stimuli (thin rays and expanding ring, respectively) were shown at maximum contrast and a flicker rate of 4 Hz. Extension was from 0.2° to 5.7° visual angle. The stimuli passed through a full display cycle in 30 s, and 16 cycles were shown in each run. For the initial 3 subjects, the ray stimulus was shown for 2 runs and the expanding ring for 1 run. The resulting activation maps in response to the ray stimulus did not show noticeable differences when basing the analysis on the data of a single run rather than the pooled data from 2 runs. Consequently, the ray was shown for only 1 run in the remaining 4 subjects.
A localizer run was used to determine the subregions of the visual areas corresponding to the parafoveal stimulus position of the TMS experiments. Randomly oriented hooks were continuously flashed at 4 Hz at a spatial position identical to the one used in the TMS experiments. The run consisted of an on–off block design with 8 × 30 s stimulation and 8 × 30 s baseline (blank screen). During the visual mapping runs and the localizer experiment, a small fixation spot (diameter 0.22°) surrounded by a thin gray ring (diameter 0.24°) was present all the time. Subjects had to respond to color changes of the spot by a button press.
Retinotopic Mapping: Imaging Parameters and Data Analysis
Scanning was performed on a Siemens 3T TIM Trio (Siemens, Erlangen, Germany) with a 12-channel head coil. Functional images were acquired using T2*-weighted gradient echo-planar imaging (time repetition [TR] 1500 ms, time echo [TE] 35 ms, in-plane resolution 3 × 3 mm2, field of view 192 mm, and flip angle 70°). Twenty coronal slices (thickness 2.5 mm, gap 0.5 mm) were obtained with the most posterior slice covering the occipital poles. A total of 324 volumes were acquired per experimental run, including 4 initial volumes, which were discarded to allow for T1 equilibration. T1-weighted structural images used for neuronavigation and for the analysis of the visual mapping data, respectively, were acquired in a separate session prior to the first TMS experiment (magnetization prepared rapid acquisition gradient echo, TR 1900 ms, TE 2.26 ms, time to inversion 900 ms, flip angle 9°, 192 coronal slices, 1-mm iso-voxel resolution, and 2 averages).
The visual mapping data were analyzed by means of BrainVoyager 2000 (Brain Innovation, Maastricht, The Netherlands) using standard techniques (Sereno et al. 1995; DeYoe et al. 1996; Engel et al. 1997; Tootell et al. 1997; Hadjikhani et al. 1998). Dorsal visual areas V1d, V2d, V3, and V3A were identified based on the reversals in response phase to the rotating ray stimulus on the reconstructed and inflated left hemisphere (Fig. 2A and Supplementary Fig. S3). Subsequently, the subregions corresponding to cortical representations of the hook stimulus were determined by thresholding the blood oxygen level–dependent (BOLD) activity pattern obtained in the localizer run at the highest level, which still yielded activation blobs in all 4 visual areas. By that, focused subregions were obtained for all visual areas. In all subjects, the threshold chosen substantially exceeded P = 10−6 (uncorrected). The intersection between the thresholded BOLD activation map and the visual areas was determined, and the mean coordinates of the resulting subregions were taken (Fig. 2B). In order to compare the distances of the different cortical stimulus representations with the skull surface, the closest distance of the mean coordinates of each subregion to the skull surface was determined using a custom-written MATLAB script, and the surface reconstruction of the head obtained in BrainVoyager. Finally, the lag values of the eccentricity maps derived from the expanding ring stimuli were used to verify the positions of the intersections, demonstrating a good agreement of the stimulus positions obtained from the localizer run with the eccentricity maps (mean stimulus extension ± standard error [SE]: V1 0.52° ± 0.02° to 1.01° ± 0.04°; V2 0.50° ± 0.03° to 0.98° ± 0.06°; V3 0.49° ± 0.06° to 0.95° ± 0.12°; and V3A 0.42° ± 0.06° to 0.82° ± 0.11°).
Figure 2.

Workflow used to determine the stimulus representations within visual areas V1d, V2d, V3, and V3A. (A) The borders of the visual areas were determined based on the polar angle maps. (B) The stimulus representations were localized by intersecting the visual areas with the BOLD activity pattern in response to the hook stimulus (individually thresholded at P ≪ 10−6), as determined in a separate localizer run. Finally, the mean coordinates of the stimulus representations were taken, and their distances to the cortical projection of the TMS CoM (white dot) were measured.
Calculation of the Induced Electric Field
For coil positions of interest, such as the CoM, we sought to determine how much the electric field induced by TMS differs across areas V1d to V3A. Therefore, the field distribution was calculated on the reconstructed left hemisphere using a spherical head model (Fig. 1E; Sarvas 1987; Ravazzani et al. 1996). The sphere was locally fitted to the inner curvature of the skull in the region underneath the TMS coil, and the mean field strength values were determined in the subregions of areas V1d to V3A corresponding to the hook stimuli. We were interested to see if the relation between the values in the different subregions shows a consistent pattern across subjects. In order to discard constant offsets between subjects caused by different TMS stimulation intensities, the field strength values for each subject were normalized to the mean value across all subregions, so that group averages for the normalized values of each subregion could be determined.
The spherical model assumes the profile of the tangential conductivity component to be a radially symmetric function, that is, the differences in conductivity of skull, liquor, gray, and white matter are approximated as spherical shells. Conductivity components directed in radial direction have been shown not to influence the induced field and may therefore be anisotropic (as, e.g., caused by ascending white matter bundles; Ilmoniemi 1995). This was confirmed in a recent study of De Lucia et al. (2007) who used the finite-elements method to determine the electric field on the basis of individual conductivity profiles derived from diffusion tensor images. They demonstrated that anisotropies caused by white matter bundles affect the electric field distribution in white matter but not in gray matter. Furthermore, even when considering white matter anisotropies, the maxima of the induced fields were always located on the surface of the brain, and the fields decayed with increasing distance to the skull. A similar pattern was found by Wagner et al. (2008) when simulating the effects of brain atrophy on the induced fields. At the brain surface, current densities consistently decreased with increasing scalp-to-cortex distances. Neither De Lucia et al. (2007) nor Wagner et al. (2004, 2008) directly compared a spherical head model with their more complex models. Still, the indirect evidence discussed above suggests that the spherical model is reasonably accurate, at least as long as superficial brain structures are considered. Likewise, in magnetoencephalography, direct comparisons of the spherical model with more complex models have demonstrated only minor deviations between the results for superficial brain structures (Hämäläinen and Sarvas 1989; Haueisen et al. 1995). Importantly, the theoretical results derived with the spherical model have been shown to be in good agreement with physiological measurements using TMS on the motor cortex (Thielscher and Kammer 2002). None of the electric field models outlined above can be used to directly explain the dependence of neural excitability thresholds on the direction of the current orientations, as observed for motor cortex stimulation (see, e.g., Kammer et al. 2001). This would require additional modeling of the microscopic effects of the induced electric fields on the network of affected neurons. When using calculated electric fields to explain behavioral TMS effects, as attempted here, it is therefore important to control for the effect of current orientation, either by holding the induced current orientation in the targeted region approximately constant throughout the experiment or by demonstrating that there is no significant dependency of the behavioral effects on current direction.
Stimulation of Area V3A
Among dorsal visual areas V1d to V3A, only area V3A contains a representation of the contralateral upper quarterfield (Tootell et al. 1997). In consequence, the specific effect of V3A stimulation on visual suppression could be tested using a stimulus shown at the same eccentricity as before but mirrored at the horizontal meridian. The fMRI localizer experiment was repeated to determine the cortical representation of the new stimulus position. The coil was optimally placed above the stimulus representation in V3A. Electric field calculations were used to adjust stimulation intensity, making sure that the average field strength in V3A matched or exceeded the field strength in V2d that had been the highest across areas V1d to V3A when performing the TMS mapping. Four of the 7 subjects were included in the control experiment. In the remaining 3 subjects, the stimulus representation was located too deep in the sulcus so that the field strength in V3A, even at 100% stimulation intensity, did not match the field strength values previously achieved in V2d. The coil orientation and current direction were kept constant to those used in the original mapping experiment, and the time delay of the TMS pulse was varied between 63 and 119 ms in steps of 7 ms. Altogether, 25 trials were applied per delay, including 5 control trials in which the stimulus was shown in the contralateral field. Several short runs separated by breaks were used to acquire the complete number of trials, with the TMS time delays randomized between trials. As the strength of visual suppression varies with coil orientation (Corthout et al. 2001), the results might have been confounded by the chosen current direction. An additional run was used to control for this possibility, in which TMS pulses having the reversed current direction were applied at a delay of 85 ms (20 additional trials plus 5 controls).
Stimulation of Area V3
The contribution of V3 stimulation to visual suppression was tested by shifting the visual stimulus to a peripheral position close to the vertical meridian in order to maximize the cortical distance between the stimulus representations in V3 and V1d/V2d, respectively, as determined by repeating the fMRI localizer experiment (Fig. 4A). Additionally, the coil handle was oriented to the top or top right (depending on the individual positions of the visual areas), thereby minimizing the field extension along the direction pointing from V2d to V3. The goal was to create “crossing” electric field strength patterns when positioning the coil above V2d and V3, respectively, as shown on the left side of Figure 4B: Positions above V2d led to significantly higher field strengths in V2d than in V3 (red lines), whereas positions above V3 resulted in the opposite pattern (blue lines). These patterns could be achieved in 4 of the 7 subjects. In the remaining 3 subjects, the stimulus representation of V3 was located too deep in the brain, so that the field strength was maximal in V2d even for coil positions above V3. In pretests, the stimulation intensities were adjusted using several time points for the TMS pulse so that the maximal strength of the suppression effect was comparable for the 2 coil positions. The current direction resulting in a better overall suppression effect during both V2d and V3 stimulation was chosen for latter testing (normal in 3 subjects, reversed in 1 subject). In the main experiment, the TMS time point was varied from 70 to 100 ms in steps of 3 ms (79–110 ms in 1 subject). Forty trials were applied per time point, including 8 in which the stimulus was shown in the contralateral hemifield. The overall number of trials was acquired in several short runs. The target area (V2d or V3) was selected in a pseudorandomized fashion for each run, and the TMS time point was randomized between trials to prevent sequence effects. In 2 subjects, the measurements were repeated with the time steps increased to 5 ms so that the time range up to 122 ms (S2) and 129 ms (S4), respectively, could be covered.
Figure 4.

(A) Usage of a peripheral stimulus position close to the vertical meridian maximizes the distances between the corresponding stimulus representations in V2d and V3 (indicated by the red arrow). (B) Left: For the stimulus position shown in (A), the average field strength induced in the cortical representations of areas V1d to V3A is depicted (mean curve ± SE; N = 4). The coil was optimally placed above V2d (red curve) and V3 (blue), respectively. The coil orientation was individually chosen to minimize the extent of the field in the direction V2d–V3. In the stimulus representation of V2d, field strength was 25% (±4% SE) higher for the coil position directly above V2d compared with the position above V3. The opposite pattern was achieved for the representation in V3, with the field strength being 29% (±5% SE) higher for the coil position above V3. Middle: Average performance patterns for the 2 coil positions in dependence on the TMS delay relative to the visual stimulus (N = 4). Right: Difference between the 2 performance patterns, averaged across subjects (error bars indicate the SE). Negative values indicate stronger suppression for the coil position above V2d, and positive values indicate stronger values for the position above V3. (C) Individual field strength (top row) and performance patterns (bottom row) of the 4 subjects. Minimal performance occurred consistently at earlier time points for coil placement above V2d than for placement above V3 (marked by black arrowheads in the bottom row). Subject S1: The suppression curve for area V2d was measured twice, one time at 67% stimulation intensity and a second time at 70%. The lower intensity yielded a suppression effect being weaker than that for V3 stimulation at 72% intensity, whereas the higher intensity resulted in a suppression effect being substantially stronger. Therefore, the average of both measurements is plotted here. Subject S4: The time range was adjusted from 79 to 110 ms to capture the minima of both performance curves.
Results
Comparison of the TMS Mapping Results with the BOLD Activation Patterns
A typical example for the TMS maps acquired in our experiment is shown in Figure 1C. On average, performance was reduced to 44.1% (±10.0% standard deviation [SD]) at the map position that exhibited the maximal behavioral effect. This is close to the lower limit of 25% for a 4 AFC task, demonstrating that TMS induced robust visual suppression. The average stimulation intensity was 71 ± 6% (SD), which was above phosphene threshold in all subjects. However, the perception of phosphenes clearly depended on the amount of attention the subjects paid to them. When focusing on the task, subjects reported that they experienced only weak or no phosphenes, suggesting that suppression was caused by transient scotomal effects. When asked to concentrate on phosphenes rather than on the visual stimulus, all subjects reliably reported their perception (see also Kammer, Puls, Strasburger, et al. 2005).
Performance was most strongly affected at usually 2–3 map positions, with an abrupt and complete recovery often observed at the neighboring positions within 7-mm distance. This demonstrates a high functional resolution of the TMS mapping procedure. In a first step, we projected the CoMs of the TMS maps onto the cortex to determine if one of the early visual areas is the preferential TMS target in the context of visual suppression. With an average distance of 5.1 mm (±0.6 mm SE) across subjects, the TMS CoM projection was closest to the mean coordinates of the stimulus representation of area V2d (Fig. 3A; see Supplementary Fig. S1 for the individual results). The distances to the representations in the neighboring areas V1d, V3, and V3A were significantly larger (P < 0.05; paired t-tests Bonferroni corrected for posthoc comparisons).
Figure 3.
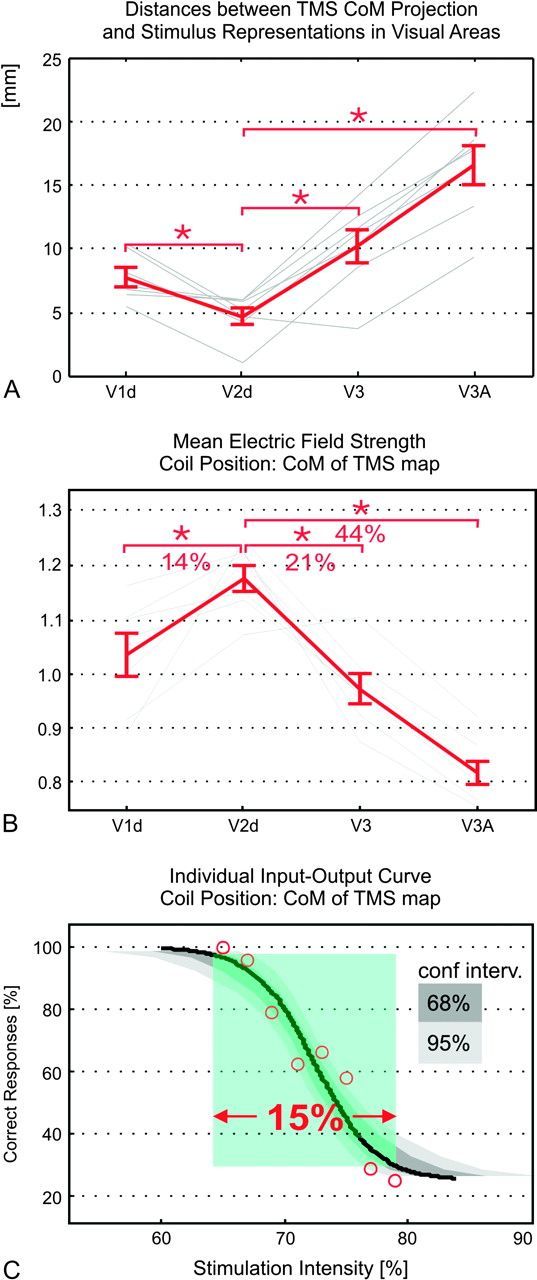
(A) Distances between the stimulus representations and the cortical projection of the TMS CoM. Individual results are shown in gray, the red curve depicts the mean ± SE (N = 7). Area V2d is significantly closer to the TMS CoM projection than the other areas (paired t-test at P = 0.05, Bonferroni corrected for posthoc comparisons). (B) Values for the electric field strength induced in the stimulus representations in areas V1d to V3A when the coil is positioned at the CoM of the TMS map. The individual field strength patterns were first normalized to mean value across all areas (resulting in the gray curves), and then averaged across subjects to yield the mean curve ± SE (red; N = 7). The field strength in V2d was significantly higher than in other areas (paired t-test at P = 0.05, Bonferroni corrected for posthoc comparisons). (C) Typical sigmoidal dependency of performance on TMS stimulation intensity (Subject S4). The detection rate decreases from almost 100% correct to chance level within a change of ∼15% in TMS intensity. The sigmoidal fit shown in black is significant at P = 0.05 (tested using psignifit, Wichmann and Hill 2001a, 2001b). The suppression curves of 3 additional subjects are comparable to the one shown here and can be found in Supplementary Fig. S2E.
We controlled for the possibility that our results were biased by a systematic orientation of the induced electric field to one or more of the local anatomical structures of visual areas V1d to V3A. The angle between the coil handle and the gyrus next to the mean coordinate of the cortical stimulus representation in V1d, V2d, and V3, respectively, was measured. The same analysis was repeated for the gyrus next to the cortical projection of the TMS CoM. For all 3 stimulus representations and the TMS CoM projection, the angles jittered rather randomly across subjects, as expressed by large SDs and large differences between the minimal and maximal angles (Table 1). To conclude, it is very unlikely that the coil orientation exerted a systematic bias on our results.
Table 1.
Angle between gyrus and coil orientation
| V1d | V2d | V3 | TMS CoM projection | Range | |
| Mean | 30° | 7° | 2° | 3° | |
| Min | −32° | −38° | −79° | −46° | −90°–90° |
| Max | 71° | 87° | 78° | 65° | |
| Max–Min | 103° | 125° | 157° | 111° | 0°–180° |
| SD | 36° | 46° | 68° | 48° | 0°–180° |
Additionally, in 4 subjects, the TMS mapping was repeated for the reversed current direction to further control for the possibility that our choice of current direction biased the TMS CoM positions (mean intensity ± SD: 77 ± 8%). No systematic effect of current direction could be observed, with the cortical projection of the TMS CoM being consistently closest to the stimulus representation in area V2d (please refer to Supplementary Fig. S2A for detailed results). This makes it unlikely that 1) smoothly oriented white matter bundles are the main TMS target in visual suppression or that 2) the original current direction was accidentally chosen to, for example, be optimal for V2d but suboptimal for V1d.
Finally, the Montreal Neurological Institute coordinates of the 11 TMS CoM projections were determined and compared with the positions of areas BA17 and BA18, as obtained from histology in 10 postmortem brains (see Supplementary Fig. S4 for details; Amunts et al. 2000; Eickhoff et al. 2005). The CoM projections were predominantly located in BA18. This confirms that, on average, the CoM projection relates to a position in area V2d, even when considering population data rather than individual retinotopic maps.
Differences in Electric Field Strength Induced in Visual Areas V1d to V3A
The findings presented above might hint toward V2d being the neural correlate of visual suppression. However, the stimulus representations in V1d, V2d, and V3 are in close neighborhood to each other. Thus, an alternative explanation might be that, given the limited focality of the electric field induced by TMS, the overall impact on these 3 areas in combination might be maximized for coil positions above their common center, which is located in V2d. According to this interpretation, visual suppression would be caused by the simultaneous stimulation of several areas, excluding a predominant role of single areas such as V2d. In order to test this hypothesis, we employed calculation of the electric field and determined how much the induced field strengths differ between the visual areas when the TMS coil is placed at the CoM. On average, the field induced in the stimulus representation of V2d is 14% and 21% stronger than the field induced in the representations in V1d and V3, respectively (Fig. 3B; P < 0.05; paired t-tests Bonferroni corrected for posthoc comparisons). The higher field strengths in V2d are mainly caused by the fact that the stimulus representation in V2d is significantly closer to the skull surface than the other representations (see Supplementary Fig. S2B for detailed results).
Critically, differences of ≥14% in field strength are sufficient to assume that TMS has a significantly higher impact on the neural activity in V2d than in other areas. As field strength scales linearly with stimulation intensity, this can be illustrated by means of input–output curves depicting the dependence of task performance on stimulus intensity for a fixed coil position (examples are shown in Fig. 3C and Supplementary Fig. S2E; see also Thielscher and Kammer 2002, Fig. 4 for a related example in the motor system). It is sufficient to vary the stimulation intensity by 15% to cover the complete range from 100% performance to chance level. The electric field at each point in the head is proportional to the stimulation intensity (eq. 6 in Ilmoniemi et al. 1999), so that an intensity increase of 15% directly translates into an increase of the induced field strength by the same amount at each cortical position. This is a direct consequence of the electric field induced by TMS obeying the quasistatic approximation. In other words, increasing the intensity by 15% shifts the field induced in V1d as shown in Figure 3B to the original level depicted for V2d. This suggests that visual suppression can be induced at stimulation intensities at which the TMS pulse mainly affects area V2d but not the neighboring areas. The predominant targeting of the neighboring visual areas is hardly possible, as the field strength remains maximal in the stimulus representation of V2d even when the TMS coil is optimally placed over one of the other areas (see Supplementary Fig. S2C for details). This tendency is rather weak and not statistically significant. However, for parafoveal visual stimuli, it prevents testing if the other dorsal visual areas contribute to the suppression effect by simply placing the coil above them.
Optimized Stimulation of Area V3A
The results above hint toward the CoM of the TMS map being located over V2d because it is anatomically different (i.e., on average closer to the skull surface). An alternative explanation would be that it differs functionally from its neighboring areas, meaning that V2d but not the other areas contribute to the conscious representation of the stimulus. In order to control for the second possibility, additional measurements were conducted in which the coil placement and the stimulus position in the visual field were optimized to specifically target the neighboring areas. Unlike areas V1d to V3, visual area V3A contains a representation of the upper contralateral quarterfield (Tootell et al. 1997). This allowed us to test if V3A stimulation contributes to visual suppression by mirroring the original visual stimulus at the horizontal meridian. The fMRI localizer experiment was repeated so that the TMS coil could be placed exactly over the new stimulus representation in V3A. Using electric field calculations, the stimulation intensity was adjusted so that the field strength in V3A matched the field strength that had been effective in targeting area V2d. The original and reversed current directions were used for stimulation, and TMS delays ranging from 63 to 119 ms were tested (see Material and Methods section for details). In all 4 subjects, behavioral performance continuously stayed at 100%, demonstrating that stimulation of V3A does not contribute to visual suppression.
Optimized Stimulation of Area V3
The contribution of V3 stimulation to visual suppression was tested by shifting the visual stimulus to a peripheral position close to the vertical meridian and orienting the coil handle to the top or top right (depending on the individual positions of the visual areas). In 4 of 7 subjects, this allowed us to predominantly target either the stimulus representations in V3 and V1d/V2d, respectively, as demonstrated by electric field calculations. The results clearly demonstrate that the focused stimulation of V3 leads to visual suppression. Interestingly, similar electric field strengths were necessary for V3 and V2d stimulation to elicit suppression effects of comparable magnitude (mean field strength across subjects ± SE in V2d/V3: 136.3 ± 7.8 vs. 134.3 ± 4.9 V/m; Fig. 4B left). The maximal suppression effect caused by V3 stimulation consistently occurred at a later time point compared with V2d stimulation (bottom row of Fig. 4C). This difference can also be seen when averaging across subjects (Fig. 4B middle and right), even though the time points of maximal suppression jitter between subjects. A repeated measures analysis of variance of the performance differences (Fig. 4B right) revealed a significant main effect of TMS delay (F7,27 = 3.49; P = 0.0086). Subsequent pairwise comparisons demonstrated that the performance differences for the delays from 76 to 85 ms are significantly lower than the performance differences observed for 91 ms onwards (P < 0.05, Fisher's LSD posthoc tests). Two subjects were retested to assess the TMS effects at later stimulus onset asynchronies (SOAs), in particular for V3 stimulation (Supplementary Fig. S2F). In both cases, performance recovered swiftly for SOAs longer than the originally tested time window.
Critically, the visual stimulus position could not be optimized to allow for a focused stimulation of V1d. The maximal distance between the stimulus representation in V1d and the neighboring representation in V2d occurs for stimulus positions close to the horizontal meridian. Unfortunately, these positions are represented within the calcarine sulcus, resulting in large coil–cortex distances. In contrast, V1d positions close to the vertical meridian have the smallest coil–cortex distances but directly neighbor the corresponding position in V2d, again preventing an isolated targeting of V1d via TMS (see, e.g., the electric field pattern for the stimulus used for testing area V3 as shown in Supplementary Fig. S2D).
Discussion
The finding that the CoMs of the TMS maps were mainly located above area V2d shows that V1 gray matter is not the primary target of TMS in the case of visual suppression. The thresholds at which V1 neurons are susceptible to magnetic pulses in the case of visual suppression cannot be markedly lower than those of V2 neurons, as otherwise the TMS CoM locations would be shifted to a position over V1. This was the case for parafoveal targets in the lower visual field as tested here and will therefore also hold for more peripheral targets whose V1 representations are located more deeply in the calcarine sulcus. Control experiments showed that our results were not biased by our particular choice of induced current direction. Checking the angles between the coil handle and the gyri closest to the cortical stimulus representations in V1d, V2d, and V3, respectively, did not reveal any systematic dependency. Additionally, reversing the current orientation did not exert systematic effects on the TMS CoM position. It is unlikely that area V2d is functionally specific in case of visual suppression, as targeting V3 also yielded behavioral effects. In this case, focal stimulation was achieved by shifting the stimulus to a peripheral position close to the lower vertical meridian (thereby maximizing the cortical distance between the stimulus representations in V2d and V3, respectively, at the cost of minimizing the distances of the representations in V2d and V1d). This resulted in robust calculated field strength differences between V2d and V3, respectively, in the range of 25% and 29% (Fig. 4B), as well as in different timing curves for suppression, with the peak suppression effect occurring consistently later in time when targeting V3. Interestingly, predominant stimulation of V3A, achieved by employing a stimulus in the upper visual field, did not result in suppression. This finding likely relates to the fact that V3A is mainly involved in the processing of motion stimuli (Tootell et al. 1997; McKeefry et al. 2008). Importantly, for V1 and the subjects tested, there was no coil position and no position for the visual stimulus that would yield stronger electric fields in V1d than V2d.
When considered in isolation, the finding of the CoMs being located above area V2d lends itself to several different interpretations. For example, based on the finding that “phosphene contours and texture remained quite stable with different coil positions,” it was suggested that TMS might primarily target white matter fibers projecting to V1 rather than cortical gray matter even for coil positions over extrastriate areas (Kammer, Puls, Erb, and Grodd 2005). However, this finding leaves room for other interpretations than the stimulation of white matter. Alternatively, the reported observation can stem from the fact that the subpart of visual areas closest to the skull exhibits consistently the strongest stimulation when the coil position is changed. A similar line of reasoning also arguing in favor of V1 or feedback to V1 being the main TMS targets is based on a lesion patient with damaged primary visual cortex who is unable to perceive TMS-induced phosphenes (Cowey and Walsh 2000). As parts of V2 are also affected in this patient, it seems unlikely that the lesion is restricted to gray matter without affecting white matter fibers leading to neighboring early visual areas. Also, it seems debatable if results from a lesion patient can be applied in a one-to-one fashion to TMS in healthy subjects. Structural lesions in the primary visual cortex deprive the other early visual areas of their dominant bottom-up input, which might result in profound impairment of their normal function and lead to substantial long-term functional reorganization (Siebner and Rothwell 2003).
Importantly, our control experiments provide direct evidence derived from the investigation of healthy subjects arguing against the hypothesis that TMS primarily acts on feedback to V1. Reversing the current direction did not shift the CoMs of the TMS maps away from their position over V2d, making it unlikely that smooth white matter bundles were the primary target of TMS (Maccabee et al. 1993, 1998). In addition, the finding that maximal suppression occurs later for V3 compared with V2d stimulation makes it unlikely that feedback to V1 was targeted: As stimulation over V3 would have affected the white matter fibers (or also gray matter) at a position further away from V1, the TMS effect over V3 would have peaked at an earlier time point if feedback to V1 had been affected. This line of reasoning was employed in Silvanto, Lavie, and Walsh (2005) in which it was demonstrated that TMS applied to V5/MT+ affects motion processing at an earlier time point compared with stimulation of early visual areas, arguing in favor of feedback activity from V5/MT+ being integrated by the early visual areas. However, in our study, the opposite pattern was found for the stimulation of V3 and V2d, respectively. Our results are in line with those presented by Kammer et al. (2007) on the dependency of phosphene thresholds on current direction. The activation threshold of a smoothly oriented nerve fiber strongly depends on the orientation of the induced currents relative to the fiber and is maximal when the currents are perpendicular to it (Ruohonen et al. 1996; Lontis et al. 2008). However, Kammer et al. (2007) demonstrated a relative increase of only 8% for phosphene thresholds when changing from optimal to perpendicular current directions. Even when considering that volume conduction effects will ameliorate the orientation dependency for nerve fibers in the case of brain stimulation, the ratio demonstrated by Kammer et al. (2007) probably is too low to support predominant white matter stimulation, thereby contradicting his original suggestion that white matter is the main TMS target in visual suppression (Kammer, Puls, Erb, and Grodd 2005). Taken together, the above findings make it unlikely that TMS specifically targets feedback activity to V1d.
The parafoveal part of V2d is significantly closer to the surface than the neighboring areas. Thus, in the case of visual suppression, the direct TMS effects might mainly be focused on V2d. Still, the question arises whether the depth differences are sufficient to conclude that V2d is the primary TMS target or if a position over V2d rather maximizes the overall impact of the pulses on V1d to V3 at the same time. Using a theoretical model to calculate the induced field, we found that the differences in field strength between V2d and the neighboring areas are around 14% (V1d) and 21% (V3), respectively. As a variation of TMS intensity by ∼15% covers the complete range from 100% performance to chance level (Fig. 3C), we argue that the direct TMS effects are focused on V2d, at least at intensities at which visual suppression is not maximal. This line of reasoning rests on the assumption that the electric field thresholds for visual suppression are similar or higher for areas V3 and V1d compared with area V2d. Even though the thresholds are unknown, we suggest that this assumption is justified, as lower thresholds in 1 of the 2 other areas would shift the CoM of the TMS map to a position over that area. In addition, the finding of different suppression curves for optimized V2d and V3 stimulation, respectively, demonstrates that field strength differences of 25% are sufficient to act differently on neighboring areas. These differences are higher than those found in the main experiment but still in a similar range. Given that TMS can exert transsynaptic effects in remote areas (see Ruff et al. 2006 for an example related to the visual system), indirect TMS effects in connected areas might contribute to the disruption of the overall neural activity pattern coding the stimulus properties. In particular, at the intensities needed to induce visual suppression, direct activation of pyramidal cells projecting to connected areas (similar to D-waves in motor cortex stimulation; di Lazzaro et al. 2004) might contribute to the suppression effect, in addition to the stimulation of interneurons. Importantly, however, our results provide no evidence that these putative transsynaptic effects are specifically focused on V1. Furthermore, the findings of different suppression curves for optimized V2d and V3 stimulation as well as of no suppression for V3A stimulation show that the behavioral effects clearly change with the cortical target of the direct TMS effects, even if indirect TMS effects occur in a network of neighboring and densely interconnected regions such as the early visual areas.
Our results demonstrate the benefit of combining neuronavigation, functional mapping using fMRI, and field calculations (or distance measurements based on structural MR images) to achieve a more clear-cut localization of the cortical target structures of TMS. This is particularly advantageous when several putative target areas exist in close neighborhood to each other that in addition exhibit a high intersubject variability in their sizes and positions, as demonstrated for early visual areas (Hasnain et al. 1998). In this case, coil placement based on structural magnetic resonance imaging (Pascual-Leone and Walsh 2001; Silvanto, Cowey, et al. 2005; Silvanto, Lavie, and Walsh 2005) or relative to the inion (Boyer et al. 2005) is not sufficient to draw precise conclusions on the cortical focus of TMS. Furthermore, even when the coil is optimally positioned above a certain cortical target, stimulation of the neighboring areas can still be stronger, depending on the distances between the areas and the skull surface. Electric field calculations or distance measurements can be used to control for this possibility. A straightforward interpretation of these results is hampered by the unknown TMS thresholds at the cortical level. Still, similar or higher field strength values in neighboring areas clearly imply that conclusions on the role of a specific area such as V1 have to be drawn with great caution. In that case, additional control experiments like a systematic mapping of the TMS effect can be helpful. Considering this, caution has to be exercised regarding the neural correlates of phosphene perception. For example, Silvanto, Cowey, et al. (2005) demonstrated that subthreshold stimulation of V5/MT+ changes the appearance of phosphenes induced by prior suprathreshold pulses applied over early visual areas, concluding that “V1 activity gates awareness of motion.” The coil position was optimized to induce phosphenes in the lower right visual field, which closely resembles the stimulus position used in our study. This position in the visual field is more likely targeted by V2d rather than V1d stimulation: When using the average coil position reported by Silvanto, Cowey, et al. (2005) and the data of our subjects to calculate the induced electric field, the average field strength in V2d exceeds that in V1d by 10%. Although the exact amount of overlap between the cortical target structures of TMS to induce suppression or phosphenes is unclear, a rough correspondence between the positions of induced scotomas and phosphenes in the visual field has been demonstrated (Kammer, Puls, Erb, and Grodd 2005). It therefore seems questionable if the effects reported by Silvanto et al. indeed stem from a predominant stimulation of V1d. Unfortunately, using our findings to draw strong conclusions on the neural correlates of phosphene perception is difficult, as the TMS effects on V1d and V2d might be state dependent and therefore different for phosphene induction and visual suppression, respectively. Using microstimulation in monkeys, Murphey and Maunsell (2007) demonstrated similar phosphene thresholds for several visual areas, again arguing against a specific functional role of a single area such as V1. Although the median of the thresholds for V2 was ∼25% higher than that in V1, the 2 threshold distributions were largely overlapping, with similar minimal and maximal values. Assuming that the monkey data can be directly applied to the human visual cortex, and considering that TMS targets more extended regions than microstimulation (thereby “averaging” across several neural populations with different thresholds), these findings suggest that the cortical phosphene thresholds in response to TMS might be rather similar for the 2 areas. Clearly, further studies are needed to confirm this hypothesis.
Our finding of a predominant stimulation of V2d might explain why an early suppression effect at ∼20 ms is observed only in some subjects (Corthout et al. 2002). The early time point hints toward the input from the lateral geniculate nucleus to V1 as being the TMS target. Therefore, early suppression could occur only in those subjects in which V1 is sufficiently close to the skull surface. Specific targeting of V1 (if possible at all) will need the selection of a subgroup of subjects and individually tailored coil and visual stimulus positions. Demonstration of a special role of V1d additionally necessitates showing differential effects on perception when stimulating V1d compared with neighboring visual areas. However, our results make a special role of a single early visual area unlikely. Also, the finding of suppression by V3 stimulation renders the possibility unlikely that TMS specifically disrupts feedback to V1 from higher areas that is mainly “relayed” via V2 (Felleman and van Essen 1991). Our results favor a view in which an intact activity pattern distributed across several early visual areas is necessary for the conscious perception of the visual stimulus.
Supplementary Material
Supplementary material can be found at: http://www.cercor.oxfordjournals.org/
Acknowledgments
We thank Dr Andreas Bartels (MPI Biological Cybernetics, Tübingen) for the help with the visual mapping. The helpful comments of the anonymous reviewers are appreciated. Conflict of Interest: None declared.
References
- Abdeen MA, Stuchly MA. Modeling of magnetic field stimulation of bent neurons. IEEE Trans Biomed Eng. 1994;41:1092–1095. doi: 10.1109/10.335848. [DOI] [PubMed] [Google Scholar]
- Amassian VE, Cracco RQ, Maccabee PJ, Cracco JB, Rudell A, Eberle L. Suppression of visual perception by magnetic coil stimulation of human occipital cortex. Electroencephalogr Clin Neurophysiol. 1989;74:458–462. doi: 10.1016/0168-5597(89)90036-1. [DOI] [PubMed] [Google Scholar]
- Amassian VE, Eberle L, Maccabee PJ, Cracco RQ. Modelling magnetic coil excitation of human cerebral cortex with a peripheral nerve immersed in a brain-shaped volume conductor: the significance of fiber bending in excitation. Electroencephalogr Clin Neurophysiol. 1992;85:291–301. doi: 10.1016/0168-5597(92)90105-k. [DOI] [PubMed] [Google Scholar]
- Amunts K, Malikovic A, Mohlberg H, Schormann T, Zilles K. Brodmann's areas 17 and 18 brought into stereotaxic space—where and how variable? Neuroimage. 2000;11:66–84. doi: 10.1006/nimg.1999.0516. [DOI] [PubMed] [Google Scholar]
- Beckers G, Zeki S. The consequences of inactivating areas V1 and V5 on visual motion perception. Brain. 1995;118:59–60. doi: 10.1093/brain/118.1.49. [DOI] [PubMed] [Google Scholar]
- Boyer J, Harrison S, Ro T. Unconscious processing of orientation and color without primary visual cortex. Proc Natl Acad Sci USA. 2005;102:16875–16879. doi: 10.1073/pnas.0505332102. [DOI] [PMC free article] [PubMed] [Google Scholar]
- Corthout E, Barker A, Cowey A. Transcranial magnetic stimulation: which part of the current waveform causes stimulation? Exp Brain Res. 2001;141:128–132. doi: 10.1007/s002210100860. [DOI] [PubMed] [Google Scholar]
- Corthout E, Hallett M, Cowey A. Early visual cortical processing suggested by transcranial magnetic stimulation. Neuroreport. 2002;13:1163–1166. doi: 10.1097/00001756-200207020-00018. [DOI] [PubMed] [Google Scholar]
- Cowey A, Walsh V. Magnetically induced phosphenes in sighted, blind and blindsighted observers. Neuroreport. 2000;11:3269–3273. doi: 10.1097/00001756-200009280-00044. [DOI] [PubMed] [Google Scholar]
- De Lucia M, Parker G, Embleton K, Newton J, Walsh V. Diffusion tensor MRI-based estimation of the influence of brain tissue anisotropy on the effects of transcranial magnetic stimulation. Neuroimage. 2007;36:1159–1170. doi: 10.1016/j.neuroimage.2007.03.062. [DOI] [PubMed] [Google Scholar]
- DeYoe EA, Carman GJ, Bandettini P, Glickman S, Wieser J, Cox R, Miller D, Neitz J. Mapping striate and extrastriate visual areas in human cerebral cortex. Proc Natl Acad Sci USA. 1996;93:2382–2386. doi: 10.1073/pnas.93.6.2382. [DOI] [PMC free article] [PubMed] [Google Scholar]
- di Lazzaro V, Oliviero A, Mazzone P, Insola A, Pilato F, Saturno E, Accurso A, Tonali PA, Rothwell JC. Comparison of descending volleys evoked by monophasic and biphasic magnetic stimulation of the motor cortex in conscious humans. Exp Brain Res. 2001;141:121–127. doi: 10.1007/s002210100863. [DOI] [PubMed] [Google Scholar]
- di Lazzaro V, Oliviero A, Pilato F, Saturno E, Dileone M, Mazzone P, Insola A, Tonali PA, Rothwell JC. The physiological basis of transcranial motor cortex stimulation in conscious humans. Clin Neurophysiol. 2004;115:255–266. doi: 10.1016/j.clinph.2003.10.009. [DOI] [PubMed] [Google Scholar]
- Eickhoff SB, Stephan KE, Mohlberg H, Grefkes C, Fink GR, Amunts K, Zilles K. A new SPM toolbox for combining probabilistic cytoarchitectonic maps and functional imaging data. Neuroimage. 2005;25:1325–1335. doi: 10.1016/j.neuroimage.2004.12.034. [DOI] [PubMed] [Google Scholar]
- Engel SA, Glover GH, Wandell BA. Retinotopic organization in human visual cortex and the spatial precision of functional MRI. Cereb Cortex. 1997;7:181–192. doi: 10.1093/cercor/7.2.181. [DOI] [PubMed] [Google Scholar]
- Felleman DJ, van Essen DC. Distributed hierarchical processing in the primate cerebral cortex. Cereb Cortex. 1991;1:1–47. doi: 10.1093/cercor/1.1.1-a. [DOI] [PubMed] [Google Scholar]
- Hadjikhani N, Liu AK, Dale AM, Cavanagh P, Tootell RB. Retinotopy and color sensitivity in human visual cortical area V8. Nat Neurosci. 1998;1:235–241. doi: 10.1038/681. [DOI] [PubMed] [Google Scholar]
- Hämäläinen M, Sarvas J. Realistic conductivity geometry model of the human head for interpretation of neuromagnetic data. IEEE Trans Biomed Eng. 1989;36:165–171. doi: 10.1109/10.16463. [DOI] [PubMed] [Google Scholar]
- Hasnain M, Fox P, Woldorff M. Intersubject variability of functional areas in the human visual cortex. Hum Brain Mapp. 1998;6:301–315. doi: 10.1002/(SICI)1097-0193(1998)6:4<301::AID-HBM8>3.0.CO;2-7. [DOI] [PMC free article] [PubMed] [Google Scholar]
- Haueisen J, Ramon C, Czapski P, Eiselt M. On the influence of volume currents and extended sources on neuromagnetic fields: a simulation study. Ann Biomed Eng. 1995;23:728–739. doi: 10.1007/BF02584472. [DOI] [PubMed] [Google Scholar]
- Hause L. A mathematical model for transmembrane potentials secondary to extracellular fields. In: Sances A Jr, Larson SJ, editors. Electroanaesthesia: biomedical and biophysical studies. New York: Academic Press; 1975. pp. 176–200. [Google Scholar]
- Hyodo A, Ueno S. Nerve excitation model for localized magnetic stimulation of finite neuronal structures. IEEE Trans Magn. 1996;32:5112–5114. [Google Scholar]
- Ilmoniemi RJ. Radial anisotropy added to a spherically symmetric conductor does not affect the external magnetic field due to internal sources. Europhys Lett. 1995;30:313–316. [Google Scholar]
- Ilmoniemi RJ, Ruohonen J, Karhu J. Transcranial magnetic stimulation—a new tool for functional imaging of the brain. Crit Rev Biomed Eng. 1999;27:241–284. [PubMed] [Google Scholar]
- Jolij J, Lamme V. Repression of unconscious information by conscious processing: evidence from affective blindsight induced by transcranial magnetic stimulation. Proc Natl Acad Sci USA. 2005;102:10747–10751. doi: 10.1073/pnas.0500834102. [DOI] [PMC free article] [PubMed] [Google Scholar]
- Kamitani Y, Shimojo S. Manifestation of scotomas created by transcranial magnetic stimulation of human visual cortex. Nat Neurosci. 1999;2:767–771. doi: 10.1038/11245. [DOI] [PubMed] [Google Scholar]
- Kammer T, Beck S, Thielscher A, Laubis-Herrmann U, Topka H. Motor thresholds in humans. A transcranial magnetic stimulation study comparing different pulse forms, current directions and stimulator types. Clin Neurophysiol. 2001;112:250–258. doi: 10.1016/s1388-2457(00)00513-7. [DOI] [PubMed] [Google Scholar]
- Kammer T, Puls K, Erb M, Grodd W. Transcranial magnetic stimulation in the visual system. II. Characterization of induced phosphenes and scotomas. Exp Brain Res. 2005;160:129–140. doi: 10.1007/s00221-004-1992-0. [DOI] [PubMed] [Google Scholar]
- Kammer T, Puls K, Strasburger H, Hill NJ, Wichmann FA. Transcranial magnetic stimulation in the visual system. I. The psychophysics of visual suppression. Exp Brain Res. 2005;160:118–128. doi: 10.1007/s00221-004-1991-1. [DOI] [PubMed] [Google Scholar]
- Kammer T, Vorwerg M, Herrnberger B. Anisotropy in the visual cortex investigated by neuronavigated transcranial magnetic stimulation. Neuroimage. 2007;36:313–321. doi: 10.1016/j.neuroimage.2007.03.001. [DOI] [PubMed] [Google Scholar]
- Kastner S, Demmer I, Ziemann U. Transient visual field defects induced by transcranial magnetic stimulation over human occipital pole. Exp Brain Res. 1998;118:19–26. doi: 10.1007/s002210050251. [DOI] [PubMed] [Google Scholar]
- Lontis ER, Nielsen K, Struijk JJ. In vitro magnetic stimulation of pig phrenic nerve with transverse and longitudinal induced electric fields: analysis of the stimulation site. IEEE Trans Biomed Eng. 2008 doi: 10.1109/TBME.2008.2009929. doi: 10.1109/TBME.2008.2009929. [DOI] [PubMed] [Google Scholar]
- Maccabee P, Nagarajan S, Amassian V, Durand D, Szabo A, Ahad A, Cracco R, Lai K, Eberle L. Influence of pulse sequence, polarity and amplitude on magnetic stimulation of human and porcine peripheral nerve. J Physiol. 1998;513(2):571–585. doi: 10.1111/j.1469-7793.1998.571bb.x. [DOI] [PMC free article] [PubMed] [Google Scholar]
- Maccabee PJ, Amassian VE, Eberle LP, Cracco RQ. Magnetic coil stimulation of straight and bent amphibian and mammalian peripheral nerve in vitro: locus of excitation. J Physiol. 1993;460:201–219. doi: 10.1113/jphysiol.1993.sp019467. [DOI] [PMC free article] [PubMed] [Google Scholar]
- McKeefry DJ, Burton MP, Vakrou C, Barrett BT, Morland AB. Induced deficits in speed perception by transcranial magnetic stimulation of human cortical areas V5/MT+ and V3A. J Neurosci. 2008;28:6848–6857. doi: 10.1523/JNEUROSCI.1287-08.2008. [DOI] [PMC free article] [PubMed] [Google Scholar]
- Murphey DK, Maunsell JHR. Behavioral detection of electrical microstimulation in different cortical visual areas. Curr Biol. 2007;17:862–867. doi: 10.1016/j.cub.2007.03.066. [DOI] [PMC free article] [PubMed] [Google Scholar]
- Nagarajan SS, Durand DM, Warman EN. Effects of induced electric fields on finite neuronal structures: a simulation study. IEEE Trans Biomed Eng. 1993;40:1175–1188. doi: 10.1109/10.245636. [DOI] [PubMed] [Google Scholar]
- Pascual-Leone A, Walsh V. Fast backprojections from the motion to the primary visual area necessary for visual awareness. Science. 2001;292:510–512. doi: 10.1126/science.1057099. [DOI] [PubMed] [Google Scholar]
- Ravazzani P, Ruohonen J, Grandori F, Tognola G. Magnetic stimulation of the nervous system: induced electric field in unbounded, semi-infinite, spherical and cylindrical media. Ann Biomed Eng. 1996;24:606–616. doi: 10.1007/BF02684229. [DOI] [PubMed] [Google Scholar]
- Roth BJ, Cohen LG, Hallett M, Friauf W, Basser PJ. A theoretical calculation of the electric field induced by magnetic stimulation of a peripheral nerve. Electroencephalogr Clin Neurophysiol. 1991;81:47–56. doi: 10.1016/0168-5597(91)90103-5. [DOI] [PubMed] [Google Scholar]
- Ruff CC, Blankenburg F, Bjoertomt O, Bestmann S, Freeman E, Haynes JD, Rees G, Josephs O, Deichmann R, Driver J. Concurrent TMS-fMRI and psychophysics reveal frontal influences on human retinotopic visual cortex. Curr Biol. 2006;16:1479–1488. doi: 10.1016/j.cub.2006.06.057. [DOI] [PubMed] [Google Scholar]
- Ruohonen J, Panizza M, Nilsson J, Ravazzani P, Grandori F, Tognola G. Transverse-field activation mechanism in magnetic stimulation of peripheral nerves. Electroencephalogr Clin Neurophysiol. 1996;101:167–174. doi: 10.1016/0924-980x(95)00237-f. [DOI] [PubMed] [Google Scholar]
- Sarvas J. Basic mathematical and electromagnetic concepts of the biomagnetic inverse problem. Phys Med Biol. 1987;32:11–22. doi: 10.1088/0031-9155/32/1/004. [DOI] [PubMed] [Google Scholar]
- Sereno MI, Dale AM, Reppas JB, Kwong KK, Belliveau JW, Brady TJ, Rosen BR, Tootell RBH. Borders of multiple visual areas in humans revealed by functional MRI. Science. 1995;268:889–893. doi: 10.1126/science.7754376. [DOI] [PubMed] [Google Scholar]
- Siebner HR, Rothwell JC. Transcranial magnetic stimulation: new insights into representational cortical plasticity. Exp Brain Res. 2003;148:1–16. doi: 10.1007/s00221-002-1234-2. [DOI] [PubMed] [Google Scholar]
- Silvanto J, Cowey A, Lavie N, Walsh V. Striate cortex (V1) activity gates awareness of motion. Nat Neurosci. 2005;8:143–144. doi: 10.1038/nn1379. [DOI] [PubMed] [Google Scholar]
- Silvanto J, Lavie N, Walsh V. Double dissociation of V1 and V5/MT activity in visual awareness. Cereb Cortex. 2005;15:1736–1741. doi: 10.1093/cercor/bhi050. [DOI] [PubMed] [Google Scholar]
- Silvanto J, Muggleton N, Lavie N, Walsh V. The perceptual and functional consequences of parietal top-down modulation on the visual cortex. Cereb Cortex. 2008 doi: 10.1093/cercor/bhn091. doi:10.1093/cercor/bhn091. [DOI] [PMC free article] [PubMed] [Google Scholar]
- Thielscher A, Kammer T. Linking physics with physiology in TMS: a sphere field model to determine the cortical stimulation site in TMS. Neuroimage. 2002;17:1117–1130. doi: 10.1006/nimg.2002.1282. [DOI] [PubMed] [Google Scholar]
- Tootell RBH, Mendola JD, Hadjikhani NK, Ledden PJ, Liu AK, Reppas JB, Sereno MI, Dale AM. Functional analysis of V3A and related areas in human visual cortex. J Neurosci. 1997;17:7060–7078. doi: 10.1523/JNEUROSCI.17-18-07060.1997. [DOI] [PMC free article] [PubMed] [Google Scholar]
- Tranchina D, Nicholson C. A model for the polarisation of neurons by extrinsically applied electric fields. Biophys J. 1986;50:1139–1156. doi: 10.1016/S0006-3495(86)83558-5. [DOI] [PMC free article] [PubMed] [Google Scholar]
- Wagner T, Eden U, Fregni F, Valero-Cabre A, Ramos-Estebanez C, Pronio-Stelluto V, Grodzinsky AJ, Zahn M, Pascual-Leone A. Transcranial magnetic stimulation and brain atrophy: a computer-based human brain model study. Exp Brain Res. 2008;186:539–550. doi: 10.1007/s00221-007-1258-8. [DOI] [PMC free article] [PubMed] [Google Scholar]
- Wagner T, Zahn M, Grodzinsky AJ, Pascual-Leone A. Three-dimensional head model simulation of transcranial magnetic stimulation. IEEE Trans Biomed Eng. 2004;51:1586–1598. doi: 10.1109/TBME.2004.827925. [DOI] [PubMed] [Google Scholar]
- Wichmann F, Hill N. The psychometric function: I. Fitting, sampling and goodness-of-fit. Percept Psychophys. 2001;63:1293–1313. doi: 10.3758/bf03194544. [DOI] [PubMed] [Google Scholar]
- Wichmann F, Hill N. The psychometric function: II. Bootstrap-based confidence intervals and sampling. Percept Psychophys. 2001;63:1314–1329. doi: 10.3758/bf03194545. [DOI] [PubMed] [Google Scholar]
Associated Data
This section collects any data citations, data availability statements, or supplementary materials included in this article.