Abstract
A significant increase in biomedical applications of nanomaterials and their potential toxicity demand versatile analytical techniques to determine protein – nanoparticle (NP) interactions. These diverse analytical techniques are reviewed. Spectroscopic methods play a significant role in studying binding affinity, binding ratio, and binding mechanisms. To elucidate NP-proteome interactions, chromatography and electrophoresis techniques are applied to separate NP-bound proteins and Matrix assisted laser desorption ionization time-of-flight mass spectrometry (MALDI-TOF-MS) to identify these proteins. Since NP-protein binding is a dynamic event, Surface Plasmon Resonance (SPR) and Quartz Crystal Microbalance (QCM) are methods of choice to study kinetics of NP-protein binding.
1. Introduction
Due to the unique properties at the nanoscale, nanoparticles (NPs) are being developed as drug carriers1, 2, imaging agents for cancer3–5, as well as analytical probes6, 7. With more and more applications of nanotechnology and the release of nanomaterials into environment, there are also increasing societal concerns about nanosafety8, 9. For a large part, both positive and negative sides of nanoparticles are related to their dramatic biological membrane permeability and their strong interactions with biomacromolecules, such as proteins. Investigations on protein/nanoparticle interactions play a key role in both determination of NP’s biocompatibility for various biomedical applications and for nanosafety evaluation. For example, when NPs enter a human blood or cells, they strongly interact with proteins that may transmit biological signals due to altered protein conformation and the exposure of novel epitopes10. The perturbed signaling transduction in cells may have adverse effects on cellular function and cause toxicity in vitro and in vivo.
Therefore, analytical methods and strategies are essential to investigate NP-protein interactions in order to understand mechanistic basis for NP’s biological activity and to make the safe use of nanotechnology. Herein, we summarize recent progresses on the development of analytical strategies to investigate NP-protein interactions. We focus on the functional role of each method and its advantages and limitations (Table 1).
Table 1.
Overview of analytical strategies to monitor NP- protein interactions
| Functional purpose | Analysis strategy | Advantage | Limitation | Reference |
|---|---|---|---|---|
| Binding affinity and ratio |
UV-vis | Faster, more flexible, less complicated | Absorption spectrum show different characters for varied NPs | 11–23 |
| Fluorescence spectroscopy | Quantitative, sensitive | NPs or proteins should have intrinsic or labeled fluorescence | 16, 20, 24–37 | |
| Dynamic light scattering | Size distribution of NPs | Not suitable to non-spherical nanoparticles | 13, 22, 35, 38–41 | |
| Atomic force microscopy | 3-D surface profile | Limited scanning area | 23, 42–44 | |
| Conformational changes of NP-bound proteins |
Circular dichroism | Secondary structures of proteins in the absence or presence of NPs |
No the residue-specific information | 17, 18, 31, 34, 35, 45–54 |
| Fourier transform infrared spectroscopy |
NP-bound protein amide bands | Objects have to be dried down | 15, 35, 55–57 | |
| Raman spectroscopy | NP-bound protein amide bands in aqueous solution | Fluorescence and raleigh scattering noise | 48 | |
| X-ray crystallography | 3-D structure of nanoparticle-protein complex | Objects have to be crystallized | 58 | |
| Nuclear magnetic resonance | NP-bound protein binding site mapping | Line broadening in spectrum when proteins bind to NPs | 17, 59 | |
| Isolation and separation of NP-bound proteins |
Chromatography | Quantitative | Limited application range | 11, 17, 24, 27, 38, 60, 61 |
| Capillary electrophoresis | Quantitative, no need of desorption procedure | Limited detection sensitivity | 62, 63 | |
| 1-D electrophoresis | Simper, faster | Less effectively separation | 11, 29, 38, 53, 57, 60, 64–68 | |
| 2-D electrophoresis | Higher ability of separating proteins | More complex, less repeat ability | 47, 62, 63, 69–71 | |
| Identification of NP-bound proteins |
Mass spectroscopy | Efficient, low quantity of protein samples | Less quantitative | 24, 46, 60, 63–65, 72, 73 |
| N-terminal microsequencing | Obtaining directly amino acids sequences of proteins | Less quantitative, restrictiveness of N-terminal amino acid | 74–79 | |
| Kinetics | Quartz crystal microbalance | Real-time, label-free, sensitive, quantitative; | Immobilization of one party on the chip | 80, 81 |
| Surface plasmon resonance | Real-time, label-free, sensitive and quantitative | Immobilization of one party on the chip | 10, 21, 82 | |
NP-protein interactions can be classified into two categories: interaction with single proteins or with proteome. For the former, the bound protein is known. Studies mainly focus on the determinations of binding affinity, the binding ratio, binding-induced protein conformational changes, and mechanism of interactions. For the latter, proteome contains hundreds of proteins. These studies aim at separating and identifying NP-bound proteins. Furthermore, studies of NP-protein binding kinetics require special approaches and are discussed separately. In the following sections, various analytical methods and strategies are briefly reviewed and representative methods are discussed in more detail.
2. NP-single protein interactions
2.1 Monitoring binding affinity and binding ratio
The fundamental characterization of NP-protein complex is to determine its binding affinity and binding ratio. Binding of proteins onto NPs are accompanied by electron or energy transfer, spectroscopic change, size or shape alterations, or other changes on both parties. Therefore, NP-protein binding can be analyzed by monitoring these alterations.
2.1.1 UV-vis spectroscopy
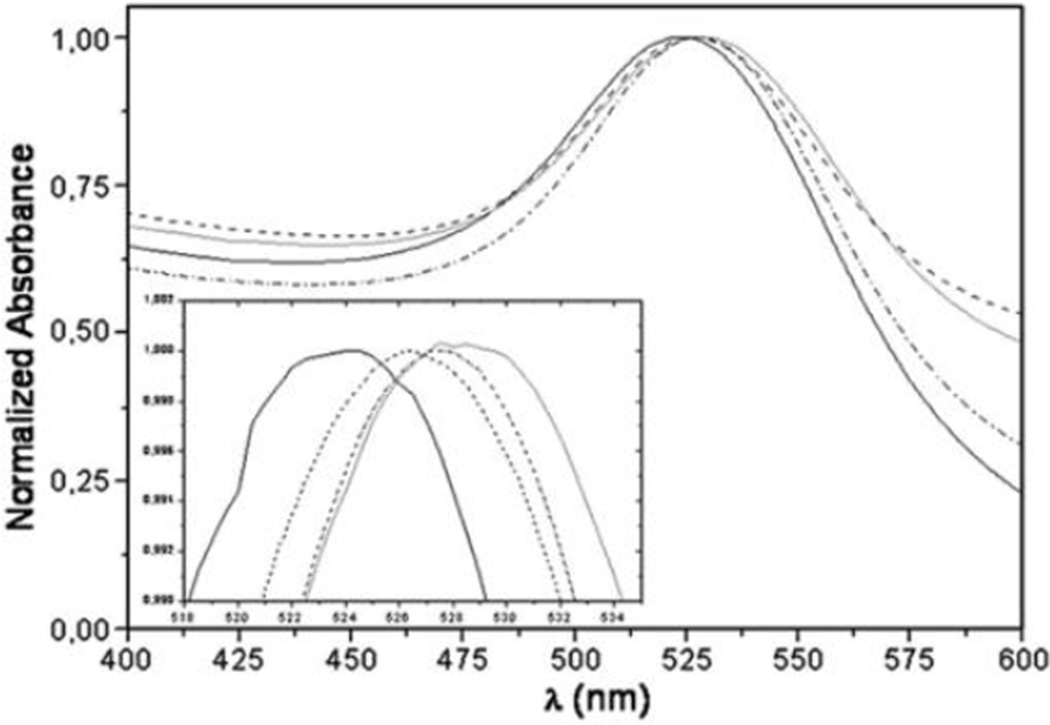
Protein binding to NPs results in changes in absorption spectra of NPs, and these changes can be used to evaluate the binding11–23. The shift and broadening of the absorption spectra of NP-protein complex depend on NPs size, aggregation, and local dielectric environments13, 16. For example13, it was shown that the red shift and widening of the peak in the absorption spectra of azurin (Az) – gold NP (GNP) solution depended on Az concentration (Fig. 1).
Fig. 1.
Normalized absorption spectra of Az-AuNP solutions at [AuNP]=1.02 nM and various Az concentrations: 0 µM (continuous black line), 0.7 µM (dotted black line), 2.8 µM (dashed black line), 11 µM (continuous gray line). Inset: Zoom of the wavelength region of plasmon resonance band peaks. Reprinted from Biophysical Chemistry, 2009, 139, 1–7, I. Delfino and S. Cannistraro, Optical investigation of the electron transfer protein azurin-gold nanoparticle system, Copyright (2009), with permission from Elsevier.
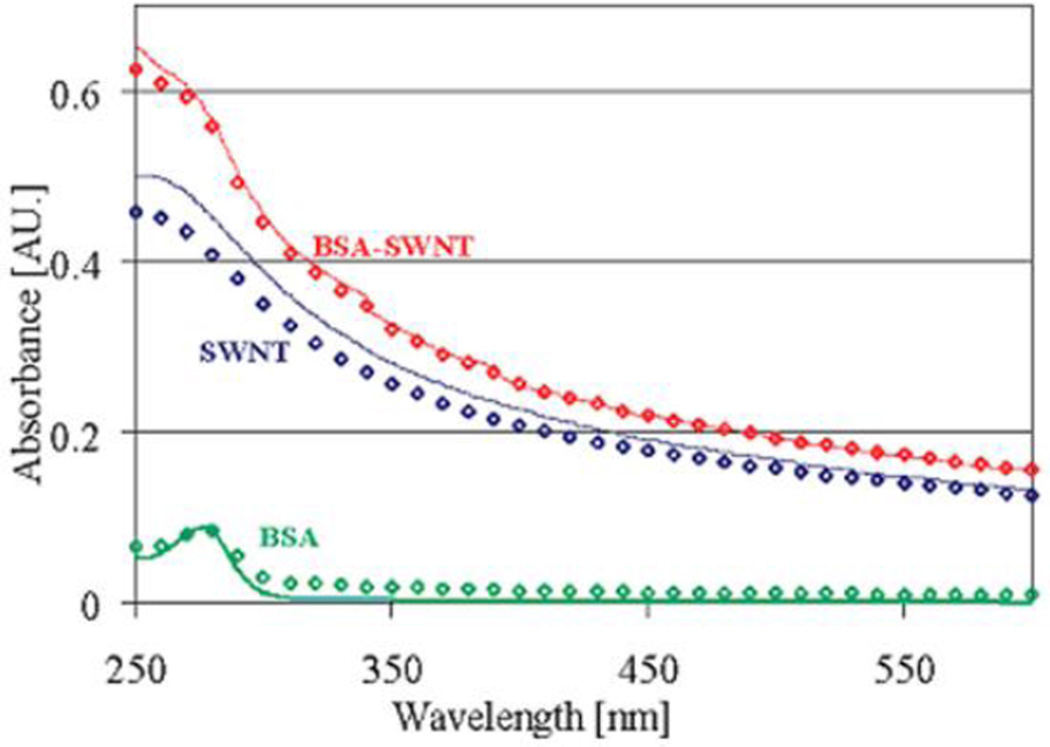
However, for some NPs, such as carbon nanotubes, the shift and broadening of the plasmon band of the complex are not regular12, 14, 18, 23. A study of single-walled carbon nanotubes (SWCNT) - BSA binding showed that the absorption spectrum of the complex was identical to the overlap of spectra of SWCNT and BSA 14. So Lambert-Beer’s law can be used to calculate the concentration of one constituent using the equation (1), when another constituent’s concentration is known.
| (1) |
Where A is the absorbance; C is the concentration; ε is the extinction coefficient and l is the length traveled by light through the specimen; λ is the wavelength.
Calculated spectra (continuous curves) were compared with measured spectra (diamonds) from single constituent samples and mixed SWCNT-BSA sample (Fig. 2). Results showed that the calculated spectra fit well with the measured spectra.
Fig. 2.
Calculated and measured spectra. Calculated (continuous curves) and measured spectra (diamonds) of BSA (green) and SWNT (blue) alone, and BSA SWNT (red). The BSA and SWNT concentrations in both measured (diamonds) and calculated spectra are 0.08 and 0.0219 mg/mL, respectively. Reprinted with permission from E. Edri and O. Regev, pH effects on BSA-dispersed carbon nanotubes studied by spectroscopy-enhanced composition evaluation techniques. Analytical Chemistry, 2008, 80, 4049–4054. Copyright 2008, American Chemical Society.
As shown above, the UV-vis spectroscopy can be used to analyze NP-protein bindings. Comparing with other methods, UV-vis is faster, more flexible and less complicated. But absorption spectra may show different characters for different NPs. Therefore, it is necessary to select another analytic method if using UV-vis alone does not give conclusive results.
2.1.2 Fluorescence spectroscopy
Proteins are polymeric complex of amino acids and contain fluorophores, such as Tyrosine, Tryptophan and Phenylalanine. Fluorescence spectroscopy is sensitive to protein dynamics because the excited fluorescent state persists for nanoseconds, which is exactly the time scale of many important biological processes such as the rotational motion of protein side chains, molecular binding, and protein conformational changes16, 20, 24–27, 29–37. When NPs are intrinsically luminescent or labeled with fluorescence probes36, fluorescence emission can also be detected from NPs. NP-protein binding can be monitored by steady-state or time-resolved fluorescence spectroscopy16, 20, 25, 29–34, 37, fluorescence resonance energy transfer (FRET)35, 83, 84 or stepwise single-molecule photobleaching85.
Steady-state and time-resolved fluorescence spectroscopy
NP-protein interaction alters the local chemical environment of fluorophores and quenches the fluorescence of proteins. Therefore, the decrease of fluorescence intensity and shift of emission peak maximum indicate interactions between NPs and proteins. If the fluorescence quenching is induced by collision effect, the lifetime of fluorophore will also decrease16, 20, 25, 29–34, 37. The relationship of fluorescence intensity or lifetime with quencher concentration follows the Stern-Volmer equation (2):
| (2) |
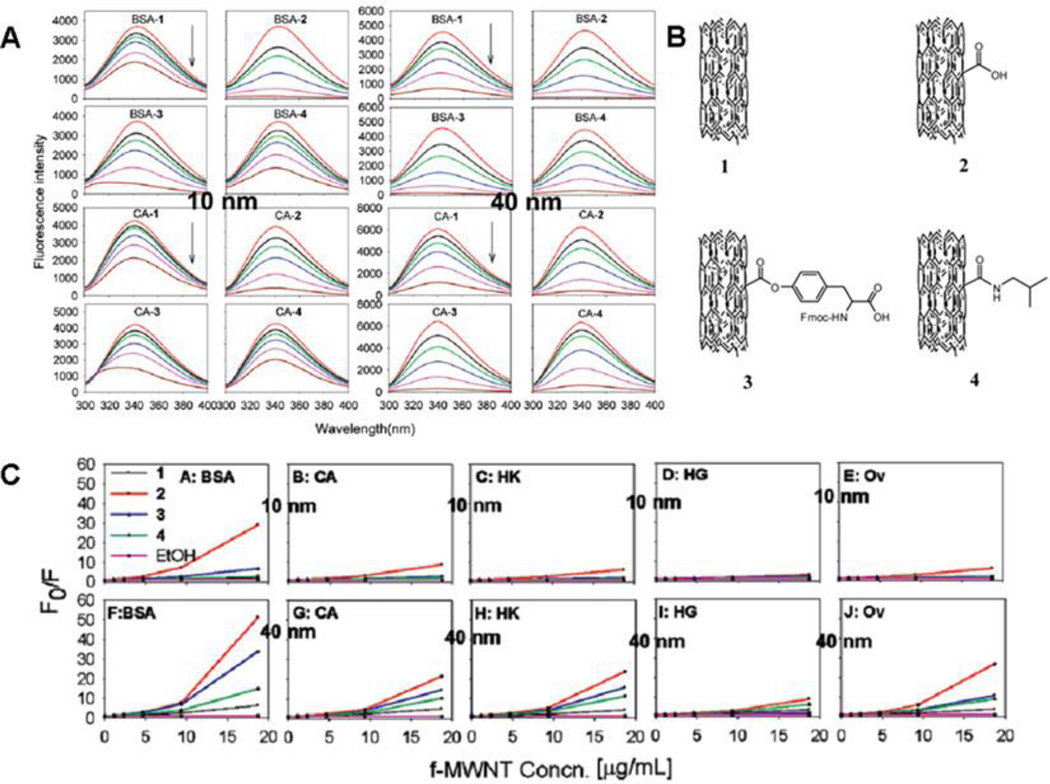
where F0, F, τ0 and τ represent initial or modified fluorescence intensity or lifetime, respectively. Ksv is the Stern-Volmer constant and [Q] is the quencher concentration16, 20, 31, 35, 37. In the experiments of proteins - functionalized multiwalled carbon nanotubes (f-MWCNTs) interactions31, the equation was used to show that the binding affinity is dependent on nanotube diameter, surface chemistry and protein type (Fig. 3). The consistent fluorescence lifetime of proteins after binding to f-MWCNTs suggested that the quenching was static and a complex was formed. According to changes of the protein fluorescence intensity, it was indicated that the f-MWCNTs with a 40 nm diameter exhibited stronger protein binding than those with a smaller diameter (10 nm), and the MWCNT with carboxyl modification showed stronger protein binding than other f-MWCNTs.
Fig. 3.
Fluorescence spectra of BSA and CA before and after f-MWCNTs 1–4 titration. A. Final concentrations of f-MWCNT in protein solutions from top to bottom is 0, 1.1, 2.3, 4.6, 9.3, and 18.7 µg/mL, respectively; B. Chemical structures of MWCNT 1–4 (10 or 40 nm); C. Pseudo Stern-Volmer plots of fluorescence quenching for proteins with f-MWCNTs 1–4.(A–E) MWCNTs with a diameter of 10 nm; (F–J) MWCNTs with a diameter of 40 nm. Reprinted with permission from Q. X. Mu; W. Liu; Y. H. Xing; H. Y. Zhou; Z. W. Li; Y. Zhang; L. H. Ji; F. Wang; Z. K. Si; B. Zhang and B. Yan, Protein binding by functionalized multiwalled carbon nanotubes is governed by the surface chemistry of both parties and the nanotube diameter. Journal of Physical Chemistry C, 2008, 112, 3300–3307. Copyright 2008, American Chemical Society.
Besides binding affinity, fluorescence spectroscopy can also be used to measure the number of binding sites, binding constant and the degree of cooperativity of particle-protein binding (Hill constant)16, 28, 30, 32, 34. It will be detailed later when NP-protein binding mechanism is discussed in section 2.3.2.
Fluorescence resonance energy transfer (FRET)
FRET, also known as Förster resonance energy transfer, occurs when a donor fluorophore in NP-protein complex transfers energy in its electronic excited state to an acceptor fluorophore35, 83, 84. There are three requirements for FRET to occur: first, both parties are fluorescent; second, one can be excited at the binding partner’s emission region; third, the donor- acceptor distance is in 1- 10 nm range86.
FRET can be used to study luminescent NPs (e.g. quantum dots or lanthanide- ion-doped oxide NPs) - protein interactions because these particles have high quantum yield, broad excitation spectrum and narrow/symmetric emission spectrum87. CdSe/ZnS quantum dots - metalloprotein azurin interactions were studied through FRET. It was observed that the photoluminescence (PL) intensity increased when the protein-NP ratio increased83.
However, because of special FRET requirements, it is not suitable for most nanomaterials and its application for analyzing NP-protein binding is limited.
Stepwise photobleaching
Stepwise photobleaching is an advanced approach to determine biomacromolecule interactions, such as membrane protein stoichiometry88. In this approach, NPs should be intrinsically fluorescent. It is also suitable for QDs or lanthanide-ion-doped oxide NPs. The protein-NP ratio can be quantified by counting the steps of NP’s photobleaching. A distribution of photobleaching steps is quantified and the average number of proteins per NP can be obtained.
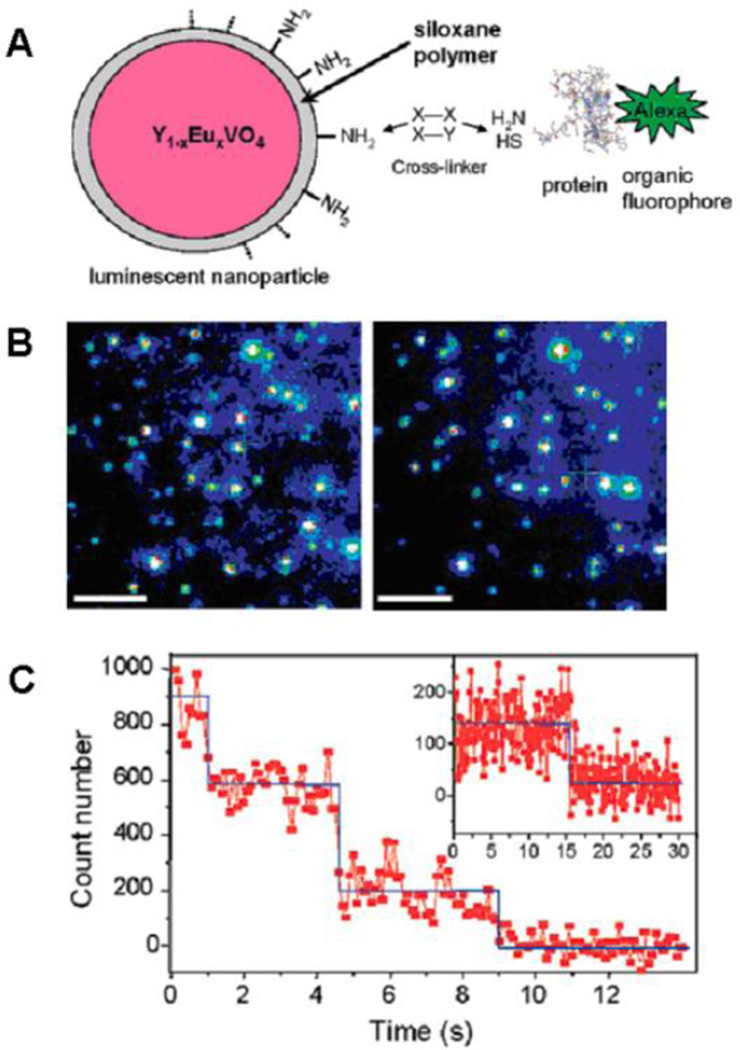
For instance, the stepwise photobleaching of Alexa488 labeled protein attached to individual NPs (lanthanide-ion doped oxide NPs) was used to quantify the NP - protein (α-bungarotoxin) ratio for each NP as well as its distribution85. As shown in Fig. 4B, the fluorescence evolution of Alexa bright spots correspond to protein-Alexa molecules attached to single NPs. Then the number of proteins per NP was measured by simply counting the number of bleaching steps (Fig. 4C).
Fig. 4.
A. Schematics of NP-α-bungarotoxin-Alexa488 system; B. Wide-field fluorescence microscopy images of individual NP-α-bungarotoxin-Alexa488 conjugates spincoated on a coverslip: (left) image of the NP emission at 617 nm; (right) image of the Alexa488 emission centered at 519 nm. Scale bar =5µm; C. Time evolution of a single Alexa emission spot showing three (main figure) and one (inset) photobleaching steps. Blue lines help visualize the steps. Reprinted with permission from D. Casanova; D. Giaume; M. Moreau; J. L. Martin; T. Gacoin; J. P. Boilot and A. Alexandrou, Counting the number of proteins coupled to single nanoparticles. Journal of the American Chemical Society, 2007, 129, 12592-+. Copyright 2007, American Chemical Society.
Stepwise photobleaching can also be used to determine the protein-NP stoichiometry at the single particle level, which is a unique function compared with other approaches. However, a limitation of stepwise photobleaching is that both parties need to be fluorescent.
2.1.3 Dynamic light scattering (DLS)
DLS determines small changes in the hydrodynamic size of particles and is used to detect size distribution of NPs. When proteins bind to NPs surface, the size of NPs increases and this increase will stop when the binding is saturated. Therefore it can be used to monitor the binding ratio13, 22, 35, 38–41. For example, the molar ratio of cytochrome P450 - QD (CdSe and CdS) was determined to be 5–6 by using DLS40. No significant changes in the scattering intensity was observed above the molar ratio of 5–6 indicating that there is no further adsorption of proteins on QDs.
Nonetheless, the hydrodynamic diameters are also influenced by the formation of hydration shells, the shape of the particles, and the counterion binding40. So interferences of multiple factors must be considered when interpreting DLS data.
2.2 Monitoring conformational changes of NP-bound proteins
The interaction of a protein with NP may induce protein conformational changes. The conformation changes in proteins may expose unknown epitopes and subsequently activate undesired signaling pathways. Therefore, it is crucial to monitor protein conformation when NPs interact with proteins. In addition, monitoring conformational changes may also play an important role in the studies of NPs-mediated refolding of denatured proteins89. Analytical methods usually used are circular dichroism (CD), Fourier transform infrared (FTIR) spectroscopy, Raman spectroscopy and fluorescence anisotropy (FA).
2.2.1 Circular dichroism (CD)
Different protein secondary structures (α-helix, β-sheet, etc.) have their own characteristic CD spectrum in the UV region. This method has been widely used for monitoring conformational changes induced by protein-NP interactions11, 15, 17, 18, 25, 27, 31, 34, 35, 45–54. NPs are usually not chiral in nature and thus don’t affect protein CD spectra.
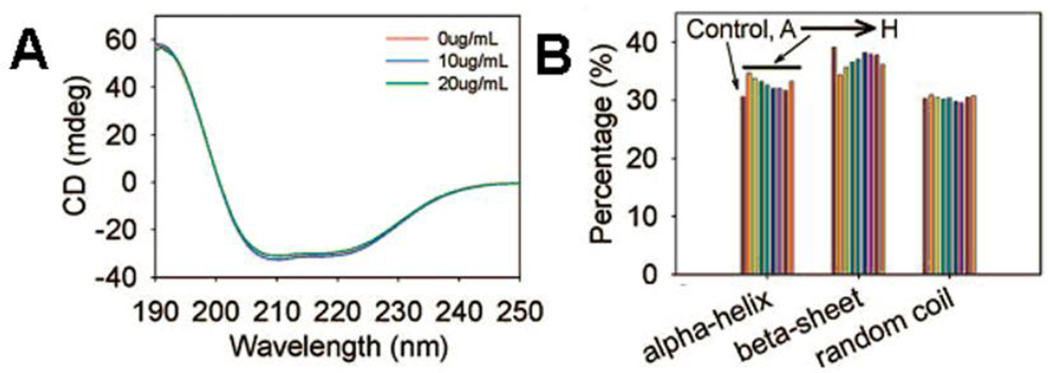
CD spectra of BSA in the absence or presence of various Magnetic nanoparticles (MNPs) are shown in Fig. 5. The protein secondary structures in the absence or presence of MNPs were in the same range as normal BSA protein indicating that conformation of BSA was not changed upon binding to MNPs. As a result, few protein epitope was exposed in MNP-bound proteins46.
Fig. 5.
CD spectra of BSA with MNPs titration. BSA was dissolved in dionized water at 20 µg/mL. MNPs stock solution was added to BSA solution to form final concentrations of 10 and 20 µg/mL, respectively. A. CD spectra of BSA before and after MNPs A titration; B. BSA secondary structure calculation before and after 20 µg/mL MNPs addition using Yang formula. The nanoparticles A-D are 50nm, dextran-COOH, dextran-NH2, dextran-PEG-COOH, dextran-PEG- NH2; E-F are the same order as A-D, but the size of 200nm. Reprinted with permission from Q. Mu; Z. Li; X. Li; S. R. Mishra; B. Zhang; Z. Si; L. Yang; W. Jiang and B. Yan, Characterization of Protein Clusters of Diverse Magnetic Nanoparticles and Their Dynamic Interactions with Human Cells. J. Phys. Chem. C, 2009, 113, 5390–5395. Copyright 2009, American Chemical Society.
CD is used widely to assess the conformational changes of proteins. However, it does not give residue-specific information. Another concern is that the highly absorption energy at far-UV region (<200 nm) may increase noise and reduce the accuracy. Thus the calculation of secondary structure percentage is usually based on the data acquired at higher wavelength (> 200 nm)90, 91.
2.2.2 Fourier Transform Infrared Spectroscopy (FTIR) and Raman Spectroscopy
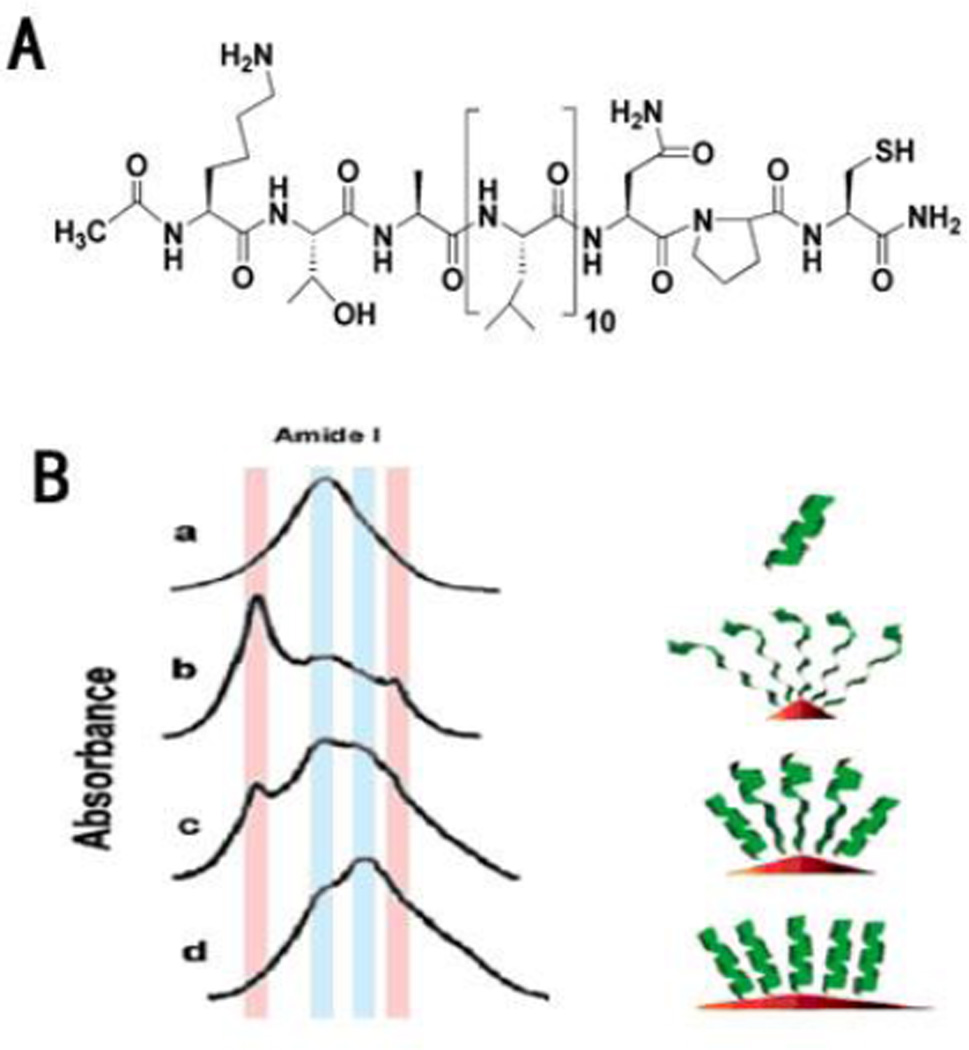
FTIR and Raman spectroscopy have been used to monitor structures of NP-bound proteins. For FTIR15, 35, 55–57, the protein secondary structures are estimated based on the absorption of amide bonds. Among amide I, II and III bands, the amide I vibrational band (1700–1600 cm−1) is most sensitive and frequently used to determine protein conformation. For example, FTIR spectroscopy was used to probe the structure of the Leu-rich peptide Ac10L (Fig. 6A) absorbed on different gold nanoparticles (GNPs). As shown in Fig. 6B, the size of GNPs (the degree of surface curvature of GNPs) has a profound effect on the secondary structure of the peptide56.
Fig. 6.
A. Molecular structure of the peptide Ac10L. B. FT-IR spectra (KBr) of Ac10L: free state (a); on 5, 10, and 20nm Au-NPCs (b, c, and d, respectively). The light blue and pink shades show regions where absorptions due to R- and â-sheet conformations occur, respectively. Reprinted with permission from H. S. Mandal and H. B. Kraatz, Effect of the surface curvature on the secondary structure of peptides adsorbed on nanoparticles. Journal of the American Chemical Society, 2007, 129, 6356. Copyright 2007, American Chemical Society.
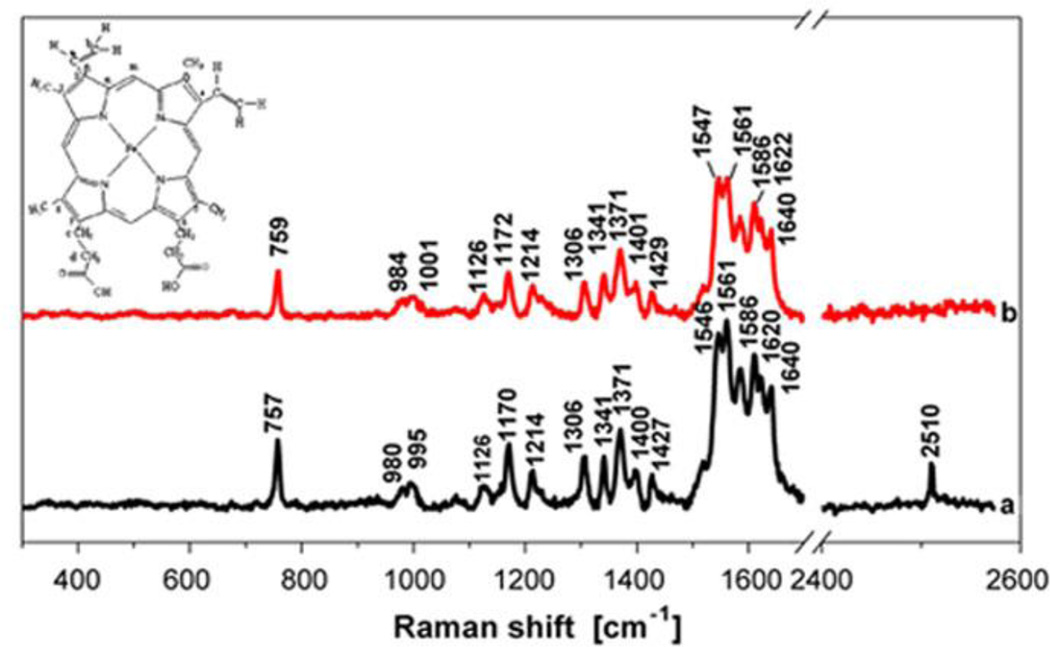
The Raman spectrum of proteins consists of the bands associated with peptide main chain, aromatic side chains and sulfur-containing side chains48, 92. For instance, the interaction between human hemoglobin (Hb) and bare CdS quantum dots (QDs) was investigated by Raman spectroscopic. As shown in Fig. 7, the spin state of the heme iron of Hb did not change by binding to the surface of CdS QDs, but the binding of QDs induced the orientational change of heme vinyl groups, from in-plane or close to in-plane to out-of-plane48.
Fig. 7.
Raman spectrum of Hb in absence (a) and presence (b) of CdS QDs; the inset is the molecular structure and labeling scheme of iron protoporphyrin. The concentration of Hb was 1.0 ×10⁻⁴ M, and the concentration of CdS QDs was 2.26×10⁻⁷ M. Reprinted from Journal of Colloid and Interface Science, 2007, 311, 400–406, X. C. Shen, X. Y. Liou, L. P. Ye, H. Liang and Z. Y. Wang, Spectroscopic studies on the interaction between human hemoglobin and US quantum dots, Copyright (2007), with permission from Elsevier.
Despite Raman scattering spectrum provides the same type of information as FTIR, the two methods differ fundamentally in mechanism. Therefore they have selection rules and specific advantages and disadvantages for biological applications respectively. FTIR is simpler than Raman on both instrumentation and data collection. Additionally, FITR intensity can be quantified by Beer’s Law. However, there are two main advantages of Raman over FTIR for studying NP-protein interactions. One is its ability to measure protein-NP complex in aqueous solutions and the other is the greater spectral simplicity in Raman spectra than IR because the localized vibrations of double or triple bond or electron-rich groups generally produce more intense Raman bands than do vibrations of single bond or electron-poor groups92.
These spectroscopic methods are not only used to detect conformational changes, they also confirm the protein attachment onto NPs through the appearance of additional characteristic bands.
2.2.3 Fluorescence anisotropy (FA)
The formation NP-protein complex influences the rotational freedom of the tryptophan residues, which is reflected by changes in fluorescence anisotropy26, 27, 86. Changes in tryptophan anisotropy can be caused either by a decrease of tumbling due to formation of higher mass complexes93 or enhanced rotational freedom due to protein denaturation and exposure of the tryptophan residues to solution94–96. Therefore, the tryptophan fluorescence can be monitored to analyze the change in global protein conformation. Fluorescence anisotropy (rs) is defined as (3)86:
| (3) |
where IVV is the intensity of light observed using two vertical polarizeres, IVH is the signal observed when the excitation path is through a vertical polarizer and emission detected with a horizontal polarizer, and G is a correction factor determined as the ratio of the vertical and horizontal components of light due to horizontal polarization of the light source.
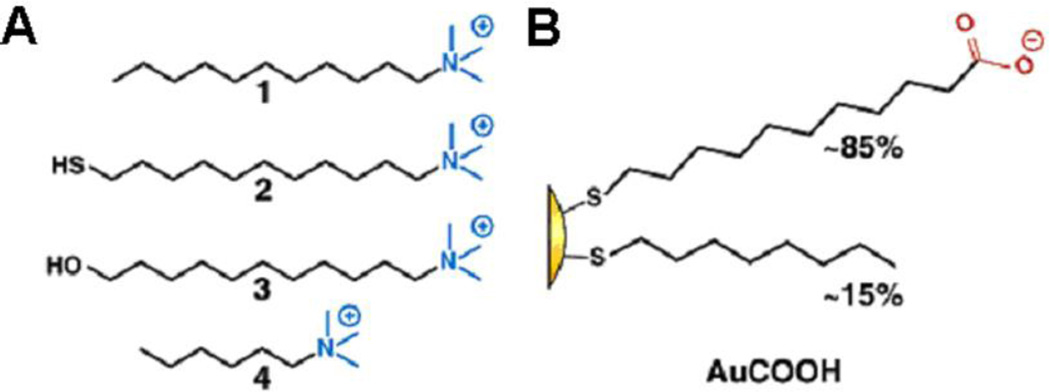
For instance, surfactant addition produced a certain degree of α-chymotrypsin (ChT) renaturation after incubation with GNPs. The addition of surfactants 1–3 (Table 2) results in a significant shift in the anisotropy toward native values demonstrating renaturation26.
Table 2.
Fluorescence Anisotropy of ChT
| anisotropy (r) | ||
|---|---|---|
| sample | −AuCOOHa | +AuCOOHb |
| ChT | 0.100 ± 0.006 | 0.036 ± 0.007 |
| ChT-1 | 0.096 ± 0.003 | 0.065 ± 0.020 |
| ChT-2 | 0.091 ± 0.003 | 0.078 ± 0.006 |
| ChT-3 | 0.100 ± 0.004 | 0.076 ± 0.029 |
| ChT-4 | 0.089 ± 0.009 | 0.030 ± 0.001 |
| ChT(denatured) | 0.059 ± 0.001 | |
Samples of ChT alone.
Samples of ChT preincubated with AuCOOH. Structures of surfactants 1, 2, 3, 4 and AuCOOH are shown in Fig. 8. Reprinted with permission from N. O. Fischer; A. Verma; C. M. Goodman; J. M. Simard and V. M. Rotello, Reversible “Irreversible” Inhibition of Chymotrypsin Using Nanoparticle Receptors. Journal of the American Chemical Society, 2003, 125, 13387–13391. Copyright 2003, American Chemical Society.
It is noted that FA allows the detection of interacting macromolecules in a homogenous solution and avoids protein separation. Since FA monitors molecular rotations of macromolecules, it’s better suited for spherical NPs.
CD, FTIR, Raman and FA provide information on protein secondary structure and the global information of NPs bound proteins. Besides these methods, nuclear magnetic resonance (NMR) should be able to provide data from all coupled H and N atoms in a protein17, 59. X-ray crystallography is also a preferred method to evaluate protein 3-D structure and protein-NP binding58. Investigations of NP-protein interactions using these two powerful structural biological methods started to appear, but are still to be further explored.
2.3 Mechanism of NP-protein interaction
Although there are no direct and efficient analytical methods to determine the mechanism of NP-protein interactions, methods are available to get mechanism- related information such as binding site, interaction force, and binding constant. These methods include isothermal titration calorimetry (ITC), fluorescence spectroscopy, X-ray crystallography58, and again FRET35.
2.3.1 Isothermal titration calorimetry (ITC)
ITC can be used to directly measure the binding affinity constant (Ka), enthalpy changes (ΔH), and binding stoichiometry (n) between NPs and proteins in solution35, 82, 97–99. Based on measurement of small changes of temperature, Gibbs energy changes (ΔG) and entropy changes (ΔS) can be calculated using the relationship (4):
| (4) |
Where R is the gas constant and T is the absolute temperature. To quantify protein binding as a function of NP’s characteristics, proteins are usually titrated into NP solution and heat response is recorded. The heat changes are then fitted to the isothermal function and thermodynamic parameters obtained. In a study of QD - human serum albumin (HSA) interaction, thermodynamic parameters of the system were calculated at different temperatures. Results indicated that the electrostatic interactions played a major role in the binding reaction because negative enthalpy (ΔH) and positive entropy (ΔS) values were obtained 35.
In another example, the complexation of GNPs with CytC (cytochrome c) featured two distinct binding processes with different affinity through analyzing the binding affinity (Ka) and binding stoichiometry (n)97. These examples illustrate that thermodynamic parameters, binding constant and stoichiometry measured by ITC can be used to elucidate the mechanism.
2.3.2 Fluorescence spectroscopy
Fluorescence spectroscopy has been used to analyze binding affinity and binding ratio of NP-protein complex as discussed in section 2.1.2. Furtuermore, the number of binding sites (n) and binding constant (Ka) can be calculated using the following equation (5) 30, 34:
| (5) |
where F is fluorescence intensity, F0 and F∞ are the relative fluorescence intensities of the protein alone and the protein saturated with the NPs, respectively. Kdiss is the dissociation constant, equaling with the binding constant (Ka).
In a recent study, the degree of cooperativity of GNP-protein binding (Hill constant) was calculated by measuring fluorescence quenching28. The Hill constant n is a frequently used parameter to describe binding cooperativity. For HSA, fibrinogen, histone, and globulin proteins, anticooperative binding (n<1) was observed, indicating that within the frame of the Hill model the association energy per particle progressively decreases with further protein adsorption. Whereas, for insulin, n>1 was observed, indicating cooperative binding. To calculate Hill constant, equation (6) and equation (7) were used: 100
| (6) |
| (7) |
where I0 and I are fluorescence intensities in the absence and presence of gold NPs, respectively; Qmax is the saturation value of Q, n the Hill constant, kD the protein-NP equilibrium constant, equaling with the reciprocal of binding constant (Ka).
After all, the elucidation NP-protein interaction mechanism is difficult and there is not enough investigation so far. Therefore, it is important and necessary to carry out further research in this area and develop more appropriate analytical methods.
3. NP-proteome interactions
3.1 Isolation and separation of NP-bound proteins
Proteomes, such as plasma proteins or cellular proteins, contain hundreds of proteins. Binding of NPs with plasma proteins or cellular proteins may influence biological activities of many proteins. Therefore, for NP-proteome interaction research, the most challenging issue is to accurately quantify and identify proteins attached to NPs. Separation of proteins is a prerequisite to analyzing identity of numerous proteins. The mostly applied approaches for protein separation are chromatography and electrophoresis.
3.1.1. High Performance Liquid Chromatography (HPLC)
Size Exclusion Chromatography (SEC)
SEC, also known as gel filtration chromatography, separates particles or protein-NP complexes on the basis of size. Silica-based columns with large pore volume have been used17, 24, 27, 60. Separations of carbon fullerene (CF) - proteins24, silica NPs - proteins17, 27 and polymer - proteins complexes60 using SEC have been reported. Besides separating bound proteins, SEC is also able to detect preferential binding and exchange rate during NP-protein interactions. Such properties can be analyzed based on elution profile of proteins10.
Reverse Phase Chromatography (RPC)
Proteins can be separated based on different retention times on RPC column. Since NPs are too large to enter the columns, RPC is used for separating protein rather than NP-protein complex11, 38. In a study of copper NP - hemolysate interaction38, aggregates were removed and supernatants were injected into column to analyze free protein and to compare the soluble fractions of hemolysate before and after the addition of copper NPs. Experiments found that HbA0 (the major component of human Hb) was precipitated specifically by copper NPs.
Ion Exchange Chromatography (IEC)
IEC separates proteins and NP-protein complexes according to their net charges. By adjusting pH or ionic concentration of the mobile phase, various protein molecules and NP-protein complexes can be separated. IEC includes cation exchange chromatography and anion exchange chromatography: the former retains cations (positively charged proteins or NP-protein complexes) using a column of negatively charged beads; the later retains anions using positively charged beads. For example, IEC was used to separate gold nanoparticles (GNPs) with various peptide capping61. The GNPs were first bound to the column at low ionic strength and then eluted by increasing the ionic strength.
3.1.2. Electrophoresis
Electrophoresis is the most widely used method for separation and analysis of complex protein mixtures. Among different electrophoresis techniques, capillary electrophoresis and gel electrophoreses are two methods commonly used for analyzing NP-proteins complexes.
Capillary electrophoresis (CE)
CE is able to separate proteins based on their charges and frictional forces62, 63. Separation by CE can be detected using UV or fluorescence detector. CE was used to study the adsorption of the major plasma protein, albumin, onto Poly-(methoxypolyethyleneglycol cyanoacrylate-co- hexadecylcyanoacrylate) (PEG-PHDCA) NPs. CE allowed the direct quantification of adsorbed proteins without the requirement for desorption procedure62. However, one drawback for CE is that proteins are easily adsorbed onto inner surface of capillary and the detection sensitivity is not high.
One-dimensional gel electrophoresis (1-DE)
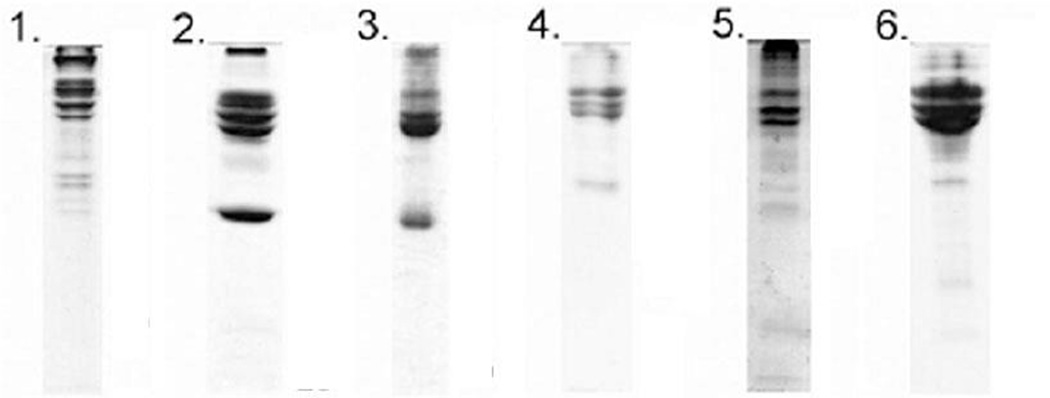
1-DE can be used to separate proteins and nucleic acids. To separate proteins, the gel is usually composed of acrylamide and across-linker to produce mesh networks of polyacrylamide. Sodium dodecyl sulfate polyacrylamide gel electrophoresis (SDS-PAGE) separates proteins according to their molecular weight and is widely used 29, 57, 60, 64–68. For example, six different polystyrene NPs were incubated with human plasma proteins and bound different proteins suggesting the importance of surface property and size of NPs (Fig. 9)65.
Fig. 9.
Illustration of SDS-PAGE gels and bands excised. Lanes: 1, 100-nm amine-modified; 2, 50-nm amine-modified; 3, 100-nm plain; 4, 50-nm plain; 5, 100-nm carboxyl-modified; and 6, 50-nm carboxyl-modified. The plasma concentrations for the different samples were: 1, 2.8; 2, 0.56; 3, 0.28; 4, 0.56; 5, 0.56; and 6, 5.6 ml of plasma per m2 particle surface. Reprinted from Proceedings of the National Academy of Sciences of the United States of America, 2008, 105, 14265–14270, M. Lundqvist; J. Stigler; G. Elia; I. Lynch; T. Cedervall and K. A. Dawson, Nanoparticle size and surface properties determine the protein corona with possible implications for biological impacts.
In simple systems such as NP interacting with a single protein, 1-DE can be used to purify NP-protein complexes. It is also used to evaluate NP-protein binding ratio11, 38, 53.
Two-dimensional gel electrophoresis (2-DE)
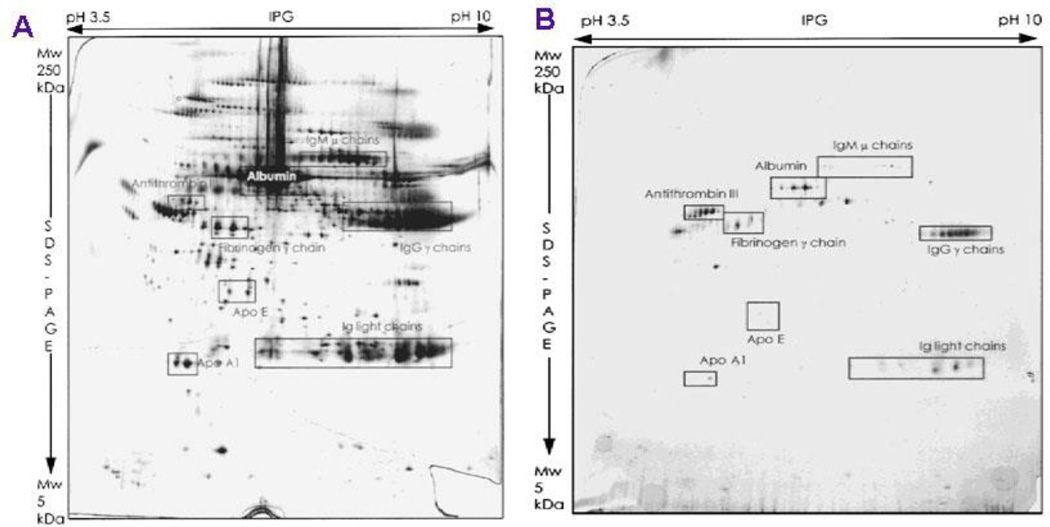
2-DE has been used to separate proteins based on both molecular weight and isoelectric point (pI) in two dimensions62, 63, 69–71. This method is more suitable to separate complicated protein mixtures. Because it is unlikely that two molecules are similar in two distinct properties, molecules are more effectively separated in 2-DE than in 1-DE. Plasma and serum proteins bound to poly(D,L-lactic acid) (PLA) NPs were analyzed by 2-D PAGE (Fig. 10)69.
Fig. 10.
A.2-D PAGE pattern of human citrated plasma. B. 2-D PAGE pattern of proteins adsorbed to PLA NPs incubated in citrated plasma for 5 min. Reprinted from Journal of Biomedical Materials Research, 1997, 37, 229–234. E. Allemann; P. Gravel; J. C. Leroux; L. Balant and R. Gurny, Kinetics of blood component adsorption on poly(D,L-lactic acid) nanoparticles: Evidence of complement C3 component involvement. Copyright (1997), with permission from John Wiley and Sons.
Protein bands on a scanned image of 1-DE gel or protein spots on a scanned image of 2-DE gel could be determined to quantify individual proteins. Because of more effective separation, 2-DE is more suitable for quantitative analysis. Software packages which match protein spots include Delta2D, ImageMaster, Melanie, PDQuest, Progenesis and REDFIN. However, the quantitative method is not accurate for poorly separated spots101.
3.2 Identification of NP-bound proteins
3.2.1 Matrix assisted laser desorption ionization time-of-flight mass spectrometry (MALDI-TOF-MS)
MALDI-TOF-MS is a major method for identifying proteins bound to NPs. Protein spots are excised and digested with a specific protease and the fragments analyzed by MALDI-TOF-MS. The peptide mass fingerprints can then be used to search databases to identify proteins.
There are two ways to identify NP-bound proteins. First, proteins are released from NP surface and separated by 1-DE or 2-DE. In this way, the NP-bound proteins must be first released from NP surface using surfactants24, 46, 60, 63–65, 72. The second method is in situ digestion of purified NP-protein complex followed by LC/MS/MS separation and analysis73. The second method is usually used for highly hydrophobic NPs such as carbon nanotubes because denatured proteins may not be thoroughly released from nanotubes’ surface. Both approaches provide high resolution profile of NP-bound proteins.
3.2.2 N-terminal microsequencing
N-terminal microsequencing is a method of sequencing amino acids in a protein and can be used to identify NP- bound proteins. Spots on 2-DE can be used for protein sequencing using an automatic gas phase sequencer74–79. A successful sequence of a peptide of 10–30 N-terminal amino acids residues can determine the identity of the protein through database search79.
The major drawback of the technique is that it will not work if the N-terminal amino acid is chemically modified or if it is concealed within the interior of a protein. Moreover, since the method requires high protein purity for identification efficiency, it is used in conjunction with 2-DE.
However, neither MALDI-TOF-MS nor N-terminal microsequencing is a good method of quantitative analysis. Western blots or immunoblotting can be used to analyze protein of interest for quantitative analysis63, 67, 68, 74.
4. NP-protein binding kinetics
Interaction of NPs with proteins is a dynamic event involving constant association and dissociation processes. Binding preference and binding strength are reflected by their association (Ka) and dissociation constants (Kd). High binding strength means that proteins will bind NPs irreversibly. The rate of protein binding can only be determined by kinetics measurements. Through monitoring NP-protein binding kinetics, we can obtain kinetic constants and analyze the competitive interactions. Techniques for kinetics analysis are surface plasmon resonance (SPR) and quartz crystal microbalance (QCM). They are real-time, label-free methods that are both quantitative and sensitive.
4.1. Surface Plasmon Resonance (SPR)
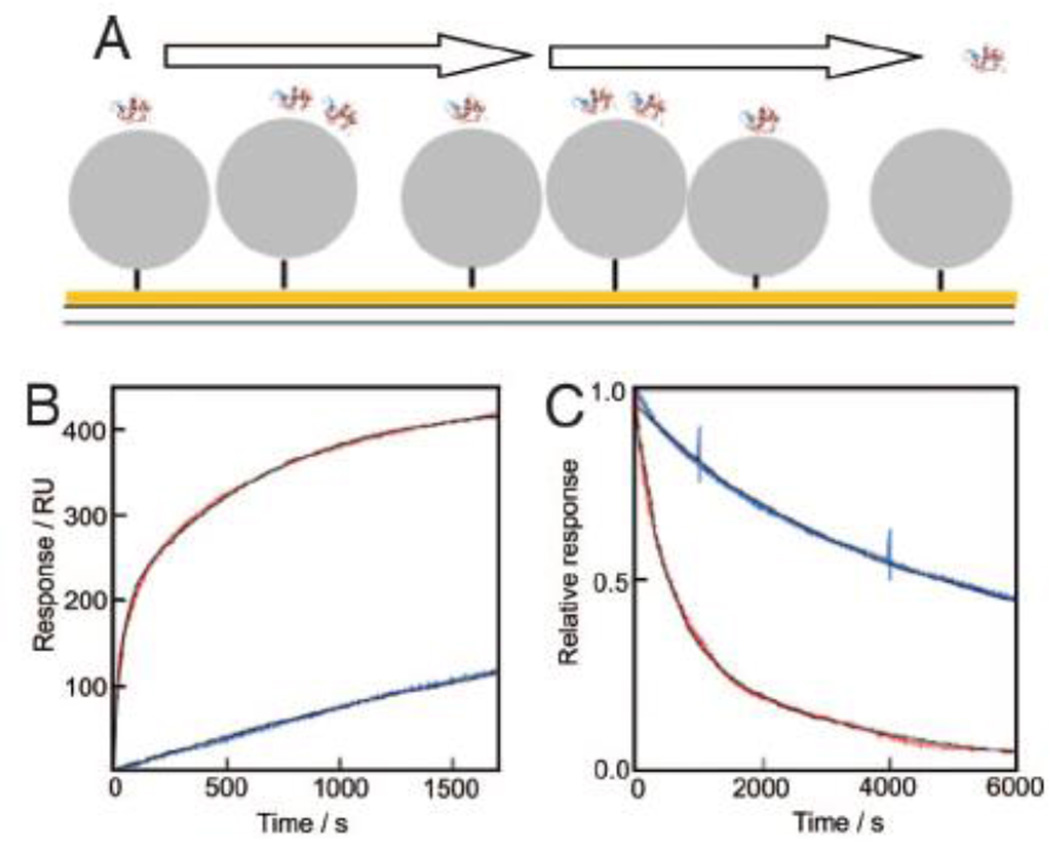
SPR technology is based on the change of oscillation of surface plasmon wave that caused by adsorption of molecules onto metal surface. SPR was used to study kinetics of NP-protein binding10, 21, 82. NPs are anchored on gold surface of the sensor chip and proteins are injected to flow over the NP modified surface. For instance, human plasma proteins were injected into flow chamber, and allowed to bind to and release for N-isopropylacrylamide: N-tert-butylacrylamide copolymer NPs (NIPAM/BAM) (Fig. 11)10. The binding kinetics between plasma proteins with NPs was fitted to a two-component system by equation (8) and equation (9):
| (8) |
| (9) |
where Rt represents the change of refractive index as a function of time and is proportional to the amount of proteins bound onto NPs. Equation (9) refers to the washing process where protein-free buffer is flown over the surface directly after the association phase.
Fig. 11.
SPR studies of plasma–NP interactions. A. Cartoon of a gold surface with thiol-tethered particles and associated protein over which buffer is flown. B and C. SPR data of plasma proteins injected at 60-fold dilution over 70-nm 85:15 NIPAM/BAM (blue) or 50:50 NIPAM/BAM (red) for 30 min (B) followed by buffer flow for 24 h (C, first 6,000 s shown). The black lines are computer fits using Equation (8) and (9). Reprinted from Proceedings of the National Academy of Sciences of the United States of America, 2007, 104, 2050–2055, T. Cedervall, I. Lynch, S. Lindman, T. Berggard, E. Thulin, H. Nilsson, K. A. Dawson and S. Linse. Understanding the nanoparticle-protein corona using methods to quantify exchange rates and affinities of proteins for nanoparticles.
4.2 Quartz Crystal Microbalance (QCM)
QCM is a sensing technology on the basis of piezoelectric effect. It measures the resonant frequency shift that can be correlated with mass changes at the oscillating quartz surface80, 81. Either proteins or NPs are reported to be immobilized onto gold surface on quartz crystal. The binding partner (NP or protein) is then injected into the flow-chamber and flowed over the quartz surface. The frequency is monitored in real time. The relationship between the mass loading and the frequency change in solution follows the modified Sauerbrey equation (10):
| (10) |
where Δf is the change in frequency, Δm is the change in mass, Cf is sensitivity factor, Δρ is the change in density, Δη is the change in viscosity, and f0 is the frequency of unperturbed crystal. For example, QCM was used to detect glutathione-protected gold nanoclusters80. The real-time and quantitative NP-protein binding profile was obtained and the association and dissociation constants were determined by fitting to Langmuir adsorption isotherm (11):
| (11) |
where Δm is the change in mass, Δmmax is the maximum mass loading, C is concentration of NPs, and Ka is association constant. Kinetic parameters were also calculated from the time-dependent binding curves through fitting to equation (12) and equation (13):
| (12) |
| (13) |
where mt and mi are masses at time (t) and infinite time, τ−1 is the time constant at the dose C, Kf and Kr are forward rate and reverse rate constants, respectively. Advantages of QCM over SPR are the ease of the setup and operation in addition to low cost. QCM also allows for multilayer adsorptions (QCM showed no reduction of sensitivity at even 400 nm thickness, whereas SRP showed significant peak broadening at 200 nm thickness). However, the instrumentation and software of SPR are more advanced.
5. Conclusion
NP-protein binding is associated with many biomedical applications and the potential toxicity effects of NP. Many aspects of NP-protein interactions have been investigated by using diverse analytical techniques reviewed in this article. Spectroscopic methods play a significant role in studying binding affinity, binding ratio, and mechanisms of NP-protein interactions. To elucidate NP-proteome interactions, chromatography and electrophoresis techniques are often used to separate NP-bound proteins and MALDI-TOF-MS to identify these proteins. Since NP-protein binding is a dynamic event, SPR and QCM are methods of choice to study kinetics of NP-protein binding. With these analytical strategies and methods, our understanding of NP-protein interactions will be significantly advanced in near future and the safe use of nanotechnology will not be too far ahead.
Supplementary Material
Fig. 8.
A. Four derivatives of trimethylamine-functionalized surfactants; B. Monolayer composition of AuCOOH. Reprinted with permission from N. O. Fischer; A. Verma; C. M. Goodman; J. M. Simard and V. M. Rotello, Reversible “Irreversible” Inhibition of Chymotrypsin Using Nanoparticle Receptors. Journal of the American Chemical Society, 2003, 125, 13387–13391. Copyright 2003, American Chemical Society.
Acknowledgments
This work was supported by the National Basic Research Program of China (973 Program 2010CB933504), National Cancer Institute (P30 CA021765), the American Lebanese Syrian Associated Charities (ALSAC), and St. Jude Children’s Research Hospital.
Biographies

Liwen Li received her B.S. from Shandong University, China, in 2008. She is currently a graduate student at Shandong University. Her research focuses on identifying target protein of anti-cancer small molecules using nanotechnology approach.

Qingxin Mu received his B.S. from Henan University, China in 2005 and he was an International Research Scholar at St. Jude Children’s Research Hospital in Memphis, U.S.A. from 2007 to 2009. He is currently a PhD candidate at Shandong University in China. His research focuses on bioactivity study of surface functionalized nanomaterials and related cellular and molecular mechanisms.

Bin Zhang received his B.S. from Shandong University, China in 1990 and obtained his Ph.D. in analytical chemistry from Saarland University, Germany in 2003. He is currently an associate professor in School of Chemistry and Chemical Engineering of Shandong University. His research focuses on characterization of surface modified nanoparticles and their interactions with biological molecules.

Bing Yan got his Ph.D. from Columbia University in 1990 and carried out postdoctoral research at University of Cambridge and University of Texas Medical School in Houston from 1990 to 1993. From 1993 to 2005, he worked at Novartis, Discovery Partners International, and Bristol-Myers Squibb. Now he is a full member at Department of Chemical Biology and Therapeutics, St. Jude Children’s Research Hospital in Memphis, Tennessee and professor at Shandong University, China. He serves as Associate Editor for “Journal of Combinatorial Chemistry” published by American Chemical Society. He is also editor of book series “Critical Reviews in Combinatorial Chemistry” published by Francis & Taylor Group. He is interested in modifications of nanoparticle surface using combinatorial chemistry and characterization of modified nanioparticles, as well as the biological impacts of such modifications.
References
- 1.Endo M, Strano MS, Ajayan PM. Carbon Nanotubes. 2008;111:13–61. Editon. [Google Scholar]
- 2.Prabaharan M, Grailer JJ, Pilla S, Steeber DA, Gong SQ. Biomaterials. 2009;30:6065–6075. doi: 10.1016/j.biomaterials.2009.07.048. [DOI] [PubMed] [Google Scholar]
- 3.Bridot JL, Faure AC, Laurent S, Riviere C, Billotey C, Hiba B, Janier M, Josserand V, Coll JL, Vander Elst L, Muller R, Roux S, Perriat P, Tillement O. Journal of the American Chemical Society. 2007;129:5076–5084. doi: 10.1021/ja068356j. [DOI] [PubMed] [Google Scholar]
- 4.Huang HC, Chang PY, Chang K, Chen CY, Lin CW, Chen JH, Mou CY, Chang ZF, Chang FH. Journal of Biomedical Science. 2009;16 doi: 10.1186/1423-0127-16-86. [DOI] [PMC free article] [PubMed] [Google Scholar]
- 5.Kam NWS, O’Connell M, Wisdom JA, Dai HJ. Proceedings of the National Academy of Sciences of the United States of America. 2005;102:11600–11605. doi: 10.1073/pnas.0502680102. [DOI] [PMC free article] [PubMed] [Google Scholar]
- 6.Kawasaki H, Akira T, Watanabe T, Nozaki K, Yonezawa T, Arakawa R. Analytical and Bioanalytical Chemistry. 2009;395:1423–1431. doi: 10.1007/s00216-009-3122-0. [DOI] [PubMed] [Google Scholar]
- 7.Zhong H, Lei X, Hun X, Zhang SS. Chemical Communications. 2009:6958–6960. doi: 10.1039/b913922b. [DOI] [PubMed] [Google Scholar]
- 8.Nel A, Xia T, Madler L, Li N. Science. 2006;311:622–627. doi: 10.1126/science.1114397. [DOI] [PubMed] [Google Scholar]
- 9.Schipper ML, Nakayama-Ratchford N, Davis CR, Kam NWS, Chu P, Liu Z, Sun XM, Dai HJ, Gambhir SS. Nature Nanotechnology. 2008;3:216–221. doi: 10.1038/nnano.2008.68. [DOI] [PubMed] [Google Scholar]
- 10.Cedervall T, Lynch I, Lindman S, Berggard T, Thulin E, Nilsson H, Dawson KA, Linse S. Proceedings of the National Academy of Sciences of the United States of America. 2007;104:2050–2055. doi: 10.1073/pnas.0608582104. [DOI] [PMC free article] [PubMed] [Google Scholar]
- 11.Aubin-Tam ME, Hamad-Schifferli K. Langmuir. 2005;21:12080–12084. doi: 10.1021/la052102e. [DOI] [PubMed] [Google Scholar]
- 12.Chen BX, Wilson SR, Das M, Coughlin DJ, Erlanger BF. Proceedings of the National Academy of Sciences of the United States of America. 1998;95:10809–10813. doi: 10.1073/pnas.95.18.10809. [DOI] [PMC free article] [PubMed] [Google Scholar]
- 13.Delfino I, Cannistraro S. Biophysical Chemistry. 2009;139:1–7. doi: 10.1016/j.bpc.2008.09.016. [DOI] [PubMed] [Google Scholar]
- 14.Edri E, Regev O. Analytical Chemistry. 2008;80:4049–4054. doi: 10.1021/ac800124x. [DOI] [PubMed] [Google Scholar]
- 15.Jiang X, Jiang UG, Jin YD, Wang EK, Dong SJ. Biomacromolecules. 2005;6:46–53. doi: 10.1021/bm049744l. [DOI] [PubMed] [Google Scholar]
- 16.Kathiravan A, Renganathan R, Anandan S. Polyhedron. 2009;28:157–161. [Google Scholar]
- 17.Lundqvist M, Sethson I, Jonsson BH. Langmuir. 2004;20:10639–10647. doi: 10.1021/la0484725. [DOI] [PubMed] [Google Scholar]
- 18.Matsuura K, Saito T, Okazaki T, Ohshima S, Yumura M, Iijima S. Chemical Physics Letters. 2006;429:497–502. [Google Scholar]
- 19.Nepal D, Geckeler KE. Small. 2006;2:406–412. doi: 10.1002/smll.200500351. [DOI] [PubMed] [Google Scholar]
- 20.Shang L, Wang YZ, Jiang JG, Dong SJ. Langmuir. 2007;23:2714–2721. doi: 10.1021/la062064e. [DOI] [PubMed] [Google Scholar]
- 21.Teichroeb JH, Forrest JA, Jones LW. European Physical Journal E. 2008;26:411–415. doi: 10.1140/epje/i2007-10342-9. [DOI] [PubMed] [Google Scholar]
- 22.Tessier PM, Jinkoji J, Cheng YC, Prentice JL, Lenhoff AM. Journal of the American Chemical Society. 2008;130:3106–3112. doi: 10.1021/ja077624q. [DOI] [PubMed] [Google Scholar]
- 23.Zorbas V, Smith AL, Xie H, Ortiz-Acevedo A, Dalton AB, Dieckmann GR, Draper RK, Baughman RH, Musselman IH. Journal of the American Chemical Society. 2005;127:12323–12328. doi: 10.1021/ja050747v. [DOI] [PubMed] [Google Scholar]
- 24.Belgorodsky B, Fadeev L, Ittah V, Benyamini H, Zelner S, Huppert D, Kotlyar AB, Gozin M. Bioconjugate Chemistry. 2005;16:1058–1062. doi: 10.1021/bc050103c. [DOI] [PubMed] [Google Scholar]
- 25.Chen YL, Zhang XF, Gong YD, Zhao NM, Zeng TY, Song XQ. Journal of Colloid and Interface Science. 1999;214:38–45. [Google Scholar]
- 26.Fischer NO, Verma A, Goodman CM, Simard JM, Rotello VM. Journal of the American Chemical Society. 2003;125:13387–13391. doi: 10.1021/ja0352505. [DOI] [PubMed] [Google Scholar]
- 27.Karlsson M, Carlsson U. Biophysical Journal. 2005;88:3536–3544. doi: 10.1529/biophysj.104.054809. [DOI] [PMC free article] [PubMed] [Google Scholar]
- 28.Lacerda SH, Park JJ, Meuse C, Pristinski D, Becker ML, Karim A, Douglas JF. ACS nano. 2009 doi: 10.1021/nn9011187. [DOI] [PubMed] [Google Scholar]
- 29.Lee IS, Lee N, Park J, Kim BH, Yi YW, Kim T, Kim TK, Lee IH, Paik SR, Hyeon T. Journal of the American Chemical Society. 2006;128:10658–10659. doi: 10.1021/ja063177n. [DOI] [PubMed] [Google Scholar]
- 30.Macaroff PP, Oliveira DM, Lacava ZGA, Azevedo RB, Lima ECD, Morais PC, Tedesco AC. 2004 [Google Scholar]
- 31.Mu QX, Liu W, Xing YH, Zhou HY, Li ZW, Zhang Y, Ji LH, Wang F, Si ZK, Zhang B, Yan B. Journal of Physical Chemistry C. 2008;112:3300–3307. [Google Scholar]
- 32.Pramanik S, Banerjee P, Sarkar A, Bhattacharya SC. Journal of Luminescence. 2008;128:1969–1974. [Google Scholar]
- 33.Sahoo B, Goswami M, Nag S, Maiti S. Chemical Physics Letters. 2007;445:217–220. [Google Scholar]
- 34.Wangoo N, Suri CR, Shekhawat G. Applied Physics Letters. 2008;92:3. [Google Scholar]
- 35.Xiao Q, Huang S, Qi ZD, Zhou B, He ZK, Liu Y. Biochimica Et Biophysica Acta-Proteins and Proteomics. 2008;1784:1020–1027. doi: 10.1016/j.bbapap.2008.03.018. [DOI] [PubMed] [Google Scholar]
- 36.You CC, Miranda OR, Gider B, Ghosh PS, Kim IB, Erdogan B, Krovi SA, Bunz UHF, Rotello VM. Nature Nanotechnology. 2007;2:318–323. doi: 10.1038/nnano.2007.99. [DOI] [PubMed] [Google Scholar]
- 37.Zhou HY, Mu QX, Gao NN, Liu AF, Xing YH, Gao SL, Zhang Q, Qu GB, Chen YY, Liu G, Zhang B, Yan B. Nano Letters. 2008;8:859–865. doi: 10.1021/nl0730155. [DOI] [PubMed] [Google Scholar]
- 38.Bhattacharya J, Choudhuri U, Siwach O, Sen P, Dasgupta AK. Nanomedicine: Nanotechnology, Biology and Medicine. 2006;2:191–199. doi: 10.1016/j.nano.2006.07.001. [DOI] [PubMed] [Google Scholar]
- 39.Inomoto N, Osaka N, Suzuki T, Hasegawa U, Ozawa Y, Endo H, Akiyoshi K, Shibayama M. Polymer. 2009;50:541–546. [Google Scholar]
- 40.Ipe BI, Shukla A, Lu HC, Zou B, Rehage H, Niemeyer CM. Chemphyschem. 2006;7:1112–1118. doi: 10.1002/cphc.200500660. [DOI] [PubMed] [Google Scholar]
- 41.You CC, De M, Rotello VM. Current Opinion in Chemical Biology. 2005;9:639–646. doi: 10.1016/j.cbpa.2005.09.012. [DOI] [PubMed] [Google Scholar]
- 42.Bradley K, Briman M, Star A, Gruner G. Nano Letters. 2004;4:253–256. [Google Scholar]
- 43.Chen RJ, Zhang YG, Wang DW, Dai HJ. Journal of the American Chemical Society. 2001;123:3838–3839. doi: 10.1021/ja010172b. [DOI] [PubMed] [Google Scholar]
- 44.Shim M, Kam NWS, Chen RJ, Li YM, Dai HJ. Nano Letters. 2002;2:285–288. [Google Scholar]
- 45.Hong R, Fischer NO, Verma A, Goodman CM, Emrick T, Rotello VM. Journal of the American Chemical Society. 2004;126:739–743. doi: 10.1021/ja037470o. [DOI] [PubMed] [Google Scholar]
- 46.Mu Q, Li Z, Li X, Mishra SR, Zhang B, Si Z, Yang L, Jiang W, Yan B. J. Phys. Chem. C. 2009;113:5390–5395. [Google Scholar]
- 47.Shang W, Nuffer JH, Dordick JS, Siegel RW. Nano Letters. 2007;7:1991–1995. doi: 10.1021/nl070777r. [DOI] [PubMed] [Google Scholar]
- 48.Shen XC, Liou XY, Ye LP, Liang H, Wang ZY. Journal of Colloid and Interface Science. 2007;311:400–406. doi: 10.1016/j.jcis.2007.03.006. [DOI] [PubMed] [Google Scholar]
- 49.Srivastava S, Verma A, Frankamp BL, Rotello VM. Advanced Materials. 2005;17 617-+ [Google Scholar]
- 50.Su ZD, Leung T, Honek JF. Journal of Physical Chemistry B. 2006;110:23623–23627. doi: 10.1021/jp065837g. [DOI] [PubMed] [Google Scholar]
- 51.Verma A, Simard JM, Rotello VM. Langmuir. 2004;20:4178–4181. doi: 10.1021/la036183v. [DOI] [PubMed] [Google Scholar]
- 52.Vertegel AA, Siegel RW, Dordick JS. Langmuir. 2004;20:6800–6807. doi: 10.1021/la0497200. [DOI] [PubMed] [Google Scholar]
- 53.Worrall JWE, Verma A, Yan HH, Rotello VM. Chemical Communications. 2006:2338–2340. doi: 10.1039/b517421j. [DOI] [PubMed] [Google Scholar]
- 54.You CC, De M, Han G, Rotello VM. Journal of the American Chemical Society. 2005;127:12873–12881. doi: 10.1021/ja0512881. [DOI] [PubMed] [Google Scholar]
- 55.Karajanagi SS, Vertegel AA, Kane RS, Dordick JS. Langmuir. 2004;20:11594–11599. doi: 10.1021/la047994h. [DOI] [PubMed] [Google Scholar]
- 56.Mandal HS, Kraatz HB. Journal of the American Chemical Society. 2007;129 doi: 10.1021/ja0703372. 6356-+ [DOI] [PubMed] [Google Scholar]
- 57.Peng ZG, Hidajat K, Uddin MS. Journal of Colloid and Interface Science. 2004;271:277–283. doi: 10.1016/j.jcis.2003.12.022. [DOI] [PubMed] [Google Scholar]
- 58.Braden BC, Goldbaum FA, Chen BX, Kirschner AN, Wilson SR, Erlanger BF. Proceedings of the National Academy of Sciences of the United States of America. 2000;97:12193–12197. doi: 10.1073/pnas.210396197. [DOI] [PMC free article] [PubMed] [Google Scholar]
- 59.Lundqvist M, Sethson I, Jonsson BH. Langmuir. 2005;21:5974–5979. doi: 10.1021/la050569j. [DOI] [PubMed] [Google Scholar]
- 60.Cedervall T, Lynch I, Foy M, Berggad T, Donnelly SC, Cagney G, Linse S, Dawson KA. Angewandte Chemie-International Edition. 2007;46:5754–5756. doi: 10.1002/anie.200700465. [DOI] [PubMed] [Google Scholar]
- 61.Levy R, Thanh NTK, Doty RC, Hussain I, Nichols RJ, Schiffrin DJ, Brust M, Fernig DG. Journal of the American Chemical Society. 2004;126:10076–10084. doi: 10.1021/ja0487269. [DOI] [PubMed] [Google Scholar]
- 62.Kim HR, Andrieux K, Delomenie C, Chacun H, Appel M, Desmaele D, Taran F, Georgin D, Couvreur P, Taverna M. Electrophoresis. 2007;28:2252–2261. doi: 10.1002/elps.200600694. [DOI] [PubMed] [Google Scholar]
- 63.Kim HR, Andrieux K, Gil S, Taverna M, Chacun H, Desmaele D, Taran F, Georgin D, Couvreur P. Biomacromolecules. 2007;8:793–799. doi: 10.1021/bm060711a. [DOI] [PubMed] [Google Scholar]
- 64.Dutta D, Sundaram SK, Teeguarden JG, Riley BJ, Fifield LS, Jacobs JM, Addleman SR, Kaysen GA, Moudgil BM, Weber TJ. Toxicological Sciences. 2007;100:303–315. doi: 10.1093/toxsci/kfm217. [DOI] [PubMed] [Google Scholar]
- 65.Lundqvist M, Stigler J, Elia G, Lynch I, Cedervall T, Dawson KA. Proceedings of the National Academy of Sciences of the United States of America. 2008;105:14265–14270. doi: 10.1073/pnas.0805135105. [DOI] [PMC free article] [PubMed] [Google Scholar]
- 66.Salvador-Morales C, Flahaut E, Sim E, Sloan J, Green MLH, Sim RB. Molecular Immunology. 2006;43:193–201. doi: 10.1016/j.molimm.2005.02.006. [DOI] [PubMed] [Google Scholar]
- 67.Nagayama S, Ogawara K, Fukuoka Y, Higaki K, Kimura T. International journal of pharmaceutics. 2007;342:215–221. doi: 10.1016/j.ijpharm.2007.04.036. [DOI] [PubMed] [Google Scholar]
- 68.Stolnik S, Daudali B, Arien A, Whetstone J, Heald CR, Garnett MC, Davis SS, Illum L. Biochimica et biophysica acta. 2001;1514:261–279. doi: 10.1016/s0005-2736(01)00376-5. [DOI] [PubMed] [Google Scholar]
- 69.Allemann E, Gravel P, Leroux JC, Balant L, Gurny R. Journal of Biomedical Materials Research. 1997;37:229–234. doi: 10.1002/(sici)1097-4636(199711)37:2<229::aid-jbm12>3.0.co;2-9. [DOI] [PubMed] [Google Scholar]
- 70.Gessner A, Lieske A, Paulke BR, Muller RH. European Journal of Pharmaceutics and Biopharmaceutics. 2002;54:165–170. doi: 10.1016/s0939-6411(02)00081-4. [DOI] [PubMed] [Google Scholar]
- 71.Labarre D, Vauthier C, Chauvierre U, Petri B, Muller R, Chehimi MM. Biomaterials. 2005;26:5075–5084. doi: 10.1016/j.biomaterials.2005.01.019. [DOI] [PubMed] [Google Scholar]
- 72.Bayraktar H, You CC, Rotello VM, Knapp MJ. Journal of the American Chemical Society. 2007;129 doi: 10.1021/ja067497i. 2732-+ [DOI] [PubMed] [Google Scholar]
- 73.Chang SY, Zheng NY, Chen CS, Chen CD, Chen YY, Wang CRC. Journal of the American Society for Mass Spectrometry. 2007;18:910–918. doi: 10.1016/j.jasms.2007.01.011. [DOI] [PubMed] [Google Scholar]
- 74.Aggarwal P, Hall JB, McLeland CB, Dobrovolskaia MA, McNeil SE. Advanced Drug Delivery Reviews. 2009;61:428–437. doi: 10.1016/j.addr.2009.03.009. [DOI] [PMC free article] [PubMed] [Google Scholar]
- 75.Gessner A, Olbrich C, Schroder W, Kayser O, Muller RH. International journal of pharmaceutics. 2001;214:87–91. doi: 10.1016/s0378-5173(00)00639-6. [DOI] [PubMed] [Google Scholar]
- 76.Gref R, Luck M, Quellec P, Marchand M, Dellacherie E, Harnisch S, Blunk T, Muller RH. Colloids and Surfaces B-Biointerfaces. 2000;18:301–313. doi: 10.1016/s0927-7765(99)00156-3. [DOI] [PubMed] [Google Scholar]
- 77.Lemarchand C, Gref R, Passirani C, Garcion E, Petri B, Muller R, Costantini D, Couvreur P. Biomaterials. 2006;27:108–118. doi: 10.1016/j.biomaterials.2005.04.041. [DOI] [PubMed] [Google Scholar]
- 78.Luck M, Pistel KF, Li YX, Blunk T, Muller RH, Kissel T. Journal of Controlled Release. 1998;55:107–120. doi: 10.1016/s0168-3659(98)00030-3. [DOI] [PubMed] [Google Scholar]
- 79.Luck M, Schroder W, Harnisch S, Thode K, Blunk T, Paulke BR, Kresse M, Muller RH. Electrophoresis. 1997;18:2961–2967. doi: 10.1002/elps.1150181538. [DOI] [PubMed] [Google Scholar]
- 80.Gerdon AE, Wright DW, Cliffel DE. Analytical Chemistry. 2005;77:304–310. doi: 10.1021/ac048953t. [DOI] [PubMed] [Google Scholar]
- 81.Kaufman ED, Belyea J, Johnson MC, Nicholson ZM, Ricks JL, Shah PK, Bayless M, Pettersson T, Feldoto Z, Blomberg E, Claesson P, Franzen S. Langmuir. 2007;23:6053–6062. doi: 10.1021/la063725a. [DOI] [PubMed] [Google Scholar]
- 82.Linse S, Cabaleiro-Lago C, Xue WF, Lynch I, Lindman S, Thulin E, Radford SE, Dawson KA. Proceedings of the National Academy of Sciences of the United States of America. 2007;104:8691–8696. doi: 10.1073/pnas.0701250104. [DOI] [PMC free article] [PubMed] [Google Scholar]
- 83.Pompa PP, Chiuri R, Manna L, Pellegrino T, del Mercato LL, Parak WJ, Calabi F, Cingolani R, Rinaldi R. Chemical Physics Letters. 2006;417:351–357. [Google Scholar]
- 84.Pons T, Medintz IL, Wang X, English DS, Mattoussi H. Journal of the American Chemical Society. 2006;128:15324–15331. doi: 10.1021/ja0657253. [DOI] [PubMed] [Google Scholar]
- 85.Casanova D, Giaume D, Moreau M, Martin JL, Gacoin T, Boilot JP, Alexandrou A. Journal of the American Chemical Society. 2007;129 doi: 10.1021/ja0731975. 12592-+ [DOI] [PubMed] [Google Scholar]
- 86.Lakowicz JR. Principles of fluorescence spectroscopy. 2nd. New York: Kluwer Academic/Plenum; 1999. [Google Scholar]
- 87.Smith AM, Nie S. Analyst. 2004;129:672–677. doi: 10.1039/b404498n. [DOI] [PubMed] [Google Scholar]
- 88.Das SK, Darshi M, Cheley S, Wallace MI, Bayley H. Chembiochem. 2007;8:994–999. doi: 10.1002/cbic.200600474. [DOI] [PubMed] [Google Scholar]
- 89.De M, Rotello VM. Chem. Commun. 2008:3504–3506. doi: 10.1039/b805242e. [DOI] [PMC free article] [PubMed] [Google Scholar]
- 90.Greenfield NJ. Nature Protocols. 2006;1:2876–2890. doi: 10.1038/nprot.2006.202. [DOI] [PMC free article] [PubMed] [Google Scholar]
- 91.Whitmore L, Wallace BA. Biopolymers. 2008;89:392–400. doi: 10.1002/bip.20853. [DOI] [PubMed] [Google Scholar]
- 92.Thomas GJ. Annual Review of Biophysics and Biomolecular Structure. 1999;28 doi: 10.1146/annurev.biophys.28.1.1. 1-+ [DOI] [PubMed] [Google Scholar]
- 93.Engel MF, van Mierlo CP, Visser AJ. J Biol Chem. 2002;277:10922–10930. doi: 10.1074/jbc.M106005200. [DOI] [PubMed] [Google Scholar]
- 94.Chakraborty S, Ittah V, Bai P, Luo L, Haas E, Peng Z. Biochemistry. 2001;40:7228–7238. doi: 10.1021/bi010004w. [DOI] [PubMed] [Google Scholar]
- 95.Ingham KC, Brew SA, Broekelmann TJ, McDonald JA. J Biol Chem. 1984;259:11901–11907. [PubMed] [Google Scholar]
- 96.Turoverov KK, Verkhusha VV, Shavlovsky MM, Biktashev AG, Povarova OI, Kuznetsova IM. Biochemistry. 2002;41:1014–1019. doi: 10.1021/bi015548c. [DOI] [PubMed] [Google Scholar]
- 97.De M, You CC, Srivastava S, Rotello VM. Journal of the American Chemical Society. 2007;129:10747–10753. doi: 10.1021/ja071642q. [DOI] [PubMed] [Google Scholar]
- 98.Lindman S, Lynch I, Thulin E, Nilsson H, Dawson KA, Linse S. Nano Letters. 2007;7:914–920. doi: 10.1021/nl062743+. [DOI] [PubMed] [Google Scholar]
- 99.Rozhkov SP, Goryunov AS, Sukhanova GA, Borisova AG, Rozhkova NN, Andrievsky GV. Biochemical and Biophysical Research Communications. 2003;303:562–566. doi: 10.1016/s0006-291x(03)00392-9. [DOI] [PubMed] [Google Scholar]
- 100.Ikeda Y, Taniguchi N, Noguchi T. J Biol Chem. 2000;275:9150–9156. doi: 10.1074/jbc.275.13.9150. [DOI] [PubMed] [Google Scholar]
- 101.Arora PS, Yamagiwa H, Srivastava A, Bolander ME, Sarkar G. J Orthop Sci. 2005;10:160–166. doi: 10.1007/s00776-004-0878-0. [DOI] [PubMed] [Google Scholar]
Associated Data
This section collects any data citations, data availability statements, or supplementary materials included in this article.


