

Abstract
Plants and soil microbes show parallel patterns of species-level diversity. Diverse plant communities release a wider range of organics that are consumed by more microbial species. We speculated, however, that diversity metrics accounting for the evolutionary distance across community members would reveal opposing patterns between plant and soil bacterial phylogenetic diversity. Plant phylogenetic diversity enhances plant productivity and thus expectedly soil fertility. This, in turn, might reduce bacterial phylogenetic diversity by favouring one (or a few) competitive bacterial clade. We collected topsoils in 15 semi-arid plant patches and adjacent low-cover areas configuring a plant phylodiversity gradient, pyrosequenced the 16S rRNA gene to identify bacterial taxa and analysed soil fertility parameters. Structural equation modelling showed positive effects of both plant richness and phylogenetic diversity on soil fertility. Fertility increased bacterial richness but reduced bacterial phylogenetic diversity. This might be attributed to the competitive dominance of a lineage based on its high relative fitness. This suggests biotic interactions as determinants of the soil bacterial community assembly, while emphasizing the need to use phylogeny-informed metrics to tease apart the processes underlying the patterns of diversity.
Keywords: community assembly, fitness differences, phylogenetic diversity, proteobacteria, soil fertility, soil microbes
1. Background
Unravelling the linkages between plants and soil microbes is crucial to understand their community assembly and the functioning of ecosystems [1,2]. Traditionally, diversity patterns of plants and decomposers have been explored at the species level and generally found to be positively related [3,4] although results can be context-dependent [5]. Attempts to link above- and below-ground diversity by using phylogeny-informed variables might help uncover the ecological processes underlying community patterns [6]. The reason behind this statement is that phylogenetic diversity metrics account for the evolutionary distance among co-existing organisms and, since traits tend to be phylogenetically conserved [7,8], these measures integrate the ecological complementarity of the community members [9].
Plant phylogenetic diversity has been shown to enhance plant productivity owing to the more efficient usage of the overall resource as a result of functional complementarity [10]. Furthermore, increasing levels of plant phylogenetic diversity lead to higher soil microbial productivity and efficiency in decomposing organic resources [11]. This link between plant phylogenetic diversity and microbial productivity can theoretically proceed through one of the two described mechanisms assembling productive microbial communities, either mediated through niche or fitness differences (figure 1). Coexistence patterns mediated by niche differences can arise if more phylodiverse plant communities releasing a wider range of oxidizable compounds provide more niches for microbes to exploit, thus increasing microbial phylogenetic diversity (solid arrow in figure 1a). This occurs when competitive exclusion has purged taxa that are too functionally similar (see [12] for details). This first mechanism would generate a positive relationship between plant and soil microbial phylodiversity congruent with the diversity patterns observed at the species-level [3,4]. On the contrary, coexistence patterns mediated by fitness differences can arise if increased organic inputs at high plant phylodiversity levels are more efficiently exploited by certain competitive clades with high relative fitness (sensu Chesson [13]; solid arrow in figure 1b). The competitive exclusion of distantly related lineages based on relative fitness differences can intensify the relatedness of co-occurring microbes, and hence reduce microbial phylogenetic diversity [12,14]. This second mechanism would therefore generate an inverse relationship between plant and soil microbial phylogenetic diversity. Both mechanisms—either based on the coexistence of complementary microbes due to their niche differences or on the competitive dominance of a few clades through fitness differences—can be coherent with the direct connection observed between plant phylogenetic diversity and microbial productivity [11]. A community of functionally complementary organisms can be more productive by consuming more of the total available resources (dashed arrow in figure 1a), while dominant competitors can produce more per unit resource than others (dashed arrow in figure 1b) [15]. Available evidence from the bacterial domain suggests that complementarity effects are relatively unimportant due to the functional redundancy of natural soil bacterial communities [16]. Fitness differences, instead, have been posed to operate in soil bacterial communities driven by the superior competitive ability of Proteobacteria, a bacterial phylum that can outcompete deeply branching clades particularly under increased soil fertility [17,18].
Figure 1.
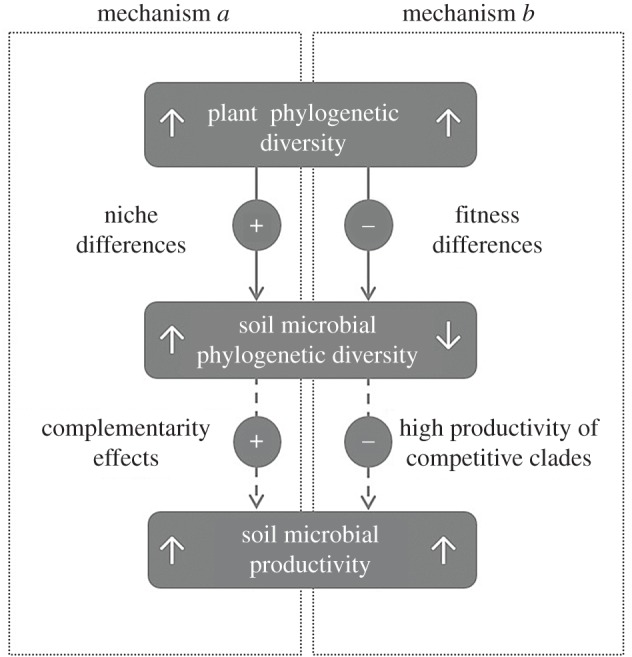
Theoretical mechanisms linking plant and soil microbial phylogenetic diversity, and microbial productivity. (+) and (−) indicate positive and negative correlations, respectively. (a) Plant phylogenetic diversity promotes soil microbial phylogenetic diversity through increasing available niches, thus fostering microbial productivity through the more efficient usage of the total resources by a community of complementary microbes. The results are parallel patterns between plant and microbial phylogenetic diversity, and positive correlations between microbial diversity and productivity. (b) Plant phylogenetic diversity reduces soil microbial phylogenetic diversity through the promotion of closely related strong competitors with high relative fitness, which are comparatively more productive. The results are opposing patterns between plant and microbial phylogenetic diversity, and negative correlations between microbial diversity and productivity.
Facilitation-driven ecosystems provide a suitable setting to test the contribution of the different facets of diversity to the influence of plant communities on soil microbial communities. In water-limited environments, plant–plant facilitation typically structures plant communities in multispecific patches surrounded by low-cover areas [19]. Nurse plants able to colonize barren soils modify the microenvironment and allow the establishment of other less stress-tolerant species [20]. In plant patches shaped by facilitation, coexistence is maximized under phylogenetically diverse neighbourhoods, thus increasing the levels of plant phylogenetic diversity [21,22]. This responds to the tendency of phylogenetically distant organisms to be functionally distinct [7], a feature that allows their coexistence and helps diminishing environmental stress [11]. Because facilitation increases plant phylogenetic diversity, facilitation assembled plant patches—including the nurse and its beneficiaries—naturally configure plant phylogenetic diversity gradients [11,21]. Here, we explored the diversity patterns of plants and soil bacteria in a water-limited facilitation-driven ecosystem to specifically test whether plant phylogenetic diversity increases the evolutionary relatedness of coexisting bacteria, thus ultimately reducing soil bacterial phylogenetic diversity, through promoting soil fertility [17,18].
2. Material and methods
(a). Study system
We selected a facilitation-driven Mediterranean ecosystem in southeast Spain (UTM 30N 689062, 4238201) with a mean annual rainfall of 240 mm and average temperature of 20°C. The vegetation is a shrubland dominated by the legume Ononis tridentata, which acts as a nurse plant that facilitates dwarf shrubs (Helianthemum syriacum, Helichrysum stoechas), grasses (Stipa offneri, Brachypodium retusum) and herbs (Linum strictum) [11]. The nurse and its beneficiary species form multi-specific plant patches that range from 1 to 5 m2 (hereafter ‘patches') and are surrounded by a low-cover matrix (hereafter ‘gaps'). Soils are Typic Xerorthents developed on gypsum, which are young soils with properties poorly differentiated from their parent material [23].
(b). Plant and soil bacterial diversity
On May 2010, we selected 15 plant patches, defined as groups of plants growing below the canopy of an O. tridentata individual, and gaps, defined as the open space adjacent to each patch. Patches and adjacent gaps had the same geometric shape and area. We registered plant abundance within each patch and gap by using the point contact method (see [11] for details and data).
We collected topsoils (0–2 cm) because the effect of plant debris on soils was restricted to the uppermost layer (field observation), probably because in this stressful ecosystem plants face water limitation, high summer temperatures and gypsum toxicity [24]. Five soil sub-samples (around 100 g) were collected randomly from the area of each patch or gap, and then bulked into a single composite sample thus making a total of 30 samples. We transported the samples to the laboratory on ice, sieved them (less than 1 mm) and stored them at 4°C. We extracted the soil DNA, pyrosequenced the bacterial 16S rRNA gene and, after removing low-quality sequences, artefacts and singletons, obtained the abundance of 3290 operational taxonomic units (OTUs) in each patch and gap. The relative abundance of each OTU in each sample was calculated based on the total number of sequences in the same sample, and subsequently corrected by the number of 16S rRNA gene copies (see ref. [25] for details and data). We discarded two samples which failed to amplify. We also quantified several physical and chemical variables related to soil fertility: total organic C (TOC), total nitrogen (TN), water-soluble C (WSC), water-soluble carbohydrates (CH), carbonates (CaCO3) and gravimetric humidity (GH) using standard procedures [11] (table 1).
Table 1.
Soil physical and chemical parameters in plant patches and gaps.
| parameter | mean | s.d. | range |
|---|---|---|---|
| TOC (g kg−1) | 59.7 | 39.7 | 18.1–125.2 |
| TN (g kg−1) | 3.9 | 2.9 | 0.8–9.4 |
| WSC (mg kg−1) | 272.4 | 238.7 | 34.8–822.5 |
| CH (mg kg−1) | 46.7 | 25.5 | 11.1–114.6 |
| CaCO3 (%) | 18.9 | 5.8 | 4.7–29.2 |
| GH (%) | 2.9 | 1.5 | 0.8–5.7 |
We computed several metrics of plant and soil bacterial diversity: (i) richness, measured as the number of species and OTUs, respectively and (ii) two phylogeny-informed metrics of diversity, i.e. the standardized mean phylogenetic distance (std MPD) between all pairs of species or OTUs, and the standardized mean nearest taxon distance (std MNTD) of each species or OTU to its nearest neighbour in the phylogenetic tree. Both std MPD and MNTD were weighted by taxon abundance and calculated using the picante package for R [26,27]. Standardized MPD and MNTD indicate whether co-occurring taxa are more (negative values) or less (positive values) phylogenetically related than expected by chance. While MPD informs on deep level relatedness, MNTD inspects terminal relationships [9]. Prior to calculating MPDs and MNTDs, we reconstructed phylogenies for plants and bacteria as in [11,25], respectively. The topology of the plant phylogeny was obtained with Phylomatic in Phylocom [28] by using the backbone phylogeny of APG [29]. We simultaneously resolved polytomies and adjusted branch lengths with the help of BEAST and the PolytomyResolver script, which set the chronological and topological constraints as well as the specifications of a birth–death tree prior [30,31]. We ran Markov chain Monte Carlo analyses for 106 iterations, sampling trees every 103 iterations, discarded a 25% burn-in, and randomly selected 100 fully resolved dated trees. These 100 trees were used in subsequent analysis to account for the topological and chronological uncertainty associated with phylogeny reconstruction. Three independent bacterial phylogenetic trees were performed after removing hypervariable regions with RAxML 7.3.0 using the GTRGAMMA substitution model [32]. In order to reduce the uncertainty of phylogenetic reconstruction using short reads, we constrained the basal relationships according to the topology of the Silva mega-tree [33].
To discard sampling effects confounding the relationship between plant and bacterial diversity patterns, e.g. plants in low-diversity plots might happen to associate with a set of more closely related bacteria, we performed a nestedness test on the plant × patch/gap presence–absence matrix. Binmatnest nestedness algorithm was calculated under null model 3 with the help of the bipartite package for R [34,35]. Significant nestedness temperature indicated that species-poor patches were subsets of species-rich patches (18.9, p < 0.001), indicating that plant communities were composed of different combinations of the same set of species across plots, rather than plots being taxonomically distinct.
(c). Structural equation modelling
We used structural equation modelling (SEM) to test the direct and indirect (i.e. mediated by soil fertility) effects of plant diversity on soil bacterial diversity, using either richness or phylogenetic diversity with the sem package for R [36]. Plant and soil bacterial richness were defined as the number of species and OTUs, respectively. Plant and soil bacterial phylogenetic diversity were defined as the average std MPD (or MNTD) between pairs of plant species in 100 phylogenetic trees or between pairs of bacterial OTUs in three phylogenetic trees. Finally, we reduced soil physical and chemical variables through principal component (PC) analysis based on a correlation matrix with the prcomp function in R. We used the first PC as a proxy of soil fertility as explained below.
3. Results
Plant and soil bacterial communities showed parallel patterns of species richness (figure 2a), but opposing patterns of phylogenetic diversity (figure 2b). Plant richness in our study plots ranged from 3 to 20 species (mean ± s.d., 10.9 ± 4.3 species; figure 2a), which had a std MPD between −1.66 and 1.12 (−0.006 ± 0.69; figure 2b). The number of soil bacterial OTUs oscillated between 74 and 645 (429.7 ± 128.6; figure 2a), with std MPDs ranging from −6.34 to 0.46 (−2.90 ± 1.71; figure 2b). While plant richness and phylogenetic diversity (std MPD) were directly correlated (r = 0.55, p < 0.01), soil bacterial richness and phylogenetic diversity had an inverse relationship (r = −0.69, p < 0.001). We reduced all soil parameters through PC analysis (electronic supplementary material, S1). Samples collected from plant patches and gaps were located in opposite poles of PC1, which explained 81% of the total variance. We interpreted PC1 as a soil fertility gradient, with increasing contents in oxidizable substances, nutrients and moisture towards the samples taken underneath plant patches (electronic supplementary material, S1).
Figure 2.
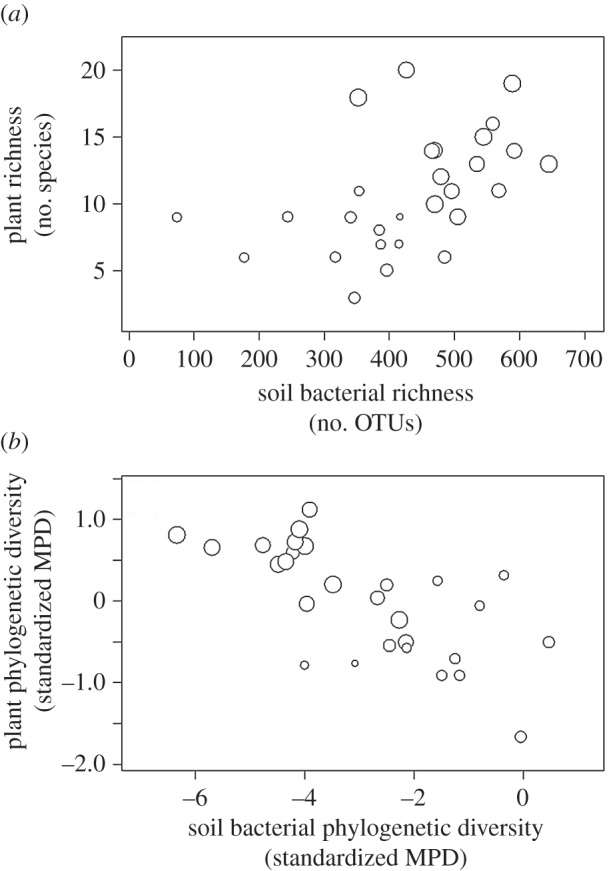
Plant and soil bacterial communities show (a) parallel patterns of species-level diversity (richness), but (b) opposing patterns of phylogenetic diversity (standardized MPD). Bubble radius is proportional to the relative abundance of Proteobacteria in each plot.
SEM showed that plant richness had a direct positive effect on soil fertility (PC1), which in turn significantly increased soil bacterial richness (figure 3a). Also plant phylogenetic diversity (std MPD) had a direct positive effect on soil fertility (PC1), but this reduced soil bacterial phylogenetic diversity in contrast to bacterial richness (figure 3b). Both SEMs explained ca 45% of the variation in soil fertility. While the first model accounted for 50% of the variation in bacterial richness, the second model explained 68% of the variation in bacterial std MPD. We did not find significant direct effects of plant diversity on soil bacterial diversity, either using richness or std MPD measures (figure 3a,b). When we removed this direct relationship between plant and bacterial diversity, the models showed a good fit to our data, as suggested by the non-significant χ2-tests both using richness (N = 28, χ2 = 0.00032, d.f. = 1, p > 0.9) and std MPDs (N = 28, χ2 = 2.56, d.f. = 1, p > 0.1). Several indices—goodness-of-fit index (GFI), root mean square error of approximation (RMSEA), comparative fit index (CFI) and standardized root mean square residual (SRMR)—suggested a reasonable fit of both models (richness: GFI = 0.99, RMSEA = 0.0, CFI = 1.0, SRMR = 0.00074; std MPDs: GFI = 0.94, RMSEA = 0.24, CFI = 0.96, SRMR = 0.05) [37].
Figure 3.

SEM shows that (a) plant richness has a positive effect on soil fertility, which increases soil bacterial richness, (b) plant phylogenetic diversity (standardized MPD) also has a positive effect on soil fertility, which reduces soil bacterial phylogenetic diversity. Soil fertility represents the first principal component (PC1) of a PC analysis considering total organic C, total N, water-soluble C, water-soluble carbohydrates, gravimetric humidity and carbonates. Solid and dashed arrows, respectively, indicate positive and negative standardized coefficients (*p < 0.001). e indicates error term.
High levels of plant richness and phylogenetic diversity (std MPD) correlated with high relative abundances of Proteobacteria (r = 0.68 and r = 0.64, p < 0.001; bubble size in figure 2), a bacterial phylum that was overrepresented at high soil fertility (r = 0.83, p < 0.001). In addition, the promotion of Proteobacteria was associated with soil bacterial communities featured by high richness (r = 0.63, p < 0.001) and reduced phylogenetic diversity (std MPD; r = −0.62, p < 0.001) (bubble size in figure 2). Results obtained with std MNTD were equivalent in all cases to those obtained with std MPD (electronic supplementary material, S2).
4. Discussion
During the last decade, evidence has accumulated to show that incorporating evolutionary relationships among community members helps to shed light on the underlying ecological processes of the diversity patterns. Here, we show that the repeatedly described parallel patterns of plant and soil microbial diversity may associate with opposing patterns of phylogenetic diversity. We argue these results in the framework of the modern co-existence theory [12–14].
In our facilitation-driven ecosystem, plots with richer plant communities were more phylogenetically diverse, that is, they were composed of more distantly related plant species. Facilitative plant–plant interactions increase the phylogenetic diversity of plant assemblies by promoting the coexistence of phylogenetically and functionally distant beneficiary species [21,22]. The contribution of facilitation to the phylogenetic diversity of plant communities has been thoroughly reviewed elsewhere [38] and previously described for this particular ecosystem [11]. We rather used this scenario as an ideal system to explore the diversity patterns of plant and soil microbial communities since scattered vegetation patches shape natural gradients of plant phylogenetic diversity, as we found to be the case in this study. It has been previously shown that the amount of phylogenetic diversity in plant communities significantly explains their productivity in terms of biomass [10]. This has been discussed as the result of complementarity effects since a phylogenetically diverse community is composed of functionally distinct members, which can be expected to better exploit the total available resources [10,15]. We observed that plant diversity significantly increased soil fertility, which suggests that diverse plant assemblies were more productive in terms of biomass production and organic matter inputs into the soil [11,24]. In this study, both plant richness and phylogenetic diversity significantly accounted for soil fertility measured as a combination of variables related to the amount of oxidizable substances, nutrients and moisture. Our results add up to the evidence showing that plant diversity helps maintain ecosystem functions, in our case, soil productivity [39].
The amelioration of soil fertility generated richer albeit less phylodiverse soil bacterial communities. That is to say, bacterial communities in more productive soils were composed of more species which shared closer phylogenetic relationships. This observation is congruent with the theoretical mechanism depicted in figure 1b, by which increased organic inputs at high levels of plant phylogenetic diversity might be more efficiently exploited by a few competitive bacterial clades with high relative fitness [12,13]. The close evolutionary relationship among strong bacterial competitors ends up reducing the phylogenetic diversity of the soil bacterial community through the exclusion of distantly related lineages [14]. In our study case, the opposing phylogenetic diversity gradients of plant and soil bacterial communities were mediated by high abundances of Proteobacteria, which occurred in fertile soils underneath phylogenetically diverse plant communities and generated phylogenetically poor bacterial communities. This was not unexpected as many Proteobacteria show high relative fitness under carbon-enriched conditions, and competitively exclude distantly related bacterial lineages both in the laboratory and in nature [17,18,25]. This phylum includes many taxa that can rapidly grow in response to pulses of both chemically labile and recalcitrant carbon compounds, an ability that makes them strong competitors in the typically carbon-limited soil environment [17]. Eventually, the dominance of phylogenetically clustered competitors that produce more per unit resource than others can explain that bacterial communities with low phylogenetic diversity are highly productive in terms of biomass production, decomposition rates or nutrient cycling [40,41]. This can generate the paradoxical situation that microbially driven ecosystem functions show a positive relationship with plant phylodiversity [11], but a negative relationship with soil bacterial phylodiversity [41].
Scenarios similar to that described in this study require that (i) the actual diversity of plant communities is responsible for the increase in soil fertility and (ii) heterotrophic bacterial communities become dominated by one (or a few) deeply branching bacterial lineage at high fertility levels, as happens for instance with Proteobacteria or Actinobacteria [17]. Although our results are based on a single phylogenetic diversity gradient, both aforementioned conditions are widespread (e.g. [18,42]). Still, other scenarios are also possible as the effect of plant communities on soils and soil microbes can be context-dependent [1,2,5]. As an illustration, the presence of clonal plants can reduce species diversity [43] while contributing large amounts of organic carbon into the soil via the intensive spread of their vegetative structures. In the opposite extreme, increments in diversity in Cactaceae-dominated communities can lead to insignificant changes in soil fertility due to an extremely limited supply of organic matter [44]. Diversity patterns different to those described here could be also present in ecosystems dominated by legacy effects, i.e. abiotic or biotic changes that persist once the species that caused them disappeared [45], which have been shown to operate both in plant and soil bacterial communities [2,46]. Beyond the universality of the diversity patterns here described, our findings illustrate how incorporating the evolutionary history to the metrics of diversity can elucidate community assembly processes. Our observations, together with previous research [9,10,47], underline the need to cover the multiple facets of biodiversity when addressing the structure of ecological communities and the functioning of ecosystems.
5. Conclusion
Our results are consistent with the assumption that changes in soil fertility, in this case controlled by the plant communities, determine the biotic interactions among bacteria particularly by promoting the dominance of a whole lineage with high relative fitness under carbon-enriched conditions. This process drastically increases the relatedness of coexisting bacteria, and hence leads to opposing patterns of plant and soil bacterial phylogenetic diversity. These results are in line with the phylogenetic coexistence patterns mediated by relative fitness differences as developed in the modern coexistence theory [12], and should prompt future research to understand the biotic mechanisms that tangle the intricate linkages among trophic levels.
Supplementary Material
Authors' contributions
M.G. and J.A.N.C. collected field data and soil samples. All authors conceived and designed the study, and participated in data analysis. M.G. wrote the first draft of the manuscript and all authors made substantial contributions to the draft and gave final approval for publication.
Competing interests
We have no competing interests.
Funding
Financial support was provided by the Spanish Ministerio de Economía y Competitividad (R&D Project CGL2014-58333-P), and Fundación BBVA (project Mintegra; I Convocatoria de ayudas de la fundación BBVA a proyectos de investigación). M.G. acknowledges support by the Programa Ramón y Cajal (Ministerio de Economía y Competitividad).
References
- 1.Wardle DA, Bardgett RD, Klironomos JN, Setälä H, van der Putten WH, Wall DH. 2004. Ecological linkages between aboveground and belowground biota. Science 304, 1629–1633. ( 10.1126/science.1094875) [DOI] [PubMed] [Google Scholar]
- 2.van der Putten WH, et al. 2013. Plant–soil feedbacks: the past, the present and future challenges. J. Ecol. 101, 265–276. ( 10.1111/1365-2745.12054) [DOI] [Google Scholar]
- 3.Balvanera P, Pfisterer AB, Buchmann N, He J-S, Nakashizuka T, Raffaelli D, Schmid B. 2006. Quantifying the evidence for biodiversity effects on ecosystem functioning and services. Ecol. Lett. 9, 1146–1156. ( 10.1111/j.1461-0248.2006.00963.x) [DOI] [PubMed] [Google Scholar]
- 4.Prober SM, et al. 2015. Plant diversity predicts beta but not alpha diversity of soil microbes across grasslands worldwide. Ecol. Lett. 18, 85–95. ( 10.1111/ele.12381) [DOI] [PubMed] [Google Scholar]
- 5.Tedersoo L, et al. 2015. Tree diversity and species identity effects on soil fungi, protists and animals are context dependent. ISME J. 10, 346–362. ( 10.1038/ismej.2015.116) [DOI] [PMC free article] [PubMed] [Google Scholar]
- 6.Mouquet N, et al. 2012. Ecophylogenetics: advances and perspectives. Biol. Rev. 87, 769–785. ( 10.1111/j.1469-185X.2012.00224.x) [DOI] [PubMed] [Google Scholar]
- 7.Blomberg SP, Garland T Jr, Ives AR. 2003. Testing for phylogenetic signal in comparative data: behavioral traits are more labile. Evolution 57, 717–745. ( 10.1111/j.0014-3820.2003.tb00285.x) [DOI] [PubMed] [Google Scholar]
- 8.Goberna M, Verdú M. In press. Predicting microbial traits with phylogenies. ISME J. ( 10.1038/ismej.2015.171) [DOI] [PMC free article] [PubMed] [Google Scholar]
- 9.Webb CO, Ackerley DD, McPeek M, Donoghue M. 2002. Phylogenies and community ecology. Annu. Rev. Ecol. Syst. 33, 475–505. ( 10.1146/annurev.ecolsys.33.010802.150448) [DOI] [Google Scholar]
- 10.Cadotte MW, Cardinale BJ, Oakley TH. 2008. Evolutionary history and the effect of biodiversity on plant productivity. Proc. Natl Acad. Sci. USA 105, 17 012–17 017. ( 10.1073/pnas.0805962105) [DOI] [PMC free article] [PubMed] [Google Scholar]
- 11.Navarro-Cano JA, Goberna M, Valiente-Banuet A, Montesinos-Navarro A, García C, Verdú M. 2014. Plant phylodiversity enhances soil microbial productivity in facilitation-driven ecosystems. Oecologia 174, 909–920. ( 10.1007/s00442-013-2822-5) [DOI] [PubMed] [Google Scholar]
- 12.HilleRisLambers J, Adler PB, Harpole WS, Levine MS, Mayfield MM. 2012. Rethinking community assembly through the lens of coexistence theory. Annu. Rev. Ecol. Evol. Syst. 43, 227–248. ( 10.1146/annurev-ecolsys-110411-160411) [DOI] [Google Scholar]
- 13.Chesson P. 2000. Mechanisms of maintenance of species diversity. Annu. Rev. Ecol. Syst. 31, 343–366. ( 10.1146/annurev.ecolsys.31.1.343) [DOI] [Google Scholar]
- 14.Mayfield MM, Levine JM. 2010. Opposing effects of competitive exclusion on the phylogenetic structure of the communities. Ecol. Lett. 13, 1085–1093. ( 10.1111/j.1461-0248.2010.01509.x) [DOI] [PubMed] [Google Scholar]
- 15.Hooper DU, et al. 2005. Effects of biodiversity on ecosystem functioning: a consensus of current knowledge. Ecol. Monogr. 75, 3–35. ( 10.1890/04-0922) [DOI] [Google Scholar]
- 16.Griffiths BS et al. 2001. An examination of the biodiversity–ecosystem functioning relationship in arable soil microbial communities. Soil Biol. Biochem. 33, 1713–1722. ( 10.1016/S0038-0717(01)00094-3) [DOI] [Google Scholar]
- 17.Goldfarb KC, Karaoz U, Hanson CA, Santee CA, Bradford MA, Treseder KK, Wallenstein MD, Brodie EL. 2011. Differential growth responses of soil bacterial taxa to carbon substrates of varying chemical recalcitrance. Front. Microbio. 2, 94 ( 10.3389/fmicb.2011.00094) [DOI] [PMC free article] [PubMed] [Google Scholar]
- 18.Goberna M, García C, Verdú M. 2014. A role for biotic filtering in driving phylogenetic clustering in soil bacterial communities. Glob. Ecol. Biogeogr. 23, 1346–1355. ( 10.1111/geb.12227) [DOI] [Google Scholar]
- 19.Aguiar MR, Sala OE. 1999. Patch structure, dynamics and implications for the functioning of arid ecosystems. Trends Ecol. Evol. 14, 273–277. ( 10.1016/S0169-5347(99)01612-2) [DOI] [PubMed] [Google Scholar]
- 20.Brooker RW, et al. 2008. Facilitation in plant communities: the past, the present and the future. J. Ecol. 96, 18–34. ( 10.1111/j.1365-2745.2007.01295.x) [DOI] [Google Scholar]
- 21.Valiente-Banuet A, Verdú M. 2007. Facilitation can increase the phylogenetic diversity of plant communities. Ecol. Lett. 10, 1029–1036. ( 10.1111/j.1461-0248.2007.01100.x) [DOI] [PubMed] [Google Scholar]
- 22.Castillo JP, Verdú M, Valiente-Banuet A. 2010. Neighborhood phylodiversity affects plant performance. Ecology 91, 3656–3663. ( 10.1890/10-0720.1) [DOI] [PubMed] [Google Scholar]
- 23.Goberna M, Pascual JA, García C, Sánchez J. 2007. Do plant clumps constitute microbial hotspots in semiarid Mediterranean patchy landscapes? Soil Biol. Biochem. 39, 1047–1054. ( 10.1016/j.soilbio.2006.11.015) [DOI] [Google Scholar]
- 24.Navarro-Cano JA, Verdú M, García C, Goberna M. 2015. What shrubs can do for barren soils: rapid productivity shifts associated with a 40 year ontogenetic gradient. Plant Soil. 388, 197–209. ( 10.1007/s11104-014-2323-2) [DOI] [Google Scholar]
- 25.Goberna M, Navarro JA, Valiente-Banuet A, García C, Verdú M. 2014. Abiotic stress tolerance and competition related traits underlie phylogenetic clustering in soil bacterial communities. Ecol. Lett. 17, 1191–1201. ( 10.1111/ele.12341) [DOI] [PubMed] [Google Scholar]
- 26.Kembel SW, Cowan PD, Helmus MR, Cornwell WK, Morlon H, Ackerly DD, Blomberg SP, Webb CO. 2010. Picante: R tools for integrating phylogenies and ecology. Bioinformatics 26, 1463–1464. ( 10.1093/bioinformatics/btq166) [DOI] [PubMed] [Google Scholar]
- 27.R Core Team. 2015. R: a language and environment for statistical computing. Vienna, Austria: R Foundation for Statistical Computing. [Google Scholar]
- 28.Webb CO, Ackerly DD, Kembel SW. 2008. Phylocom: software for the analysis of phylogenetic community structure and trait evolution. Bioinformatics 24, 2098–2100. ( 10.1093/bioinformatics/btn358) [DOI] [PubMed] [Google Scholar]
- 29.The Angiosperm Phylogeny Group. 2009. An update of the Angiosperm Phylogeny Group classification for the orders and families of flowering plants: APG III. Bot. J. Linn. Soc. 161, 105–121. ( 10.1111/j.1095-8339.2009.00996.x) [DOI] [Google Scholar]
- 30.Drummond AJ, Rambaut A. 2007. BEAST: Bayesian evolutionary analysis by sampling trees. BMC Evol. Biol. 7, 214 ( 10.1186/1471-2148-7-214) [DOI] [PMC free article] [PubMed] [Google Scholar]
- 31.Kuhn TS, Mooers AØ, Thomas GH. 2011. A simple polytomy resolver for dated phylogenies. Methods Ecol. Evol. 2, 427–436. ( 10.1111/j.2041-210X.2011.00103.x) [DOI] [Google Scholar]
- 32.Stamatakis A. 2006. RAxML-VI-HPC: maximum likelihood-based phylogenetic analyses with thousands of taxa and mixed models. Bioinformatics 22, 2688–2690. ( 10.1093/bioinformatics/btl446) [DOI] [PubMed] [Google Scholar]
- 33.Quast C, Pruesse E, Yilmaz P, Gerken J, Schweer T, Yarza P, Peplies J, Glöckner FO. 2013. The SILVA ribosomal RNA gene database project: improved data processing and web-based tools. Nucl. Acids Res. 41, D590–D596. ( 10.1093/nar/gks1219) [DOI] [PMC free article] [PubMed] [Google Scholar]
- 34.Dormann CF, Gruber B, Fruend J. 2008. Introducing the bipartite package: analysing Ecological Networks. R news 8/2: 8–11.
- 35.Rodríguez-Gironés MA, Santamaría L. 2010. How foraging behaviour and resource partitioning can drive the evolution of flowers and the structure of pollination networks. Open Ecol. J. 3, 1–11. [Google Scholar]
- 36.Fox J, Nie Z, Byrnes J. 2014. sem: Structural equation models. R package version 3.1-5.
- 37.Mueller R, Hancock G. 2008. Best practices in structural equation modeling. In Best practices in quantitative methods. (ed. Osborne J.), pp. 488–509. Thousand Oaks, CA: SAGE Publications, Inc. [Google Scholar]
- 38.Valiente-Banuet A, Verdú M. 2013. Plant facilitation and phylogenetics. Annu. Rev. Ecol. Evol. Syst. 44, 251–25.20. ( 10.1146/annurev-ecolsys-110512-135855) [DOI] [Google Scholar]
- 39.Isbell F, et al. 2011. High plant diversity is needed to maintain ecosystem services. Nature 477, 199–202. ( 10.1038/nature10282) [DOI] [PubMed] [Google Scholar]
- 40.Severin I, Östman O, Lindström ES. 2013. Variable effects of dispersal on productivity of bacterial communities due to changes in functional trait composition. PLoS ONE 8, e80825 ( 10.1371/journal.pone.0080825) [DOI] [PMC free article] [PubMed] [Google Scholar]
- 41.Pérez-Valera E, Goberna M, Verdú M. 2015. Phylogenetic structure of soil bacterial communities predicts ecosystem functioning. FEMS Microbiol. Ecol. 91, fiv031. ( 10.1093/femsec/fiv031) [DOI] [PubMed] [Google Scholar]
- 42.Maestre FT, et al. 2012. Plant species richness and ecosystem multifunctionality in global drylands. Science 335, 214–217. ( 10.1126/science.1215442) [DOI] [PMC free article] [PubMed] [Google Scholar]
- 43.Eilts JA, Mittelbach GG, Reynolds HL, Gross KL. 2011. Resource heterogeneity, soil fertility, and species diversity: effects of clonal species on plant communities. Am. Nat. 177, 574–588. ( 10.1086/659633) [DOI] [PubMed] [Google Scholar]
- 44.Sortibrán L, Verdú M, Valiente-Banuet A. 2014. Nurses experience reciprocal fitness benefits from their distantly related facilitated plants. Perspect. Plant Ecol. Evol. 16, 228–235. ( 10.1016/j.ppees.2014.07.001) [DOI] [Google Scholar]
- 45.Cuddington K. 2012. Legacy effects: the persistent impact of ecological interactions. Biol. Theory 6, 203–210. ( 10.1007/s13752-012-0027-5) [DOI] [Google Scholar]
- 46.Ge Y, He J-Z, Zhu Y-G, Zhang J-B, Xu Z, Zhang L-M, Zheng Y-M. 2008. Differences in soil bacterial diversity: driven by contemporary disturbances or historical contingencies? ISME J. 2, 254–264. ( 10.1038/ismej.2008.2) [DOI] [PubMed] [Google Scholar]
- 47.Bässler C, Cadotte MW, Beudert B, Heibl C, Blaschke M, Bradtka JH, Langbehn T, Werth S, Müller J. In press. Contrasting patterns of lichen functional diversity and species richness across an elevational gradient. Ecography 38 ( 10.1111/ecog.01789) [DOI] [Google Scholar]
Associated Data
This section collects any data citations, data availability statements, or supplementary materials included in this article.