

Keywords: nerve regeneration, cerebral ischemia/reperfusion injury, let-7, mitogen-activated protein kinase phosphatase-1, apoptosis, microglia, inflammation, mitogen-activated protein kinase, neurons, c-Jun N-terminal kinase, gene knockdown, brain injury, neural regeneration
Abstract
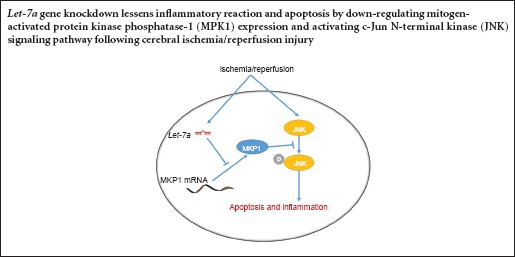
The microRNA (miRNA) let-7 was one of the first miRNAs to be discovered, and is highly conserved and widely expressed among species. let-7 expression increases in brain tissue after cerebral ischemia/reperfusion injury; however, no studies have reported let-7 effects on nerve injury after cerebral ischemia/reperfusion injury. To investigate the effects of let-7 gene knockdown on cerebral ischemia/reperfusion injury, we established a rat model of cerebral ischemia/reperfusion injury. Quantitative reverse transcription-polymerase chain reaction demonstrated that 12 hours after cerebral ischemia/reperfusion injury, let-7 expression was up-regulated, peaked at 24 hours, and was still higher than that in control rats after 72 hours. Let-7 gene knockdown in rats suppressed microglial activation and inflammatory factor release, reduced neuronal apoptosis and infarct volume in brain tissue after cerebral ischemia/reperfusion injury. Western blot assays and luciferase assays revealed that mitogen-activated protein kinase phosphatase-1 (MKP1) is a direct target of let-7. Let-7 enhanced phosphorylated p38 mitogen-activated protein kinase (MAPK) and c-Jun N-terminal kinase (JNK) expression by down-regulating MKP1. These findings suggest that knockdown of let-7 inhibited the activation of p38 MAPK and JNK signaling pathways by up-regulating MKP1 expression, reduced apoptosis and the inflammatory reaction, and exerted a neuroprotective effect following cerebral ischemia/reperfusion injury.
Introduction
Following ischemia, further tissue damage and dysfunction may be caused by the reperfusion of blood flow in the ischemic area, which is known as cerebral ischemia/reperfusion (I/R) injury (Wong and Crack, 2008; Kasdorf and Perlman, 2013). The precise mechanism of I/R injury remains unclear. I/R injury is possibly associated with toxins produced by oxygen free radicals, destruction of mitochondrial structure and function due to calcium overload, the inflammatory reaction, energy metabolism disorders resulting from a deficiency of high-energy phosphate compounds, and apoptosis (White et al., 2000). The inflammatory reaction and apoptosis play an important role in cerebral I/R injury, and are the main factors inducing nerve cell injury after I/R (Zheng et al., 2003; Tuttolomondo et al., 2009). Therefore, inhibition of the inflammatory reaction and apoptosis after I/R is very important.
microRNAs (miRNAs) are small non-coding RNA molecules of 18–25 nucleotides found in drosophila, nematode, some viruses, plants and vertebrates (Lee et al., 2007). miRNAs are highly conserved, do not have an open reading frame, and exhibit tissue- and temporal-specific expression (Berezikov, 2011). Most miRNA genes are located in the introns of protein-encoding genes. Mature miRNAs regulate translation of mRNAs (Suzuki and Miyazono, 2011) and play regulatory roles in many processes, such as embryonic development, cell differentiation, tissue development, apoptosis, cell death, tumor formation and virus replication (Chen and Meister, 2005; Pothof and van Gent, 2011). With the development of ischemic stroke studies, investigation of the role of miRNAs has increased (Di et al., 2014). Various miRNAs are expressed at high or low levels in the peripheral blood of stroke patients and normal persons (Tan et al., 2009; Wang et al., 2010). However, other studies show that various miRNAs are up-regulated or down-regulated in brain tissue of murine cerebral I/R injury models (Jeyaseelan et al., 2008; Liu et al., 2010, 2011).
The let-7a family consists of 11 members, including let-7a, which was the first miRNA to be discovered, and is highly conserved and widely expressed among species. Let-7a expression is up-regulated in brain tissue following cerebral I/R (Jeyaseelan et al., 2008; Dharap et al., 2009), indicating that let-7a is associated with pathophysiological process of cerebral I/R. However, the effects of let-7a on nerve injury following I/R are unknown. This study investigated the effects of let-7a knockdown on nerve cell apoptosis and inflammation using PC12 cells transfected with a let-7a shRNA slow virus vector and a rat let-7a-knockdown cerebral I/R injury model. We also explored the possible mechanism of let-7a action.
Materials and Methods
Animals
Twenty-four clean healthy male Sprague-Dawley rats aged 8–10 weeks and weighing 220–250 g were supplied by the Animal Experimental Center of Jilin University of China (animal license No. SCXK(Ji)2003-0002). Rats were housed in individual cages at 21 ± 2°C and 30–35% humidity with a 12-hour light/dark cycle, and allowed free access to food and water. No difference in exposure factors was detected among groups. All surgery was performed under anesthesia, and all efforts were made to minimize the pain and distress of animals. All animal experiments were carried out in accordance with the United States National Institutes of Health Guide for the Care and Use of Laboratory Animals (NIH Publication No. 85-23, revised 1986). The experiment was approved by the Animal Ethics Committee of Jilin University of China.
In vitro experiments
Cell culture and group assignment
Wild-type PC12 cells and PC12 cells over-expressing mitogen-activated protein kinase phosphatase-1 (MKP1) were purchased from Shenbang Technology Co., Changchun, China. PC12 cells were seeded in Dulbecco's modified Eagle's medium containing 10% fetal bovine serum (Gibco, Carlsbad, CA, USA) and maintained in a 37°C incubator (Thermo Fisher, Grand Island, NY, USA) with a 5% CO2 atmosphere. The medium was replaced every 4 days.
To detect the effects of let-7a on MKP1 expression in PC12 cells, cells were assigned to control, mimic, mimic-NC (negative control), inhibitor and inhibitor-NC groups. The control group received no treatment. Mimic, mimic-NC, inhibitor and inhibitor-NC groups were transfected with let-7a mimic, let-7a mimic negative control, let-7a inhibitor and let-7a inhibitor negative control, respectively.
To detect the effects of let-7a and MKP1 on hypoxia-induced PC12 cell apoptosis, wild-type PC12 cells were divided into control, agomir-NC and let-7a groups. PC12 cells over-expressing MKP1 were divided into let-7a + MKP1, control (no treatment), agomir-NC (transfection with let-7a mimic negative control), let-7a and let-7a + MKP1 groups (transfection with let-7a mimic). All groups were incubated in the presence of 200 μM CoCl2 (Sigma-Aldrich, St. Louis, MO, USA) for 24 hours, and were then assessed for apoptosis.
miRNA transfection
PC12 cells at 1 × 10⁵/mL were seeded in a 24-well plate and incubated with 1640 complete medium (Gibco) containing 10% fetal bovine serum for 24 hours. At 80% confluence, cells were transfected with let-7a mimic or inhibitor and its negative control (Ribo Guangzhou, China), all at 20 nM (n = 6), using Lipofectamine 2000 (Invitrogen, Carlsbad, CA, USA). After transfection cells were cultured for 48 hours.
Luciferase assay
Potential let-7a targets were identified using microRNA.org (http://microRNA.org). A 7-mer sequence in the 3′-untranslated region (3′-UTR) of MKP1 mRNA matched with let-7a. The MKP1 mRNA 3′-UTR containing the target site (MKP1 3′-UTR-wt) or a mutated site (MKP1 3′-UTR-mut) were inserted into a luciferase reporter system. Subsequently, let-7a and either empty luciferase vector or MKP1 3′-UTR-wt or MKP1 3′-UTR-mut plasmids were co-transfected into HEK-293 cells. Thirty-six hours after transfection, the fluorescence intensity of cells was measured using the Dual-Luciferase Reporter Assay System (Promega, Madison, WI, USA).
Measurement of cell apoptosis by flow cytometry
Twenty-four hours after transfection, cells were collected, washed, and prepared into a single cell suspension. Cells were diluted with phosphate buffered saline (PBS) to a final concentration of 1 × 10⁶ cells/mL. Cells samples were divided in two and incubated with 10 μL Annexin V (BD, Franklin Lakes, NJ, USA) at 4°C in the dark for 30 minutes and in 1 μL of propidium iodide (BD, Franklin Lakes, NJ, USA) at room temperature in the dark for 15 minutes. Samples were washed with ice-cold PBS and centrifuged at 1,500 r/min and 4°C for 5 minutes. After resuspending in PBS, cells were analyzed by flow cytometry (BD). The percentage of Annexin V-positive cells relative to the total cell count was considered the apoptotic rate.
In vivo experiments
Establishment of cerebral I/R injury models
Rats were assigned to sham, control, anti-let-7a, and green fluorescent protein (GFP) groups (n = 6). Rats in the control, anti-let-7a, and GFP groups were injected with physiological saline, AAV-9 plasmid expressing anti-let-7a and empty control plasmid (GFP plasmid; synthesized by Shanghai GenePharma Co., Shanghai, China) via caudal vein, respectively. Rat models of cerebral I/R injury were established and assessed according to a previous method (Liu et al., 2015a). Briefly, rats were subcutaneously anesthetized with ketamine (100 mg/mL, 100 mg/kg), xylazine (20 mg/mL, 2.5 mg/kg) and acepromazine (2.5 mg/mL, 2.5 mg/kg; Jinan Wanxingda Chemical Co., Jinan, China). Rats were held on the operating table in the supine position. After skin sterilization, a median incision was made in the neck and the left common carotid artery, external carotid artery and internal carotid artery were separated. A small cut was made at the proximal end of the common carotid artery with eye scissors. A 0.26 mm diameter fishing line with a blunt end was inserted until it reached the origin of the middle cerebral artery through the internal carotid artery. This procedure blocked blood flow in the left middle cerebral artery. After 2 hours the fishing line was removed, the external carotid artery was ligated, and the incision was sutured. After regaining consciousness, rats were housed at 20–25°C and allowed free access to food and water. In the sham group, all steps were the same as in the reperfusion model except that the fishing line did not reach the middle cerebral artery or block blood flow.
2,3,5-Triphenyltetrazolium chloride (TTC) staining
One day after model establishment, all rats were anesthetized and decapitated. The brain tissue was frozen at –20°C for 20 minutes, and sliced into 2-mm-thick sections. The first section was cut at the midpoint of the connection of the anterior pole and the optic chiasma. The second section was cut at the optic chiasma. The third section was cut at the funnel handle. The fourth section was cut between the funnel handle and the posterior lobe. Sections were placed in 2% TTC solution in a 37°C incubator for 15–30 minutes. Normal brain tissue stained red, and infarct area remained white. Infarct volume was calculated using ImageTool (San Antonio, TX, USA).
Enzyme linked immunosorbent assay
One day after model establishment, all rats were anesthetized and decapitated. Fifty milligrams of brain tissue in 8× ice-cold bicarbonate buffer (100 mM Na2CO3, 50 mM NaCl pH 11.5) and protease inhibitor was homogenized in a homogenizer for 20 seconds. The mixture was centrifuged at 12,000 × g for 45 minutes. Levels of tumor necrosis factor alpha (TNF-α) and interleukin-6 (IL-6) in the supernatant were determined in accordance with the instructions of TNF-α and IL-6 ELISA kits (Abcam, Hongkong, China). TNF-α and IL-6 levels per 1 mg of brain tissue were calculated according to a standard curve.
Immunohistochemical staining
One day after model establishment, all rats were anesthetized and perfused with ice-cold PBS via the heart. Brain tissue was fixed with 4% paraformaldehyde at room temperature for 24 hours, embedded in paraffin, and sliced into sections. Sections were dewaxed, hydrated, washed for 3 minutes in PBS three times, treated with 0.1% Triton for 10 minutes and washed for 3 minutes in PBS three times. Sections were then blocked with 10% fetal bovine serum for 1 hour, incubated with rabbit anti-Iba1, p-JNK or p-p38 (p-p38 mitogen-activated protein kinase, MAPK) polyclonal antibodies (1:200; Abcam, San Francisco, CA, USA) at 4°C overnight. Samples were then placed at room temperature for 15 minutes, washed for 3 minutes in PBS three times, and then incubated with horseradish peroxidase-labeled goat anti-rabbit IgG (1:200; Abcam) at room temperature in the dark for 2 hours. Sections were then visualized with 3,3′-diaminobenzidine, counter stained with hematoxylin, washed with running water, and differentiated with 1% ethanol hydrochloride. The samples were observed and photographed with a light microscope (Olympus, Tokyo, Japan). Results are expressed as the proportion of positive cells relative to all cells.
TUNEL assay
One day after model establishment, apoptosis was detected using a TUNEL assay kit (Boster, Wuhan, China). TUNEL-positive cells and normal cells in each group were counted using a light microscope at 200× magnification (Olympus, Tokyo, Japan).
In vivo and in vitro procedures
qRT-PCR
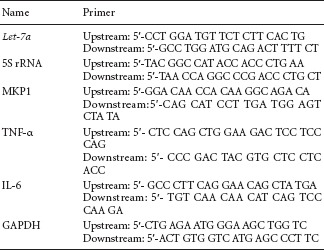
One day after model establishment, total RNA was extracted from brain tissue of each group using the Trizol method and TNF-α and IL-6 mRNAs were detected. At 3, 12, 24 and 48 hours after model establishment, total RNA was extracted in each group, and let-7a and MKP1 mRNAs were detected. To determine the effects of let-7a on MKP1 mRNA levels in PC12 cells, cells were collected after transfection with miRNAs, and total RNA was extracted using the Trizol method. cDNA was synthesized using EasyScript First-Strand cDNA Synthesis SuperMix. 2.5 μL of cDNA and 1 μL of specific primer were added to TransStart™ SYBR Green qPCR Supermix. qPCR was conducted with a ABI 7500 PCR system (ABI, Bedford, MA, USA). 5S ribosomal RNA served as an internal reference for miRNA, and glyceraldehyde phosphate dehydrogenase (GAPDH) mRNA was used as the internal reference for mRNA. The concentrations of products were quantified and results are expressed as 2–ΔΔCt (Song et al., 2015b).
Primer information is as follows:
Western blot assay
Total protein was extracted from cells or brain tissue using a radio-immune precipitation assay (Cell Signaling Technology, Boston, MA, USA). Total protein concentrations were measured using the bicinchoninic acid assay. Twenty micrograms of total protein of each sample were mixed with loading buffer. After denaturation in boiling water for 5 minutes, each sample underwent sodium dodecyl sulphate-polyacrylamide gel electrophoresis on 10% discontinuous gels (110 V; 90 minutes), and was then wet transferred onto a membrane (200 mA; 60–90 minutes). Membranes were blocked with skimmed milk for 2 hours, washed six times in Tris-buffered saline containing Tween-20 (10 minutes each wash), and then incubated with rabbit anti-rat caspase 3, MKP1, p-p38 MAPK, p-JNK or GAPDH IgG polyclonal antibodies (1:1,000; Abcam, Cambridge, MA, USA) at 4°C overnight. On the next day, membranes were rinsed six times in Tris-buffered saline containing Tween-20 (10 minutes each wash), incubated with horseradish peroxidase-labeled goat anti-rabbit polyclonal antibody (1:5,000; Abcam) at room temperature for 2 hours, followed by enhanced chemiluminescence. The ratio of the target protein gray value to that of GAPDH was calculated.
Statistical analysis
Statistical analyses were performed using SPSS 18.0 software (SPSS, Chicago, IL, USA). Measurement data are expressed as the mean ± SD. Student's t-test was used to compare the difference between the two groups. One-way analysis of variance and the least significant difference test were used among groups. Inspection level was set to 0.05.
Results
Inhibiting let-7a reduced levels of inflammatory reaction markers after cerebral I/R injury
Immunohistochemical staining demonstrated a few Iba1-immunoreactive cells in the infarct area in the sham group. The number of Iba1-immunoreactive cells was significantly less in the anti-let-7a group than in the GFP group (P < 0.05). Moreover, the number of p-p38 MAPK- and p-JNK-immunoreactive cells was significantly less in the anti-let-7a group than in the GFP group (P < 0.05; Figure 1A, B).
Figure 1.

Effects of inhibiting let-7a on inflammatory reaction markers following cerebral ischemia/reperfusion injury.
(A) Immunohistochemical staining of Iba1, p-p38MAPK and p-JNK in the infarct area in each group (× 400). Sham group: a few Iba1-positive cells are present in the infarct area (arrows). The number of Iba1-positive cells (arrows) was significantly less in the anti-let-7a group than in the GFP group. Moreover, the number of p-p38MAPK- and p-JNK-positive cells (arrows) was significantly less in the anti-let-7a group than in the GFP group. (B) The percentage of Iba1-, p-p38MAPK- and p-JNK-immunoreactive cells relative to all cells was lower in the anti-let-7a group than in the control and GFP groups (*P < 0.05, **P < 0.01). (C) Levels and mRNA expressions of TNF-α and IL-6. *P < 0.05, **P < 0.01, vs. control and GFP groups (mean ± SD, n = 6, one-way analysis of variance and the least significant difference test). GFP: Green fluorescent protein; MAPK: mitogen-activated protein kinase; JNK: c-Jun N-terminal kinase; IL-6: interleukin-6; TNF: tumor necrosis factor.
ELISA results showed that TNF-α and IL-6 levels were lower in the anti-let-7a group than in the control and GFP groups (P < 0.05). qRT-PCR results demonstrated that TNF-α and IL-6 mRNA levels were significantly lower in the anti-let-7a group than in the control and GFP groups (P < 0.01; Figure 1C).
Inhibiting let-7a reduced apoptosis and neurological deficits after cerebral I/R injury
TTC staining revealed that 24 hours following I/R, no color was found in the sham group. The infarct area was white in the control group. The infarct range was identical between GFP and control groups, and no significant difference in infarct volume was detectable between GFP and control groups (P > 0.05). Infarct volume was smaller in the anti-let-7a group compared with the GFP group (Figure 2A).
Figure 2.
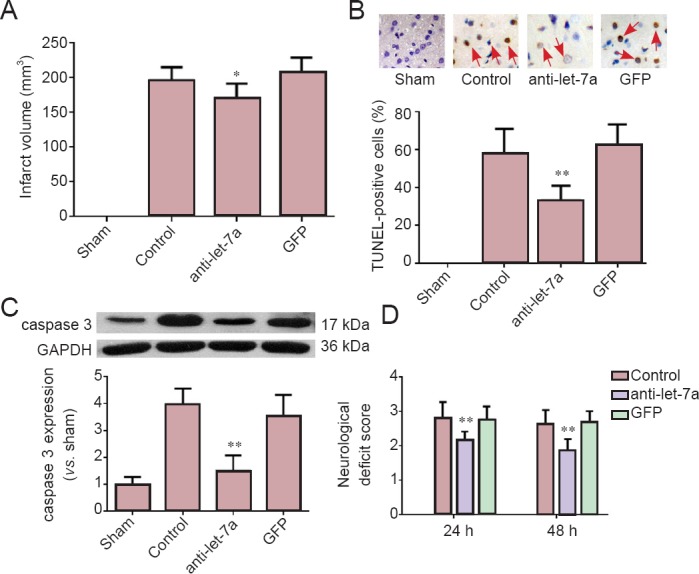
Effects of inhibiting let-7a on apoptosis and nerve injury following cerebral ischemia/reperfusion injury.
(A) 2,3,5-Triphenyltetrazolium chloride staining: infarct volume was significantly smaller in the anti-let-7a group than in the control and GFP groups (*P < 0.05). (B) TUNEL staining: brown TUNEL-positive cells (arrows) were round or elliptical; pyknosis was seen and nuclear fragmentation was occasionally seen. At 200× magnification, the percentage of TUNEL-positive cells was lower in the anti-let-7a group than in the control and GFP groups. No significant difference in the number of TUNEL-positive cells was detectable between the control and GFP groups. (C) Western blot assay: caspase 3 protein levels were significantly lower in the anti-let-7a group than in the control and GFP groups (**P < 0.01). (D) Neurological deficit scores were lower in the anti-let-7a group than in the control and GFP groups (**P < 0.01). Data are expressed as the mean ± SD, n = 6; one-way analysis of variance and the least significant difference test were used. GAPDH: Glyceraldehyde phosphate dehydrogenase; TUNEL: transferase-mediated deoxyuridine triphosphate-biotin nick end labeling; GFP: green fluorescent protein; h: hours.
TUNEL staining revealed no TUNEL-positive cells in the sham group. A large number of TUNEL-positive cells were observed in the cortex, hippocampus and basal ganglia in the control, anti-let-7a and GFP groups. The percentage of TUNEL-positive cells was significantly lower in the anti-let-7a group than in the GFP group (P < 0.05; Figure 2B). Western blot assays showed that caspase 3 expression was significantly lower in the anti-let-7a group compared with the GFP group (P < 0.05; Figure 2C). Neurological deficit scores were lower in the anti-let-7a group than in the control and GFP groups at various time points (P < 0.05; Figure 2D).
Down-regulation of MKP1 levels in PC12 cells by let-7a binding to the 3′-UTR of MKP1 mRNA
Western blot assays demonstrated that the let-7a mimic could significantly reduce MKP1 levels in PC12 cells (P < 0.05), and that the let-7a inhibitor could significantly increase MKP1 levels in PC12 cells (P < 0.05). qRT-PCR showed that no significant difference in MKP1 mRNA levels was detectable among groups (Figure 3A).
Figure 3.

miR-let-7a effects on MKP1 expression in PC12 cells and in neurons after cerebral I/R injury.
(A) Western blot assay: let-7a mimic diminished MKP1 protein levels in PC12 cells, but let-7a inhibitor increased MKP1 protein levels in PC12 cells. However, let-7a mimic and let-7a inhibitor did not impact MKP1 mRNA levels. (B) After transfection, the fluorescence intensity was apparently lower in the MKP1 3′-UTR-wt group than in its negative control group (miR-con), but no significant difference in fluorescence intensity was detected between the MKP1 3′-UTR-mut group or the empty vector group and its negative control group. (C) let-7a expression was up-regulated after I/R, reached a peak at 24 hours (h), and then gradually diminished. MKP1 expression was increased at 12 hours after I/R, and was then sequentially decreased at 24, 48 and 72 h. Data are expressed as the mean ± SD, n = 6. (B, C) # P < 0.01, vs. mimic-NC; *P < 0.01, vs. 0 h (one-way analysis of variance and the least significant difference test). MKP1: Mitogen-activated protein kinase phosphatase-1; I/R: ischemia/reperfusion; GAPDH: glyceraldehyde phosphate dehydrogenase; NC: negative control; 3′-UTR: 3′-untranslated region.
To determine if the identified sequence down-regulates MKP1 mRNA translation following let-7a binding, let-7a and either empty luciferase vector or MKP1 3′-UTR-wt or MKP1 3′-UTR-mut plasmids were co-transfected into HEK-293 cells. The fluorescence intensity of cells was evidently lower in the MKP1 3′-UTR-wt group than in its negative control group (miR-con), but no significant difference in the fluorescence intensity was detected between the MKP1 3′-UTR-mut or empty vector groups and its negative control group (Figure 3B). These findings indicate that MKP1 mRNA translation could be regulated by the binding of let-7a to the MKP1 mRNA 3′-UTR.
In I/R rats, qRT-PCR demonstrated that let-7a mRNA levels were up-regulated after I/R, peaked at 24 hours, were then down-regulated but maintained at a high level at 72 hours (P < 0.01). MKP1 mRNA levels were up-regulated at 12 hours after I/R, and were then sequentially down-regulated at 24, 48 and 72 hours (Figure 3C).
MKP1 over-expression mitigated let-7a-mediated nerve cell apoptosis
TNF-α and IL-6 mRNA levels were noticeably higher in brain tissue of rats injected with MKP1 inhibitor compared with the control group. p-p38 MAPK and p-JNK levels were also higher in brain tissue of rats injected with MKP1 inhibitor compared with the control group. Apoptosis and the percentage of activated microglia were significantly higher in brain tissue of rats injected with MKP1 inhibitor compared with the control group (Figure 4A–C). These results confirm that MKP1 can suppress neuroinflammation and apoptosis after I/R.
Figure 4.

MKP1 has a neuroprotective effect and lessens the pro-apoptotic effect of let-7a.
(A, B) Inhibition of MKP1 reduced TNF-α and IL-6 release after cerebral ischemia/reperfusion injury (qRT-PCR, western blot assay), and promoted the activation of p38 MAPK and JNK signaling. (C) Inhibition of MKP1 increased nerve cell (arrows) apoptosis (top panel, TUNEL staining, × 200) and microglial (arrows) activation (bottom panel) after cerebral ischemia/reperfusion (immunohistochemical staining, × 400). *P < 0.01, **P < 0.05, vs. control group. (D) MKP1 over-expression relieved a pro-apoptotic effect of let-7a under CoCl2-induced hypoxia. #P < 0.01, vs. agomir-NC; &P < 0.01, vs. let-7a group. Data are expressed as the mean ± SD, n = 6; A, C, D: one-way analysis of variance and the least significant difference test; B: Student's t-test. TUNEL: Transferase-mediated deoxyuridine triphosphate-biotin nick end labeling; qRT-PCR: quantitative reverse transcription-polymerase chain reaction; MKP1: mitogen-activated protein kinase phosphatase-1; IL-6: interleukin-6; TNF: tumor necrosis factor; GAPDH: glyceraldehyde phosphate dehydrogenase; NC: negative control.
Let-7a significantly increased the apoptotic rate of PC12 cells under hypoxia. The apoptotic rate of PC12 cells transfected with MKP1 was decreased (Figure 4D). These findings verify that MKP1 is a downstream target of pro-apoptotic let-7a.
Discussion
qRT-PCR demonstrated that the expression of let-7a, rapidly increased in the brain tissue after I/R. Inhibiting let-7a could decrease microglial activation, inflammatory factor release and MAPK signaling pathway activation. Inhibiting let-7a also could mitigate nerve cell apoptosis, and exert neuroprotective effects against I/R. Moreover, MKP1 over-expression could lessen let-7a-induced nerve cell apoptosis.
Let-7a functions as a tumor suppressor and has an inhibitory effect on tumor growth and metastasis in lung, prostate and ovarian cancers. Let-7a can suppress the metastasis of breast cancer cells by targeting CC-chemokine receptor 7 (Kim et al., 2012; Liu et al., 2015b). Let-7a can also regulate immune and inflammatory responses (Chafin et al., 2013; Zhang et al., 2013).
Let-7a is strongly associated with nerve cell differentiation and some nervous system diseases. Many miRNAs, including let-7a, are highly expressed in the process of neural development in mice and humans (Sempere et al., 2004; Aranha et al., 2010) and let-7a can inhibit the differentiation of neural stem cells by targeting TLX (Song et al., 2015a). The present study confirmed that let-7a expression was increased at 7 hours and peaked at 24 hours after I/R, which is consistent with previous results. Exogenous inhibition of let-7a in rats can significantly decrease the number of Iba1-, p-p38MAPK- and p-JNK-positive cells in the infarct area, suggesting that let-7a knockdown inhibits microglial activation and the activation of the MAPK signaling pathway in neuronal cells. Previous studies have shown that let-7a is associated with microglial activation in vitro (Cho et al., 2015; Song and Lee, 2015). Our ELISA and qRT-PCR results confirmed that let-7a inhibition reduced the expression of TNF-α and IL-6 after I/R. These results indicate that inhibiting let-7a over-expression could mitigate neuroinflammation after I/R.
In addition to the inflammatory response of the nervous system, apoptosis is also an important factor in nerve injury after cerebral I/R (Nakka et al., 2008). Let-7a knockdown reduced the number of apoptotic cells in the infarct area, and diminished caspase 3 content in brain tissue, which suggested that let-7a knockdown could reduce nerve cell apoptosis after cerebral I/R. Let-7a, as a proapoptotic miRNA, promotes apoptosis under stress, but let-7a inhibition could protect cells against apoptosis. Neurological deficit scores and TTC staining demonstrated that let-7a knockdown significantly inhibited nerve injury after reperfusion.
To determine the precise mechanism of neuroinflammation and apoptosis, a potential binding site was identified at the 3′-UTR of MKP1 mRNA. MKP1 belongs to the MKP family and is a protein phosphatase with substrate specificity for proteins encoded by early response genes, is mainly distributed in the nucleus, and plays a key role in dephosphorylating MAPKs (Patterson et al., 2009; Caunt and Keyse, 2013). MKP1 is the most efficient MAPK phosphatase, and is a major factor in the negative regulation of ERK1/2, JNK1/2 and p38. Compared with ERK1/2, MKP1 has stronger inhibitory effects on p38 and JNK1/2; thus, MKP1 participates in the regulation of the inflammatory response and apoptosis (Kristiansen et al., 2010; Rastogi et al., 2013; Wang et al., 2014). MKP1 exerts apparent neuroprotective effects against cerebral ischemia (Koga et al., 2012; Liu et al., 2014). Our results also show that p38 MAPK and JNK signaling pathways were activated, and that neuroinflammation and apoptosis were increased after MKP1 inhibitor treatment. Western blot assays showed that let-7a down-regulated MKP1 in PC12 cells, and that let-7a inhibitor increased MKP1 levels. qRT-PCR showed that let-7a did not impact mRNA levels. Luciferase assays revealed that after transfection with let-7a mimic, fluorescence intensity was decreased in the MKP1 3′-UTR-wt group, but was not altered in the MKP1 3′-UTR-mut group. These results suggest that let-7a suppressed MKP1 expression by binding to the 3′-UTR of MKP1, and that this effect did not impact MKP1 mRNA levels.
CoCl2 is a chemical hypoxia-mimetic agent that can simulate hypoxic/ischemic conditions in a variety of cells and induce PC12 cell apoptosis (Lee et al., 2013; Guan et al., 2015). In this study, CoCl2 was used to create hypoxic conditions. let-7a could aggravate CoCl2-induced PC12 cell apoptosis, but the proapoptotic effect of let-7a was remarkably weakened after MKP1 over-expression. The above results suggest that MKP1 is a key regulator of let-7a-mediated apoptosis under hypoxia.
In conclusion, let-7a expression was increased after cerebral I/R. Inhibiting the up-regulated let-7a could lessen inflammation and apoptosis, thereby reducing nervous system injury. Proinflammatory and proapoptotic effects of let-7a are mediated via its target MKP1. This study furthers our understanding of the inflammatory reaction mechanism after cerebral I/R. Further study of these mechanisms has the potential to lead to targeted clinical therapy.
Footnotes
Funding: This study was supported by the National Natural Science Foundation of China, No. 81460193.
Conflicts of interest: None declared.
Plagiarism check: This paper was screened twice using Cross-Check to verify originality before publication.
Peer review: This paper was double-blinded and stringently reviewed by international expert reviewers.
Copyedited by Allen J, Robens J, Wang J, Qiu Y, Li CH, Song LP, Zhao M
References
- Aranha MM, Santos DM, Xavier JM, Low WC, Steer CJ, Sola S, Rodrigues CM. Apoptosis-associated microRNAs are modulated in mouse, rat and human neural differentiation. BMC Genomics. 2010;11:514. doi: 10.1186/1471-2164-11-514. [DOI] [PMC free article] [PubMed] [Google Scholar]
- Berezikov E. Evolution of microRNA diversity and regulation in animals. Nat Rev Genet. 2011;12:846–860. doi: 10.1038/nrg3079. [DOI] [PubMed] [Google Scholar]
- Caunt CJ, Keyse SM. Dual-specificity MAP kinase phosphatases (MKPs): shaping the outcome of MAP kinase signalling. FEBS J. 2013;280:489–504. doi: 10.1111/j.1742-4658.2012.08716.x. [DOI] [PMC free article] [PubMed] [Google Scholar]
- Chafin CB, Regna NL, Dai R, Caudell DL, Reilly CM. MicroRNA-let-7a expression is increased in the mesangial cells of NZB/W mice and increases IL-6 production in vitro. Autoimmunity. 2013;46:351–362. doi: 10.3109/08916934.2013.773976. [DOI] [PMC free article] [PubMed] [Google Scholar]
- Chen PY, Meister G. microRNA-guided posttranscriptional gene regulation. Biol Chem. 2005;386:1205–1218. doi: 10.1515/BC.2005.139. [DOI] [PubMed] [Google Scholar]
- Cho KJ, Song J, Oh Y, Lee JE. MicroRNA-let-7a regulates the function of microglia in inflammation. Mol Cell Neurosci. 2015;68:167–76. doi: 10.1016/j.mcn.2015.07.004. [DOI] [PubMed] [Google Scholar]
- Dharap A, Bowen K, Place R, Li LC, Vemuganti R. Transient focal ischemia induces extensive temporal changes in rat cerebral microRNAome. J Cereb Blood Flow Metab. 2009;29:675–687. doi: 10.1038/jcbfm.2008.157. [DOI] [PMC free article] [PubMed] [Google Scholar]
- Di Y, Lei Y, Yu F, Changfeng F, Song W, Xuming M. MicroRNAs expression and function in cerebral ischemia reperfusion injury. J Mol Neurosci. 2014;53:242–250. doi: 10.1007/s12031-014-0293-8. [DOI] [PubMed] [Google Scholar]
- Guan D, Su Y, Li Y, Wu C, Meng Y, Peng X, Cui Y. Tetramethylpyrazine inhibits CoCl2 -induced neurotoxicity through enhancement of Nrf2/GCLc/GSH and suppression of HIF1alpha/NOX2/ROS pathways. J Neurochem. 2015;134:551–565. doi: 10.1111/jnc.13161. [DOI] [PubMed] [Google Scholar]
- Jeyaseelan K, Lim KY, Armugam A. MicroRNA expression in the blood and brain of rats subjected to transient focal ischemia by middle cerebral artery occlusion. Stroke. 2008;39:959–966. doi: 10.1161/STROKEAHA.107.500736. [DOI] [PubMed] [Google Scholar]
- Kasdorf E, Perlman JM. Strategies to prevent reperfusion injury to the brain following intrapartum hypoxia-ischemia. Semin Fetal Neonatal Med. 2013;18:379–384. doi: 10.1016/j.siny.2013.08.004. [DOI] [PubMed] [Google Scholar]
- Kim SJ, Shin JY, Lee KD, Bae YK, Sung KW, Nam SJ, Chun KH. MicroRNA let-7a suppresses breast cancer cell migration and invasion through downregulation of C-C chemokine receptor type 7. Breast Cancer Res. 2012;14:R14. doi: 10.1186/bcr3098. [DOI] [PMC free article] [PubMed] [Google Scholar]
- Koga S, Kojima S, Kishimoto T, Kuwabara S, Yamaguchi A. Over-expression of map kinase phosphatase-1 (MKP-1) suppresses neuronal death through regulating JNK signaling in hypoxia/re-oxygenation. Brain Res. 2012;1436:137–146. doi: 10.1016/j.brainres.2011.12.004. [DOI] [PubMed] [Google Scholar]
- Kristiansen M, Hughes R, Patel P, Jacques TS, Clark AR, Ham J. Mkp1 is a c-Jun target gene that antagonizes JNK-dependent apoptosis in sympathetic neurons. J Neurosci. 2010;30:10820–10832. doi: 10.1523/JNEUROSCI.2824-10.2010. [DOI] [PMC free article] [PubMed] [Google Scholar]
- Lee CT, Risom T, Strauss WM. Evolutionary conservation of microRNA regulatory circuits: an examination of microRNA gene complexity and conserved microRNA-target interactions through metazoan phylogeny. DNA Cell Biol. 2007;26:209–218. doi: 10.1089/dna.2006.0545. [DOI] [PubMed] [Google Scholar]
- Lee M, Kang H, Jang SW. CoCl2 induces PC12 cells apoptosis through p53 stability and regulating UNC5B. Brain Res Bull. 2013;96:19–27. doi: 10.1016/j.brainresbull.2013.04.007. [DOI] [PubMed] [Google Scholar]
- Liu DZ, Tian Y, Ander BP, Xu H, Stamova BS, Zhan X, Turner RJ, Jickling G, Sharp FR. Brain and blood microRNA expression profiling of ischemic stroke, intracerebral hemorrhage, and kainate seizures. J Cereb Blood Flow Metab. 2010;30:92–101. doi: 10.1038/jcbfm.2009.186. [DOI] [PMC free article] [PubMed] [Google Scholar]
- Liu FF, Liu CY, Li XP, Zheng SZ, Li QQ, Liu Q, Song L. Neuroprotective effects of SMADs in a rat model of cerebral ischemia/reperfusion. Neural Regen Res. 2015a;10:438–444. doi: 10.4103/1673-5374.153693. [DOI] [PMC free article] [PubMed] [Google Scholar]
- Liu K, Zhang C, Li T, Ding Y, Tu T, Zhou F, Qi W, Chen H, Sun X. Let-7a inhibits growth and migration of breast cancer cells by targeting HMGA1. Int J Oncol. 2015b;46:2526–2534. doi: 10.3892/ijo.2015.2949. [DOI] [PubMed] [Google Scholar]
- Liu L, Doran S, Xu Y, Manwani B, Ritzel R, Benashski S, McCullough L, Li J. Inhibition of mitogen-activated protein kinase phosphatase-1 (MKP-1) increases experimental stroke injury. Exp Neurol. 2014;261:404–411. doi: 10.1016/j.expneurol.2014.05.009. [DOI] [PMC free article] [PubMed] [Google Scholar]
- Liu XS, Chopp M, Zhang RL, Tao T, Wang XL, Kassis H, Hozeska-Solgot A, Zhang L, Chen C, Zhang ZG. MicroRNA profiling in subventricular zone after stroke: MiR-124a regulates proliferation of neural progenitor cells through Notch signaling pathway. PLoS One. 2011;6:e23461. doi: 10.1371/journal.pone.0023461. [DOI] [PMC free article] [PubMed] [Google Scholar]
- Nakka VP, Gusain A, Mehta SL, Raghubir R. Molecular mechanisms of apoptosis in cerebral ischemia: multiple neuroprotective opportunities. Mol Neurobiol. 2008;37:7–38. doi: 10.1007/s12035-007-8013-9. [DOI] [PubMed] [Google Scholar]
- Patterson KI, Brummer T, O’Brien PM, Daly RJ. Dual-specificity phosphatases: critical regulators with diverse cellular targets. Biochem J. 2009;418:475–489. doi: 10.1042/bj20082234. [DOI] [PubMed] [Google Scholar]
- Pothof J, van Gent DC. Spatiotemporal aspects of MicroRNA-mediated gene regulation. Adv Exp Med Biol. 2011;722:75–85. doi: 10.1007/978-1-4614-0332-6_5. [DOI] [PubMed] [Google Scholar]
- Rastogi R, Jiang Z, Ahmad N, Rosati R, Liu Y, Beuret L, Monks R, Charron J, Birnbaum MJ, Samavati L. Rapamycin induces mitogen-activated protein (MAP) kinase phosphatase-1 (MKP-1) expression through activation of protein kinase B and mitogen-activated protein kinase kinase pathways. J Biol Chem. 2013;288:33966–33977. doi: 10.1074/jbc.M113.492702. [DOI] [PMC free article] [PubMed] [Google Scholar]
- Sempere LF, Freemantle S, Pitha-Rowe I, Moss E, Dmitrovsky E, Ambros V. Expression profiling of mammalian microRNAs uncovers a subset of brain-expressed microRNAs with possible roles in murine and human neuronal differentiation. Genome Biol. 2004;5:R13. doi: 10.1186/gb-2004-5-3-r13. [DOI] [PMC free article] [PubMed] [Google Scholar]
- Song J, Lee JE. ASK1 modulates the expression of microRNA Let7A in microglia under high glucose in vitro condition. Front Cell Neurosci. 2015;9:198. doi: 10.3389/fncel.2015.00198. [DOI] [PMC free article] [PubMed] [Google Scholar]
- Song J, Cho KJ, Oh Y, Lee JE. Let7a involves in neural stem cell differentiation relating with TLX level. Biochem Biophys Res Commun. 2015a;462:396–401. doi: 10.1016/j.bbrc.2015.05.004. [DOI] [PubMed] [Google Scholar]
- Song L, Li D, Zhao Y, Gu Y, Zhao D, Li X, Bai X, Sun Y, Zhang X, Sun H, Wang Y, Peng L. miR-218 suppressed the growth of lung carcinoma by reducing MEF2D expression. Tumour Biol. 2015b doi: 10.1007/s13277-015-4038-2. doi: 10.1007/s13277-015-4038-2. [DOI] [PubMed] [Google Scholar]
- Suzuki HI, Miyazono K. Emerging complexity of microRNA generation cascades. J Biochem. 2011;149:15–25. doi: 10.1093/jb/mvq113. [DOI] [PubMed] [Google Scholar]
- Tan KS, Armugam A, Sepramaniam S, Lim KY, Setyowati KD, Wang CW, Jeyaseelan K. Expression profile of MicroRNAs in young stroke patients. PLoS One. 2009;4:e7689. doi: 10.1371/journal.pone.0007689. [DOI] [PMC free article] [PubMed] [Google Scholar]
- Tuttolomondo A, Di Sciacca R, Di Raimondo D, Renda C, Pinto A, Licata G. Inflammation as a therapeutic target in acute ischemic stroke treatment. Curr Top Med Chem. 2009;9:1240–1260. doi: 10.2174/156802609789869619. [DOI] [PubMed] [Google Scholar]
- Wang GK, Zhu JQ, Zhang JT, Li Q, Li Y, He J, Qin YW, Jing Q. Circulating microRNA: a novel potential biomarker for early diagnosis of acute myocardial infarction in humans. Eur Heart J. 2010;31:659–666. doi: 10.1093/eurheartj/ehq013. [DOI] [PubMed] [Google Scholar]
- Wang Q, Shi S, He W, Padilla MT, Zhang L, Wang X, Zhang B, Lin Y. Retaining MKP1 expression and attenuating JNK-mediated apoptosis by RIP1 for cisplatin resistance through miR-940 inhibition. Oncotarget. 2014;5:1304–1314. doi: 10.18632/oncotarget.1798. [DOI] [PMC free article] [PubMed] [Google Scholar]
- White BC, Sullivan JM, DeGracia DJ, O’Neil BJ, Neumar RW, Grossman LI, Rafols JA, Krause GS. Brain ischemia and reperfusion: molecular mechanisms of neuronal injury. J Neurol Sci. 2000;179:1–33. doi: 10.1016/s0022-510x(00)00386-5. [DOI] [PubMed] [Google Scholar]
- Wong CH, Crack PJ. Modulation of neuro-inflammation and vascular response by oxidative stress following cerebral ischemia-reperfusion injury. Curr Med Chem. 2008;15:1–14. doi: 10.2174/092986708783330665. [DOI] [PubMed] [Google Scholar]
- Zhang Y, Wang X, Zhong M, Zhang M, Suo Q, Lv K. MicroRNA let-7a ameliorates con A-induced hepatitis by inhibiting IL-6-dependent Th17 cell differentiation. J Clin Immunol. 2013;33:630–639. doi: 10.1007/s10875-012-9840-7. [DOI] [PubMed] [Google Scholar]
- Zheng Z, Lee JE, Yenari MA. Stroke: molecular mechanisms and potential targets for treatment. Curr Mol Med. 2003;3:361–372. doi: 10.2174/1566524033479717. [DOI] [PubMed] [Google Scholar]