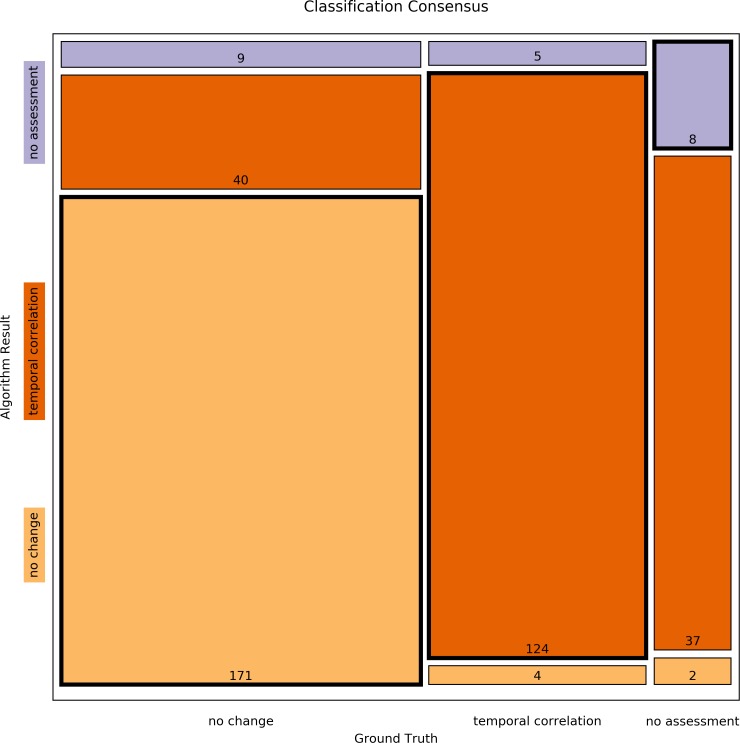
Figure 3. Mosaic plot of classification consensus between Ground Truth and algorithm output.
The width of the faces represents the proportion of the Ground Truth data; the height represents the proportion of the algorithm result; the figures are the absolute numbers. The boldly framed bars are those in which the algorithm achieved consensus with the ground truth.

