
Figure 2. Vaccination status of patients infected with H3N2 influenza.
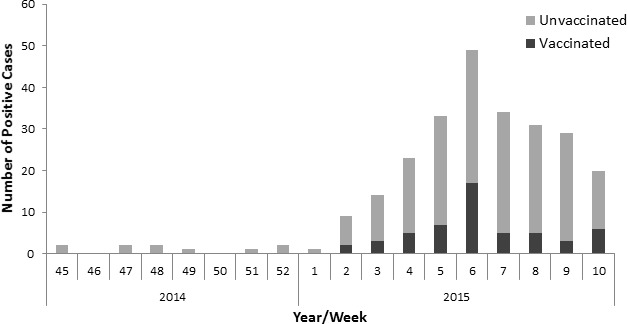
The graph demonstrates the number of influenza A (H3N2)-positive patients and their vaccination status.
Official websites use .gov
A
.gov website belongs to an official
government organization in the United States.
Secure .gov websites use HTTPS
A lock (
) or https:// means you've safely
connected to the .gov website. Share sensitive
information only on official, secure websites.
The graph demonstrates the number of influenza A (H3N2)-positive patients and their vaccination status.