

Oncotarget. 2015; 6: 15594-15609
doi: 10.18632/oncotarget.3709
Present Figure 2: During the assembly of figure 2C, the same image was inadvertently used for both the non-transfected and empty vector control.
Figure 2. PBK causally modulates invasive and migratory potential of prostate cancer cells.
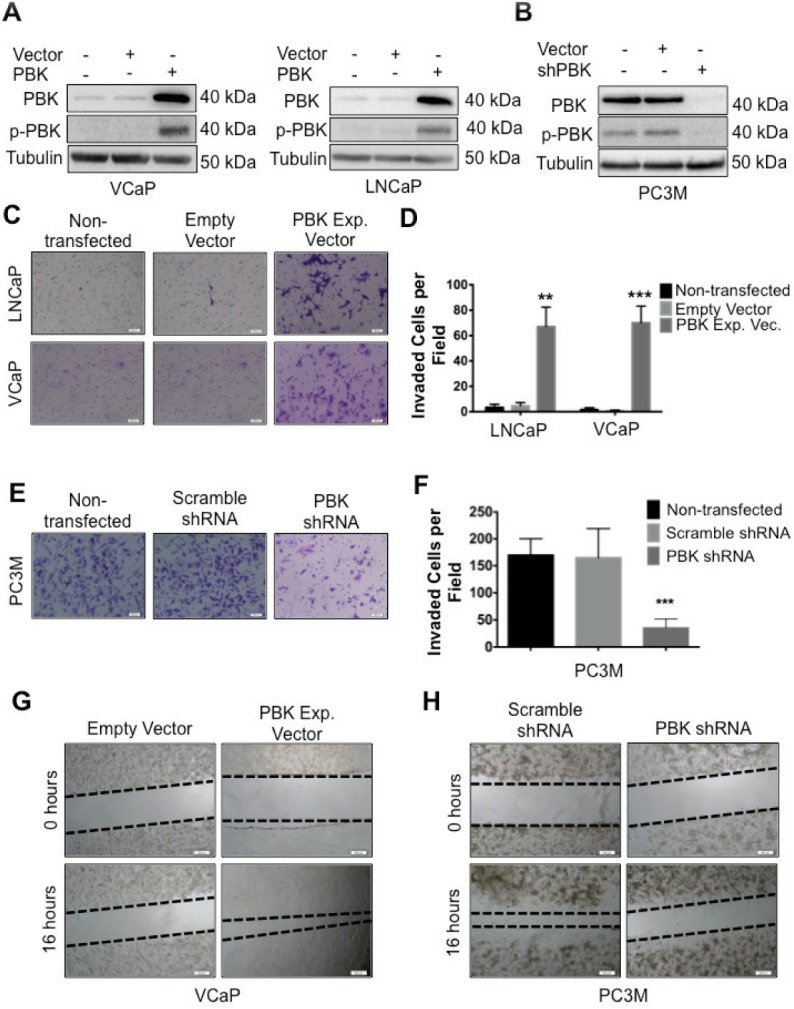
(A) Ectopic expression of PBK in hormone-sensitive LNCaP and VCaP cells is measured by Western blot analysis. Non-transfected and empty vector-infected cells were used as controls. (B) Western blot showing knockdown of PBK in PC-3M cells. Non-transfected and scrambled shRNA-transfected cells were used as controls. Representative images of (C) LNCaP or VCaP cells, either appropriate controls or stably overexpressing PBK, stained with crystal violet after being subjected to a modified Boyden chamber invasion assay, in addition to (E) PC-3M cells, with PBK expression stably knocked down and appropriate controls. (D and F) Quantification of cells that had invaded from three different experiments. Invaded cells were counted in four fields of view from each experiment. Quantitative data are represented as SEM ± SE. ** represents a p-value <0.01 and *** a p-value <0.001. Representative images of cell migration 16h after creation of a wound in (G) VCaPPBK and (H) PC-3M-shPBK stably modified cells compared to their respective controls (empty vector or scrambled-shRNA stable cells, respectively). The black dotted line indicates the boundary of the area covered by cells. n ≥ 3.
Corrected Figure 2:
Figure 2. PBK causally modulates invasive and migratory potential of prostate cancer cells.

(A) Ectopic expression of PBK in hormone-sensitive LNCaP and VCaP cells is measured by Western blot analysis. Non-transfected and empty vector-infected cells were used as controls. (B) Western blot showing knockdown of PBK in PC-3M cells. Non-transfected and scrambled shRNA-transfected cells were used as controls. Representative images of (C) LNCaP or VCaP cells, either appropriate controls or stably overexpressing PBK, stained with crystal violet after being subjected to a modified Boyden chamber invasion assay, in addition to (E) PC-3M cells, with PBK expression stably knocked down and appropriate controls. (D and F) Quantification of cells that had invaded from three different experiments. Invaded cells were counted in four fields of view from each experiment. Quantitative data are represented as SEM ± SE. ** represents a p-value <0.01 and *** a p-value <0.001. Representative images of cell migration 16h after creation of a wound in (G) VCaPPBK and (H) PC-3M-shPBK stably modified cells compared to their respective controls (empty vector or scrambled-shRNA stable cells, respectively). The black dotted line indicates the boundary of the area covered by cells. n ≥ 3.