

Abstract
Objective
We sought to quantify rates of stand-alone e-prescribing (SEP) adoption and usage among primary care physicians (PCPs) participating in an SEP initiative, and to determine which physician and patient-panel characteristics were associated with higher rates of each.
Background
Health Information Technology (HIT) holds promise for improving care, but its use among physicians practicing in smaller groups has been limited by cost and implementation barriers. SEP is an entry-level technology that may minimize these barriers.
Design
Using records from in an insurer-led SEP initiative, we compared the characteristics of 297 PCPs who adopted SEP through the initiative with the characteristics of 1892 eligible PCPs who did not. Among the 297 adopters, we studied the extent of SEP usage.
Measurements
Dependent variables were each physician’s adoption of SEP and their e-prescribing usage ratio (the ratio of electronic prescriptions to pharmacy claims in the same time period). Independent variables included characteristics of PCPs (specialty, practice size, and prescribing volume) and their patients (patient age, gender, income, race, and ethnicity).
Results
Solo practitioners, pediatricians, and physicians with more patients from predominantly African-American zip codes were under-represented among SEP adopters. The mean e-prescribing usage ratio among adopters was 0.23 (SD 0.28); 20% of physicians maintained usage ratios above 0.50. Available physician characteristics explained little of the variance in usage, but physicians in smaller practices had greater usage (p = 0.02).
Conclusion
Certain categories of physicians may need more tailored incentives to adopt SEP. On average, adopters only used the SEP system for about one quarter of their prescriptions. Some adopters achieved high levels of SEP usage, though, and further research is needed to elucidate the factors that enabled this.
I. INTRODUCTION
There is evidence that, in some settings, health information technology (HIT) can improve patient outcomes and reduce health care costs.1 The vast majority of this evidence comes from just four healthcare organizations, where academic physician-employees are usually required to use homegrown electronic medical records (EMRs).2–5 However, only a minority of physicians practice in these types of environments. Over 75% of physicians practice in groups of five or less.6 Unfortunately, the structure of these small community private practices is not conducive to providing the financial and time investment necessary for EMR adoption.7, 8 As a result, only 9 to 14% of these practices have adopted EMRs, compared with 23–50% of larger practices.9
Stand-alone e-prescribing (SEP) has been proposed as a possible method of transitioning community physicians towards EMR functionality without the initial investments required for a full EMR system.10, 11 Indeed, recent legislation promises to increase Medicare reimbursement for e-prescribing physicians in the short term, and to decrease Medicare reimbursement for paper prescribers in the long term.12
We are aware of only one prior study that evaluates adoption and usage of commercial SEP systems by community physicians.13 Fischer et al examined usage and adoption of the PocketScript system, which was offered without cost to high-volume outpatient prescribers in Massachusetts. A striking finding of their analysis was the low usage of e-prescribing, which, although increasing throughout the time period studied, was below 30% of all eligible prescriptions even one year after adoption. The authors cite anecdotal evidence of increased e-prescribing since that time period, but only present data through early 2005.
To further characterize experiences with SEP from other states, using another e-prescribing system, and in a more recent time period, we quantified the rates of e-prescribing adoption and usage that occurred when Horizon Blue Cross Blue Shield of New Jersey (Horizon BCBSNJ) offered SEP to community physicians participating in their health maintenance organization (HMO) and preferred provider organization network. Our primary study objectives were to quantify these rates and to determine which physician and patient characteristics were associated with high rates of each.
II. METHODS
A. Setting and Intervention
Horizon BCBSNJ, New Jersey’s largest health insurer, provides coverage for 3.2 million members. In late 2004, Horizon BCBSNJ launched an initiative offering its physicians Caremark’s iScribe SEP software (Caremark is Horizon BCBSNJ’s pharmacy benefits manager). The program installed SEP systems for individual physicians rather than for practices as a whole. All features of the program, including the target population, recruitment and incentives provided, were determined by Horizon BCBSNJ for purposes of improving care delivery. Our analysis of physicians’ SEP adoption and usage was designed subsequently, to use secondary data from the program and other sources.
Direct mail and fax were used to inform physicians of the program, and field staff followed-up with those who indicated interest. Adopters were required to have broadband Internet and computerized practice management systems capable of uploading patients’ demographic information to the SEP system. HBCBSNJ provided physicians with wireless personal digital assistants (PDAs) and iScribe e-Prescribing software for these PDAs and for desktop computers. Providers needed to be part of the Horizon BCBSNJ network (which included about 80% of New Jersey physicians), but could use the SEP system to write prescriptions for any patient, regardless of insurance. Prescriptions could be printed out or electronically transmitted to pharmacies using the SCRIPT standard via a commercial routing network such as SureScripts. All major chain pharmacies and most independent pharmacies in New Jersey could receive prescriptions via this routing at the time of the study. Prescriptions for controlled substances could not be transmitted electronically, but could be printed out on security paper and signed. The program covered the costs of hardware, software, installation, and training (estimated at $4200–$6400 per prescriber), and it supported ongoing use of e-prescribing through quarterly honoraria that ranged from $150–$500 per prescriber, based on survey participation and the ratio of electronic prescriptions to prescription claims.
Of approximately 14,250 physicians in the Horizon BCBSNJ provider network, about 5890 physicians were eligible for the program based on prescribing activity that resulted in at least 500 Horizon BCBSNJ pharmacy claims annually (this cutoff was determined by Horizon BCBSNJ for purposes of program feasibility). The vast majority (87%) of these eligible physicians were in practices containing 5 or fewer physicians. An initial wave of recruitment focused on the highest-volume prescribers (>2500 filled prescriptions/year), and subsequent phases targeted incrementally lower-volume prescribers. By the time the allocated resources were expended, 4457 physicians had received the e-prescribing offer (Figure 1).
Figure 1. Selection of PCPs for Adoption Analysis.
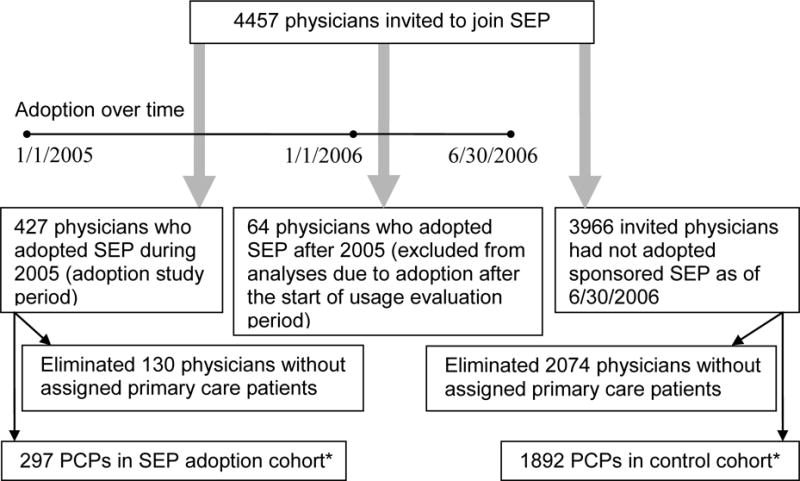
*These two groups are compared in the adoption analysis.
B. Study Population and Dependent Variable for Physician Adoption Analysis
We retrospectively constructed two cohorts of physicians – one cohort of physicians who adopted the offered SEP system and one cohort of physicians who did not. Physician adoption was then used as the dependent variable in our adoption analysis. Physicians were also characterized based on their specialty, practice size, prior Horizon BCBSNJ pharmacy claim volume, and assigned primary care patient panel. Horizon BCBSNJ ensured that all patients in their HMO and point of service (POS) insurance plans had an assigned PCP, whereas patients with other Horizon BCBSNJ insurance plans did not. To focus our analysis on PCPs, physicians without any assigned Horizon BCBSNJ primary care patients were excluded from the analysis. However, physicians with only a small number of Horizon BCBSNJ assigned primary care patients were included in the analysis, with the expectation that they probably also provided primary care to many non-managed care patients insured by Horizon BCBSNJ.
SEP adoption started on January 1, 2005, and data was available through June 30, 2006. We therefore decided to study adoption based on data from calendar year 2005, and then to study usage among the adopting physicians during the first half of 2006. Since all of the physicians studied had adopted SEP by 1/1/06, our strategy allowed for comparison of SEP usage during the same 6-month period for all participants (1/1/06 to 6/30/06). The control cohort consisted of physicians who had been offered the service, but who had not adopted the SEP system by the end of our data collection period (6/30/06). To ensure that usage over time was measured consistently for all physicians, we excluded physicians from the analysis if they adopted the SEP system after the start of the usage evaluation period (1/1/06). Furthermore, complete data about physicians who adopted SEP during this period was not available from Horizon BCBSNJ.
C. Dependent Variable for E-prescribing Usage Analysis
The second major goal of our project was to study physician usage of SEP among adopters. We calculated an “e-prescribing usage ratio,” ranging from 0–1, by dividing the number of SEP prescriptions the physician wrote for Horizon BCBSNJ patients by the number of Horizon BCBSNJ pharmacy claims attributable to the physician during the same quarter. Each physician’s usage ratio was calculated for each quarter of the e-prescribing usage evaluation period (1/1/2006 – 6/30/2006). Because pharmacy claims may be generated for prescriptions written prior to a given quarter, it was possible for a PCP’s ratio to exceed 1; this occurred in particular when total-prescription denominators were relatively low. Thus, all usage ratios were capped at 1 for the analysis. The ratio numerator included all prescriptions generated through the SEP system, whether printed or electronically transmitted. Because we wanted to understand physician behavior rather than patient behavior, electronic renewals (physician behavior) were counted in the ratio numerator and renewal claims were counted in the ratio denominator. Refills (patient behavior) of existing prescriptions were excluded from both the ratio numerator and denominator.
After all PCPs were assigned usage ratios, some physicians were also classified as “never having used” the system if records did not show any electronic prescriptions after the day of activation (when test prescriptions were often transmitted). Other PCPs were classified as having “quit e-prescribing” if they had initially used the system but later stopped synchronizing their personal digital assistant and sending any electronic prescriptions by the last quarter of the usage evaluation period.
D. Independent Variables: PCP Characteristics and Patient Panel Data
Caremark provided physician specialty and practice size information, which was only available in previously determined groupings (groups of one, two to five, six to ten, and greater than ten physicians). Each physician’s total pharmacy claim volume was provided by Horizon BCBSNJ for 2003 (the calendar year prior to the start of program recruitment) in categories (0–250, 251–500, etc), which we aggregated into “high,” “medium,” and “low” categories that approximated terciles. Physicians were thus categorized as low-volume prescribers (less than 1750 Horizon BCBSNJ pharmacy claims in 2003, which represented the 35th percentile), mid-volume prescribers, and high-volume prescribers (greater than 3500 Horizon BCBSNJ pharmacy claims in 2003, which represented the 71st percentile).
Horizon BCBSNJ provided de-identified age, gender, and zip code information for each of the PCPs’ assigned primary care patients in Horizon BCBSNJ HMO or POS plans. For each PCP, we calculated their patients’ mean age, female percentage, and median patient household income. Patients’ incomes were first estimated using the median household income for their residential zip code based on 2000 US census data. To prevent reidentification, Horizon BCBSNJ divided the range of median household incomes into several consecutive $7500 bins (e.g. $37,500 to $45,000) and indicated which $7500 bin contained each patient’s income. Then, for each physician, we calculated their median patient income bin and subsequently classified each PCP’s practice as low median patient household income (less than $45,000 annually, which represented the 8th percentile for all PCPs), mid-range median patient household income ($45,000–$75,000), or high median patient household income (greater than $75,000 annually, which represented the 79th percentile for all PCPs). Rather than using terciles, these more extreme cutpoints were chosen to separate out low and high income groups.
We also used zip codes to estimate the racial and ethnic makeup of the neighborhoods from which the PCPs’ patients were drawn. First, patients living in Zip codes with greater than 50% African-American residents (per 2000 US Census data) were categorized as living in majority African-American neighborhoods; those from Zip codes with more than 40% Hispanic residents were categorized as living in Hispanic-plurality neighborhoods. An analysis of the studied zip codes showed that these predominantly African-American and Hispanic neighborhoods categorizations were mutually exclusive more than 99% of the time. Then, PCPs were categorized based on having at least 10% of their patients living in majority African-American and/or Hispanic-plurality neighborhoods (which represented the 80th and 87th percentile, respectively).
E. Data Analysis
Our analysis consisted of two components. In the adoption analysis, we compared the physician characteristics of adopting PCPs to control PCPs using t-tests, the chi-square test, and multivariate logistic regression. The second component of our analysis measured usage among adopting PCPs using a 2-part model. The first part was a logistic regression model in which the dependent variable was “never having used” or “quit e-prescribing” (as described above) vs. having some evidence of e-prescribing use into the last quarter of the observation period. The objective of this analysis was to identify factors that predispose physicians to stop e-prescribing. The second part was a multivariate linear regression model that examined the association between physician characteristics and the extent of SEP usage among the subsample of physicians who had started e-prescribing and did not quit. We excluded “never having used” and “quit e-prescribing” physicians from this second analysis to examine ongoing usage barriers among those physicians who continued to try to use SEP.
Both regression models were constructed by beginning with all available predictor variables included, and then model fit was manually re-assessed after elimination of each non-associated (p > 0.05) predictor variable. Model fit was assessed using R2 for the linear regression and c-statistic for the logistic regression. Collinearity was assessed using coefficients of correlations between all variables remaining in each of the final models. Only complete cases were analyzed in the regression models. All analyses were performed using SAS, release 9.1 (SAS Institute, Inc; Cary, NC, 2007).
III. RESULTS
A. PCP Characteristics Associated with SEP Adoption
Of 4457 physicians invited to join the SEP program, 427 physicians adopted the SEP system during 2005 (Figure 1). An additional 64 physicians who adopted the SEP system in 2006 (partway through the usage evaluation period) were excluded from our analyses. Of the 427 adopting physicians, 297 (70%) were classified as primary care physicians (PCPs) based on their having any primary care patients assigned from a Horizon BCBSNJ managed care plan as of 1/1/2006. Similarly, control physicians numbered 3966; 1892 (48%) of these physicians had assigned primary care patients. Thus, PCPs participated at a higher rate than non-PCPs. The control and adoption cohorts had a median of 68 and 69 assigned primary care patients, respectively.
Table 1 compares the adoption and control cohorts of PCPs and their patients. The 1892 PCPs in the control cohort had a different distribution of practice sizes than the 297 PCPs in the adoption cohort (p = 0.0001). Pharmacy claims volume and specialty of the two groups of PCPs were not significantly different, and neither were the gender, age, and income of the PCPs’ patients. PCPs in the adoption cohort were less likely to have over 10% of their patient panel live in majority African-American neighborhoods (p = 0.01).
Table 1.
Characteristics of PCPs (including PCPs’ Study Patient Populations)
| PCP Characteristics | SEP Adoption Cohort (n = 297) |
Control Cohort (n = 1892) |
P value* |
|---|---|---|---|
| Specialty | 0.06 | ||
| Family Medicine | 108 (36%) | 593 (31%) | |
| Internal Medicine | 155 (52%) | 990 (52%) | |
| Pediatrics | 31 (10%) | 281 (15%) | |
| Other | 3 (1.0%) | 5 (0.3%) | |
| Missing Data | 0 (0.0%) | 23 (1.2%) | |
| Practice Size | 0.0001 | ||
| 1 physician (solo) | 105 (35%) | 913 (48%) | |
| 2–5 physicians | 152 (51%) | 736 (39%) | |
| 6–10 physicians | 37 (12%) | 189 (10%) | |
| >10 physicians | 3 (1.0%) | 31 (1.6%) | |
| Missing | 0 | 23 (1.2%) | |
| Horizon BCBSNJ Pharmacy Claim Volume | 0.06 | ||
| Low volume | 92 (31%) | 701 (37%) | |
| Mid volume | 106 (36%) | 672 (36%) | |
| High volume | 99 (33%) | 519 (27%) | |
|
| |||
| PCP Patient Panel Characteristics† | P value | ||
| Median number of Horizon BCBSNJ assigned primary care patients | 69 (IQR 41 – 134) | 68 (IQR 34 – 119) | |
| Mean Age | 39.2 | 37.9 | 0.12 |
| Percent Female | 53% | 53% | 0.95 |
| Race and Ethnicity†† | |||
| More than 10% of patients from majority African-American neighborhoods | 40 (14%) | 356 (21%) | 0. 01 |
| More than 10% of patients from Hispanic-plurality neighborhoods | 31 (11%) | 230 (13%) | 0.26 |
| Median Patient Household Income§ | 0.26 | ||
| Low (< $45,000) | 24 (8.5%) | 131 (7.6%) | |
| Midrange (≥ $45,000 and < $75,000) | 187 (66%) | 1218 (71%) | |
| High (≥ $75,000) | 71 (25%) | 365 (21%) | |
The Chi-Square test was used to calculate p-values for comparisons of characteristics with multiple categories, while the t-test was used for other characteristics. “Other” and “Missing” categories were excluded from Chi-Square calculations.
For mean patient age and gender estimates, as well as for race, ethnicity, and income (Zip code-based) estimates, 15 PCPs in the adoption cohort (5%) and 178 PCPs in the control cohort (9%) were excluded because they had too few study patients to generate a reliable estimate (less than 5 patients with non-missing data for a given PCP).
Neighborhoods were considered majority African-American if greater than 50% of residents in a zip code were African-American by 2000 census data. For Hispanic-plurality neighborhoods, the cutoff was set at 40%. PCPs with greater than 10% of their patients from African-American and Hispanic neighborhoods were in the 80th and 87th percentile of study PCPs, respectively.
For each PCP, this number represents the median household income of the PCP’s patients, where each patient’s household income is estimated using the median household income for the patient’s zip code.
Multivariate logistic regression analysis showed that the association of SEP adoption with practice size and neighborhood racial makeup persists after controlling for other PCP characteristics (Table 2). On the other hand, our model found no association of SEP adoption with PCP pharmacy claim volume or with patient panel age, gender, or income. While the chi-square test for physician specialty shows no statistically significant difference between the two groups of physicians, the regression model indicates that when adjustments were made for practice size and race, pediatricians were significantly less likely to adopt e-prescribing (OR 0.61, 95% CI 0.5 – 1.0, p-value of 0.02). None of the distinct variables in the final model had a coefficient of correlation greater than 0.15.
Table 2.
Physician Characteristics Associated with E-Prescribing Adoption (n = 1990)*
| PCP Characteristics | Odds Ratio | 95% CI | P value |
|---|---|---|---|
| Practice Size** | <0.001 | ||
| 2–5 physicians | 1.80 | 1.36 – 2.37 | <0.0001 |
| 6–10 physicians | 1.77 | 1.16 – 2.70 | <0.01 |
| >10 physicians | 0.96 | 0.27 – 3.37 | 0.95 |
| Practice Type† | |||
| Pediatrics | 0.61 | 0.41 – 0.92 | 0.02 |
| Race/Ethnicity of Patient Panel Population | |||
| >10% of patients from majority African-American neighborhoods | 0.69 | 0.48 – 0.99 | 0.04 |
PCP characteristics with no association (not used as predictors in this model) are PCP specialty of family medicine and PCP pharmaceutical claim volume; PCP patient panel age, gender, income, and neighborhood Hispanic ethnicity. c = 0.60
Referent practice size is 1 physician.
All non-pediatric PCPs were combined into one referent group to demonstrate the difference in adoption between pediatric and non-pediatric PCPs. This referent group is composed of greater than 98% internists and family practitioners.
B. Extent of E-Prescribing Usage
Among the 297 adopting PCPs, the mean e-prescribing usage ratio was 0.23 (SD 0.28, interquartile range 0.00 – 0.39), which represents 23 electronic prescriptions per 100 pharmacy claims. Thirty-four (11%) PCPs never used the system after it was installed and another 22 (7.4%) quit using it after at least some initial usage. Of the remaining 241 PCPs, 141 (59%) had an e-prescribing usage ratio less than 0.25, 51 (21%) had an e-prescribing usage ratio from 0.25 to 0.5, and 49 (20%) had an e-prescribing usage ratio above 0.5 (Figure 2).
Figure 2. Distribution of E-Prescribing Use Among Adopting Physicians (n = 297) During the Usage Evaluation Period (1/1/06 – 6/30/06)*.

*By dividing the number of electronic prescriptions written for Horizon BCBSNJ patients during the e-prescribing usage evaluation period (1/1/06 – 6/30/06) by the number of Horizon BCBSNJ pharmacy claims processed during the e-prescribing usage evaluation period, an ‘e-prescribing usage ratio’ ranging from 0–1 is calculated for each physician.
C. PCP Characteristics Associated with Extent of E-Prescribing Usage
For the first part of our two part model, we used logistic regression to estimate the association of physician and patient characteristics with being in the “never having used” or “quit e-prescribing” categories. However, these categorizations were not significantly associated with any of our independent variables. In the second part of the two part model (Table 3), physician practice size was significantly associated with e-prescribing usage ratio (omnibus P=0.02), though this factor accounted for very little of the variance (R2=0.01). The results show that among those using e-prescribing at all, PCPs in larger practices (6–10 and >10 MDs) tended to use their e-prescribing systems for fewer of their prescriptions. None of the distinct variables in the final model had a coefficient of correlation greater than 0.15.
Table 3.
Linear Regression Evaluating PCP Characteristics Associated with E-Prescribing Usage (n = 241)*
| PCP Characteristics | Variable Estimate | 95% CI | P Value** |
|---|---|---|---|
| Practice Size† | 0.02 | ||
| 2–5 physicians | −0.01 | −0.09 – 0.07 | 0.76 |
| 6–10 physicians | −0.08 | −0.21 – 0.04 | 0.17 |
| >10 physicians | −0.18 | −0.31 – −0.05 | 0.01 |
By dividing the number of electronic prescriptions written for Horizon BCBSNJ patients during the e-prescribing usage evaluation period (1/1/06 – 6/30/06) by the number of Horizon BCBSNJ pharmacy claims processed during the e-prescribing usage evaluation period, an ‘e-prescribing usage ratio’ ranging from 0–1 is calculated for each physician. This ‘eRx use index’ is the dependent variable for this regression model, which uses data from 241 physicians in the e-prescribing cohort. Fifty-six physicians are excluded from this analysis because they never used the system after it was installed (n = 34) or because they quit using it after some initial usage (n = 22).
PCP characteristics with no association (not used as predictors in this model) are PCP specialty and PCP pharmaceutical claim volume; PCP patient panel age, gender, income, and neighborhood racial and ethnic makeup. R2 = 0.01
Referent practice size is 1 physician.
IV. DISCUSSION
SEP has been proposed as an entry-level technology accessible to the majority of US physicians, who work in small practices. Because small practices have been slow to adopt other forms of HIT,9, 14–17 several initiatives are now promoting SEP to this group of physicians.12, 18–24 Despite the interest, there is limited data about which physicians actually adopt SEP and which patient populations might be affected.13 Furthermore, levels of usage are particularly important to understand for SEP because physicians can easily revert to paper prescribing.
A. SEP Adoption
Our adoption analysis found that PCPs who adopted SEP were more likely to be in practices with 2 to 10 physicians and less likely to be pediatricians or have patients living in majority African-American neighborhoods. One prior analysis of SEP adoption reported the practice size and specialty of adopting physicians, but these physicians were not compared to non-adopters.13 Prior studies of EMR adoption have found that adoption increases steadily with increasing practice size.9, 14 In contrast, we found that physicians in practices of 2–5 physicians and 6–10 physicians were equally likely to adopt SEP, and that both groups had 1.8 times the odds of solo practice physicians of adopting SEP. Because our sample underrepresented large group practices, our confidence interval for this group is large and we cannot draw any conclusions about the relative likelihood of these physicians to adopt SEP. Nonetheless, our results from small and midsize physician groups suggest that SEP is being adopted by physicians who might have otherwise been unlikely to use HIT.
In our study, pediatricians had significantly lower odds of adopting SEP compared with internists and family practitioners. Pediatricians might have less incentive to adopt SEP because they tend to prescribe fewer medications than physicians who treat adults. However, they also have greater need for age- and weight-based dose calculations, which could be assisted by SEP (but rarely is because of the additional drug knowledge required). The lack of this feature in the SEP systems offered by the Horizon program may have been a relative disincentive for pediatricians.
Our finding of lower adoption among physicians who have at least 10% of their patients living in majority African-American neighborhoods contrasts with results from a nationwide survey of EMR adoption, which found no association between EMR use and the county’s percentage of non-Hispanic whites.14 This discrepancy might be explained by differences in the way that race and ethnicity were analyzed (we represented African-American race and Hispanic ethnicity separately, whereas the survey compared all minority groups together vs. non-Hispanic whites), differences in the geographic units of analysis (zip codes versus counties), or differences in the populations studied (New Jersey versus US). However, it remains likely that minority-serving practices considering SEP face greater challenges to HIT adoption than do the larger minority-serving practices that could consider full EMR adoption. Of note, Horizon BCBSNJ recruitment efforts were based only on prescribing volumes and not on geographic region, neighborhood, or patient-panel characteristics. Since minority care tends to be clustered among a subset of providers,25 additional work may be needed to address challenges of HIT adoption among this group.
B. SEP Usage
In our study, some SEP users succeeded in achieving high levels of usage, but the overall mean usage level was only 23%. This finding is consistent with the 26% usage rate reported in a prior study.13 Because these studies examined physicians in different states using different methodologies, our study provides independent evidence of low SEP usage among the majority of physicians who adopted it. The low usage levels we found occurred despite financial incentives of up to $500 per quarter for high usage. Given that practices almost certainly installed e-prescribing with the intent of using it, our results strongly suggest the existence of unexpected barriers to e-prescribing usage. Some of the known barriers to e-prescribing use are poor pharmacy connectivity, missing eligibility data, and unreliable drug identifiers.26, 27 Another important barrier may be the prohibition on e-transmission of prescriptions for controlled substance. Although controlled substances could be prescribed and printed through the system we studied, the complexity of handling these prescriptions differently may create a workflow barrier that discourages e-prescribing use overall. The results of this study underscore the importance of addressing these barriers.
In multivariate modeling, we found modestly lower SEP usage associated with increasing practice size. This could have occurred if physicians enthusiastic about using e-prescribing technology stimulated SEP adoption, but not usage, among other physicians within their practice (e.g., by arranging for wireless Internet and PDA connectivity in the office). This finding contrasts with the results of Fischer et al, who found no difference in physician SEP usage for groups between 1 and 15 physicians, and found greater SEP usage among groups with more than 15 physicians.13 Many differences between the studies might account for this discrepancy, including differences in the SEP systems offered, the e-prescribing infrastructure, and in physician practices between states, but the most likely explanation is the relative lack of large practices participating in the New Jersey e-prescribing program. Moreover, the primary finding of our multivariate analysis is the low coefficient of determination, demonstrating that the primary determinants of SEP usage were not associated with the factors we had available for analysis. Further basic research is needed to identify the factors that did enable high levels of SEP use for some physicians, despite these barriers.
C. Limitations
Our methodology had several limitations. First, this study was a post-hoc analysis of a real world initiative, rather than a planned experiment. The program goals dictated that higher-prescribing physicians be recruited more intensely. Although we controlled for prescribing volumes statistically, there may have been other, unmeasured sources of differential recruitment that caused differential adoption. However, Horizon BCBSNJ otherwise used identical recruitment procedures for all physicians, thus it remains most likely that the differential adoption we observed was driven primarily by physician differences rather than different levels of recruitment. Low physician interest levels may have manifested in several ways, including an unwillingness to secure high-speed internet access or not responding to the initiative’s direct mailings, but our data did not allow us to explore this issue in detail.
Similarly, because the physician characteristics used in this analysis were not collected by us, but only harvested from secondary data, we were unable to directly measure many factors likely to predict HIT adoption and use. For example, adopting PCPs probably had greater familiarity with and interest in HIT. While we could not assess these presumed HIT skills, we controlled for variables known to be associated with HIT adoption, such as practice size.9, 14 Other proxy variables used included Horizon BCBSNJ pharmacy claim volume (instead of total claim volume) and characteristics of the population in the patient’s zip code of residence (instead of actual patient race, ethnicity, and income).
Second, while our analysis did account for physician practice size, targeted physicians predominantly practiced in small groups. This is a function of the area studied, in that New Jersey has a relative decentralization of primary care, with a predominance of smaller physician practices. While this may limit the generalizability of our results, the advantage of studying these physicians is that they face the greatest challenges in the drive to increase HIT use.
A third major limitation is that we could not measure whether physicians in either cohort were using other methods of e-prescribing. It seems reasonable to assume that few physicians in the e-prescribing cohort would have taken the time to install an SEP system if they were already using another e-prescribing solution, but this assumption does not hold for physicians in the control cohort. If there were a large number of physicians in the control cohort who had adopted e-prescribing through EMRs or other means, there could be some characteristics significantly associated with SEP adoption that were not recognized by our analysis. However, a recent survey showed that only 4% of US physicians had adopted “fully functional” EMRs that included e-prescribing capabilities.9 As HIT penetration increases, assessing its use among control groups will become increasingly important in future research.
A final limitation involves the use of study data to approximate physicians’ real world practice patterns. Physicians’ patient panels were approximated using their Horizon BCBSNJ patients, and physicians’ prescribing habits were approximated using their Horizon BCBSNJ pharmacy claims. Future studies of claims data might address this deficiency by also including an accompanying physician survey to better understand physician habits for patients of all insurance types.
In conclusion, the results of our analysis show that although overall SEP usage levels were low, some physicians were able to use SEP successfully and consistently. Furthermore, in contrast to prior findings on HIT adoption and usage, we found that physicians in smaller practices adopt and use SEP at least as much as other physicians. To better understand the most appropriate role for SEP in HIT policy, future research should seek to identify the specific factors that enable SEP usage, to consider the costs and benefits of SEP, and to understand whether SEP systems can enable interoperability of prescription information. Perhaps most important will be to learn whether physicians using SEP continue to transition toward HIT with more advanced features, such as laboratory alerting or encounter documentation, or whether use of an SEP system might impede adoption of other HIT.
Acknowledgments
Funding: This project was funded by the Agency for Healthcare Research and Quality (Grant No.: 1U18HS016391-01) as part of a larger set of e-prescribing pilot studies. This work was also supported by a health services research and development fellowship from the Department of Veterans Affairs (to JMP).
References
- 1.Chaudhry B, Wang J, Wu S, et al. Systematic Review: Impact of Health Information Technology on Quality, Efficiency, and Costs of Medical Care. Ann Intern Med. 2006 Apr 11; doi: 10.7326/0003-4819-144-10-200605160-00125. 0000605-200605160-200600125. [DOI] [PubMed] [Google Scholar]
- 2.Jha AK, Perlin JB, Kizer KW, Dudley RA. Effect of the Transformation of the Veterans Affairs Health Care System on the Quality of Care. N Engl J Med. 2003 May 29;348(22):2218–2227. doi: 10.1056/NEJMsa021899. [DOI] [PubMed] [Google Scholar]
- 3.Bohmer R, Edmondson A, Feldman L. Harvard Business School Case: Intermountain Health Care. 2002 [Google Scholar]
- 4.Bates DW, Leape LL, Cullen DJ, et al. Effect of Computerized Physician Order Entry and a Team Intervention on Prevention of Serious Medication Errors. JAMA. 1998 Oct 21;280(15):1311–1316. doi: 10.1001/jama.280.15.1311. [DOI] [PubMed] [Google Scholar]
- 5.Overhage JM, Tierney WM, Zhou X-H, McDonald CJ. A Randomized Trial of “Corollary Orders” to Prevent Errors of Omission. J Am Med Inform Assoc. 1997 Sep 1;4(5):364–375. doi: 10.1136/jamia.1997.0040364. [DOI] [PMC free article] [PubMed] [Google Scholar]
- 6.Hing E, Burt CW. Characteristics of office-based physicians and their medical practices: United States, 2005–2006. Vital Health Stat 13. 2008 Apr;(166):1–34. [PubMed] [Google Scholar]
- 7.Miller RH, Sim I. Physicians’ Use Of Electronic Medical Records: Barriers And Solutions. Health Aff. 2004 Mar 1;23(2):116–126. doi: 10.1377/hlthaff.23.2.116. [DOI] [PubMed] [Google Scholar]
- 8.Miller RH, West C, Brown TM, Sim I, Ganchoff C. The Value Of Electronic Health Records In Solo Or Small Group Practices. Health Aff. 2005 Sep 1;24(5):1127–1137. doi: 10.1377/hlthaff.24.5.1127. [DOI] [PubMed] [Google Scholar]
- 9.DesRoches CM, Campbell EG, Rao SR, et al. Electronic Health Records in Ambulatory Care – A National Survey of Physicians. N Engl J Med. 2008 Jul 3;359(1):50–60. doi: 10.1056/NEJMsa0802005. [DOI] [PubMed] [Google Scholar]
- 10.Bell DS, Friedman MA. E-Prescribing And The Medicare Modernization Act Of 2003. Health Aff. 2005 Sep 1;24(5):1159–1169. doi: 10.1377/hlthaff.24.5.1159. [DOI] [PubMed] [Google Scholar]
- 11.Grossman JM, Gerland A, Reed MC, Fahlman C. Physicians’ Experiences Using Commercial E-Prescribing Systems. Health Aff. 2007 May 1;26(3):w393–404. doi: 10.1377/hlthaff.26.3.w393. [DOI] [PubMed] [Google Scholar]
- 12.http://www.cms.hhs.gov/pqri/03_EPrescribingIncentiveProgram.asp. Accessed February 3, 2009
- 13.Fischer MA, Vogeli C, Stedman MR, Ferris TG, Weissman JS. Uptake of electronic prescribing in community-based practices. J Gen Intern Med. 2008 Apr;23(4):358–363. doi: 10.1007/s11606-007-0383-1. [DOI] [PMC free article] [PubMed] [Google Scholar]
- 14.Hing ES, Burt CW, Woodwell DA. Electronic medical record use by office-based physicians and their practices: United States, 2006. Adv Data. 2007 Oct 26;(393):1–7. [PubMed] [Google Scholar]
- 15.Loomis GA, Ries JS, Saywell RM, Jr, Thakker NR. If electronic medical records are so great, why aren’t family physicians using them? J Fam Pract. 2002 Jul;51(7):636–641. [PubMed] [Google Scholar]
- 16.Menachemi N, Brooks RG. EHR and other IT adoption among physicians: results of a large-scale statewide analysis. J Healthc Inf Manag. 2006 Summer;20(3):79–87. [PubMed] [Google Scholar]
- 17.Simon SR, Kaushal R, Cleary PD, et al. Correlates of Electronic Health Record Adoption in Office Practices: A Statewide Survey. J Am Med Inform Assoc. 2007 Jan 1;14(1):110–117. doi: 10.1197/jamia.M2187. [DOI] [PMC free article] [PubMed] [Google Scholar]
- 18.National ePrescribing Patient Safety Initiative. http://www.nationalerx.com/
- 19.Free iScribe Web Tools. http://www.iscribe.com/ePrescribing/free.html.
- 20.Caremark Rx subsidiary working to help doctors write clearer prescriptions. San Antonio Business Journal. 2006 Oct 24; [Google Scholar]
- 21.Ohio Blues, GM Launch E-Rx Initiative. Health Data Management. 2007 (January 22, 2007). http://healthdatamanagement.com/html/news/NewsStory.cfm?articleId=14580.
- 22.Wenner D. Facts at Your Fingertips. The Patriot-News. 2007 Mar 15; [Google Scholar]
- 23.New incentives may speed transition to e-prescribing. ACP Observer. 2006 Oct; [Google Scholar]
- 24.Enrado P. Florida e-prescribing takes fast track. Healthcare IT News. 2007 03/01/07. http://www.healthcareitnews.com/story.cms?id=6643.
- 25.Jha AK, Orav EJ, Li Z, Epstein AM. Concentration and Quality of Hospitals That Care for Elderly Black Patients. Arch Intern Med. 2007 Jun 11;167(11):1177–1182. doi: 10.1001/archinte.167.11.1177. [DOI] [PubMed] [Google Scholar]
- 26.Bell DS, Schueth AJ, Guinan JP, Wu S, Crosson JC. Evaluating the technical adequacy of electronic prescribing standards: results of an expert panel process. AMIA Annu Symp Proc. 2008:46–50. [PMC free article] [PubMed] [Google Scholar]
- 27.Wang CJ, Patel MH, Schueth AJ, et al. Perceptions of Standards-based Electronic Prescribing Systems as Implemented in Outpatient Primary Care: A Physician Survey. J Am Med Inform Assoc. 2009 Apr 23;:M2998. doi: 10.1197/jamia.M2998. [DOI] [PMC free article] [PubMed] [Google Scholar]