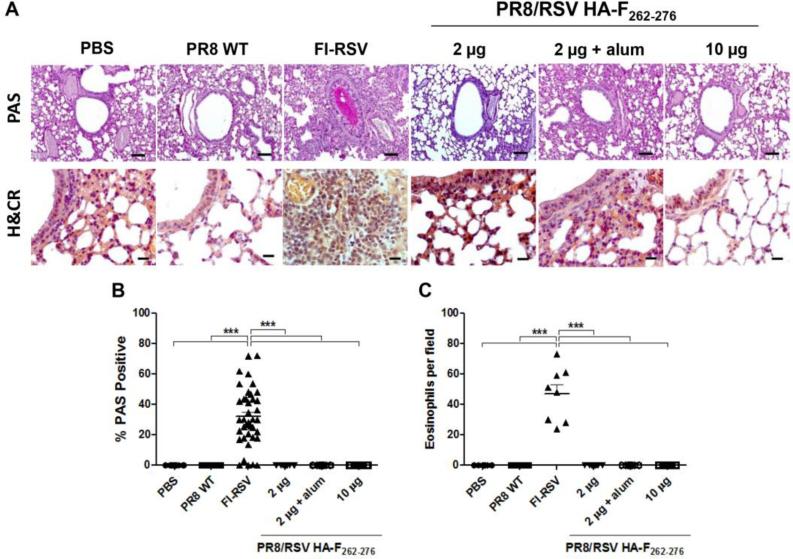
Figure 7. Periodic acid Schiff (PAS) and hematoxylin/Congo Red (H&CR) staining of lung tissues after RSV challenge.
Lung tissues were collected from challenged mice at day 5 p.c. and stained for analysis of mucus production and eosinophil infiltration (n = 5). (A) Photomicrographs of PAS (upper row), and H&CR (lower row) stained lung tissue sections from mice. Scale bars for PAS indicate 100 μm and for H&CR indicate 20 μm. (B) Inflammation scores of PAS staining. PAS-stained lung sections were scored as percentages of 10 individual airways in each mouse. Each dot symbolizes one airway. (C) Inflammation scores of H&CR staining. Eosinophils in lungs per 40× field counts in two different regions of each mouse. Data represent mean ± SEM.

