. 2016 Feb 18;5:e12352. doi: 10.7554/eLife.12352

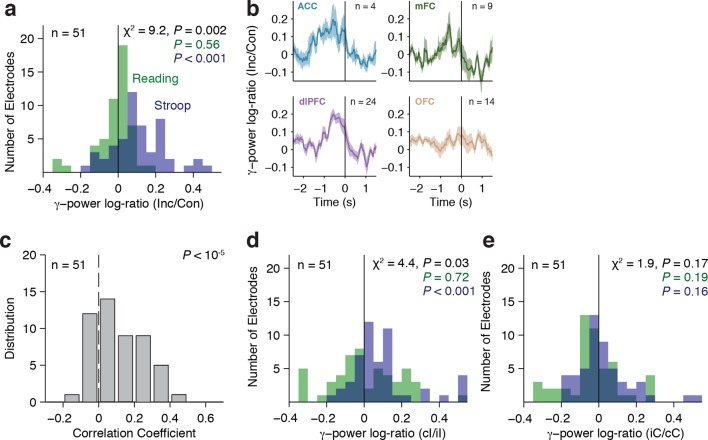
Figure 4. Gamma power in frontal cortex correlates with behavior.

(A) Distribution of gamma power log-ratio (Incongruent/Congruent) for the Stroop task (blue) and Reading task (green). Bin size = 0.05. Gamma power showed a significant interaction between Congruency and Task (P = 0.002, multilevel model, Materials and methods). Power was larger for incongruent versus congruent trials during the Stroop task (P < 0.001, n = 51 frontal cortex electrodes) but not during the Reading task (green, P = 0.56). The statistical analyses directly compare the gamma power, we show the log-ratios here for display purposes only. (B) Normalized gamma power log-ratio averaged across electrodes from each of the four different frontal cortex regions during the Stroop task. We divided the power during incongruent trials by the power during congruent trials, then computed the log and finally averaged across electrodes. Data are aligned to the behavioral response onset (t=0). (C) Distribution of Pearson correlation coefficients between the maximal gamma power and behavioral reaction time during incongruent trials for n = 51 frontal cortex electrodes. These correlations were significantly positive (P < 10–5, sign-rank test). Bin size = 0.1. (D) For incongruent trials, there was a significant interaction between trial history and task (= 0.03, multilevel model). Gamma power was larger for incongruent trials preceded by congruent trials (cI) compared to incongruent trials preceded by incongruent trials (iI), particularly during the Stroop task (blue, P = 0.001), compared to the Reading task (green, P = 0.72). Data beyond the range of the x-axis are shown in the first or last bins. (E) For congruent trials, there was no interaction between trial history and task (P = 0.17, multilevel model). Gamma power was similar in congruent trials preceded by incongruent trials (iC) compared to congruent trials preceded by congruent trials (cC) during the Stroop task (blue, P = 0.16) and during the Reading task (green, P = 0.19).

DOI: http://dx.doi.org/10.7554/eLife.12352.012

Figure 4—source data 1. Population gamma-power data.
DOI: 10.7554/eLife.12352.013

Figure 4.

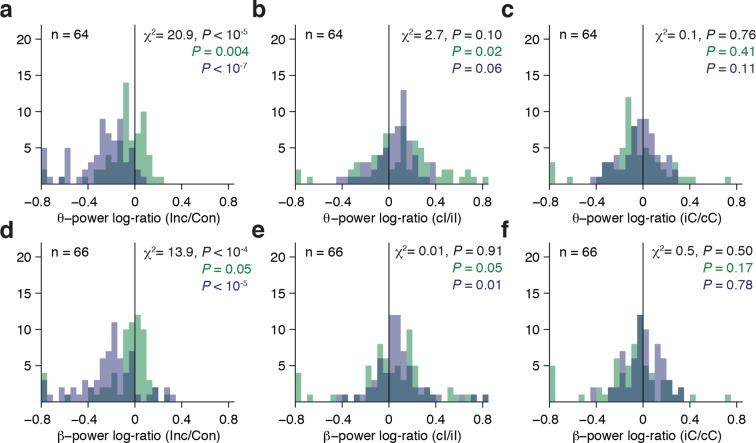
Figure 4—figure supplement 1. Theta and Beta band population results.

Figure 4—figure supplement 1.

(A) Distribution of theta power log-ratio (Incongruent/Congruent) for the Stroop task (blue) and Reading task (green). Bin size = 0.05. P values in black denote interaction statistics whereas P values in blue and green denote the statistics for the Stroop and Reading tasks respectively. As discussed in Figure 4, the average log-ratios are presented here for display purposes only and the statistical tests are based on the raw power values. (B) Distribution of the gamma power log-ratio between incongruent trials preceded by congruent trials (cI) compared to incongruent trials preceded by incongruent trials (iI). (C) Distribution of the gamma power log-ratio between congruent trials preceded by incongruent trials (iC) compared to congruent trials preceded by congruent trials (cC). (D-F) Same as (A-C), but for power in the beta band.
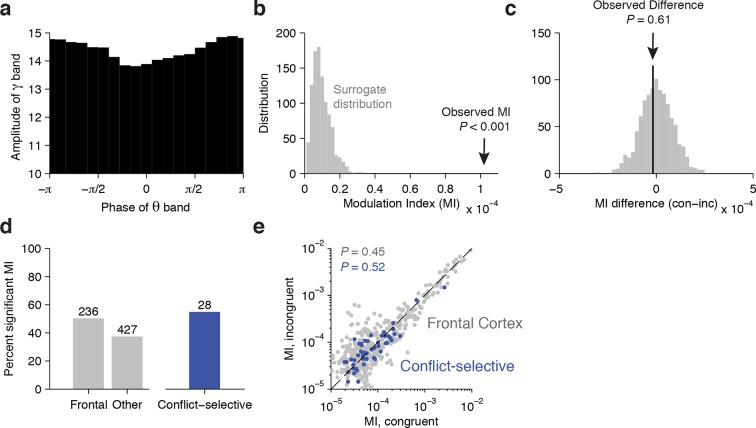
Figure 4—figure supplement 2. Cross-frequency coupling analyses.

Figure 4—figure supplement 2.

For the anterior cingulate cortex electrode in Figure 2: (A) Phase-amplitude distribution during the Stroop task for the example electrode shown in Figure 2 (see Materials and methods for calculation of cross-frequency coupling). (B) The observed Modulation Index (MI, black arrow) is significantly greater than the surrogate distribution generated by adding a lag between the phase and amplitude measurements, demonstrating that the amplitude of the gamma band is strongly coupled to the phase of the theta band. (C) During the Stroop task, the difference in Modulation Index between congruent and incongruent trials (black arrow) was not significantly different from 0 (P = 0.61). The null distribution (gray bars) was generated by randomly permuting the congruent and incongruent labels. Across the population of electrodes: (D) The percent of total electrodes in each region (Frontal cortex or non-frontal cortex) that had significant phase-amplitude coupling. Shown on the right is the percentage of the n = 51 conflict selective electrodes that showed significant coupling. (E) The MI of congruent compared to incongruent trials for all Frontal cortex electrodes (gray dots) and the subset that were conflict-selective in the gamma band (blue dots). For both groups, there was no significant difference in the MI between congruent and incongruent trials (Frontal Cortex, P = 0.45; Conflict-selective, P = 0.52; signed-rank test). For this comparison, the number of congruent and incongruent trials was equalized before computing the MI.
Figure 4—figure supplement 3. Stimulus-aligned population averages.
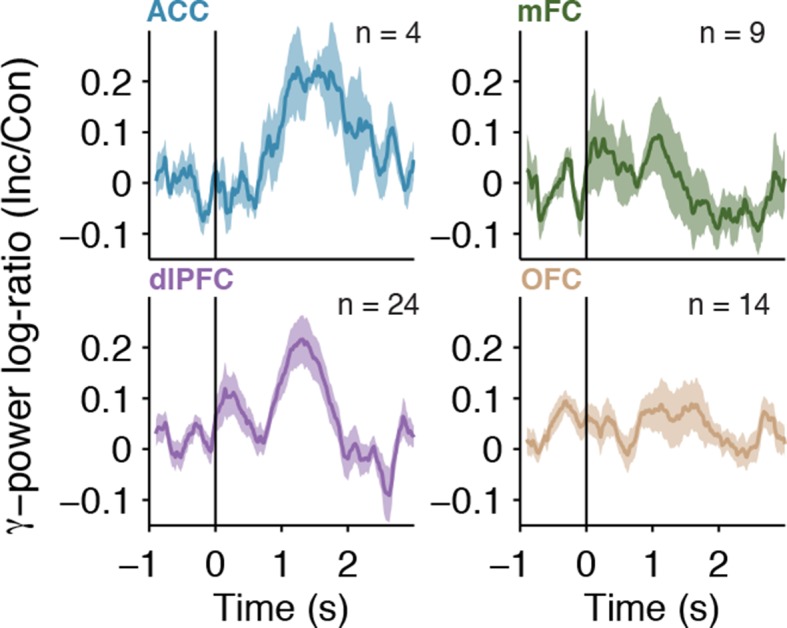
Figure 4—figure supplement 3.

Same as in Figure 4B, but data are aligned to the stimulus response onset (t=0).