. 2016 Mar 17;5:e12116. doi: 10.7554/eLife.12116

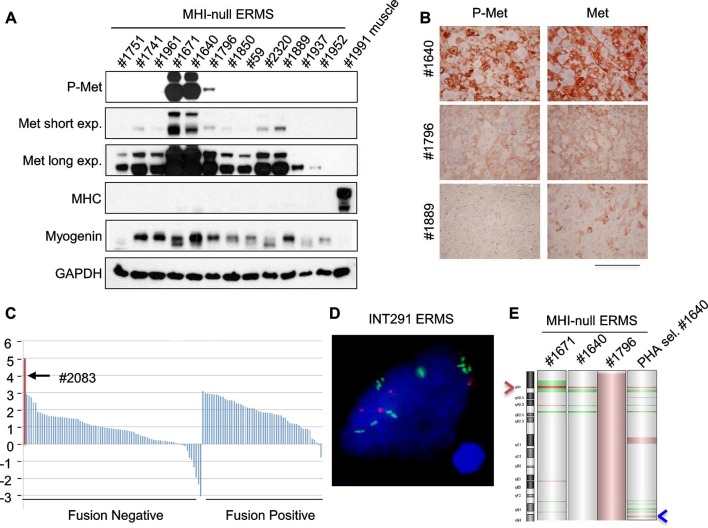
Figure 5. Only a minor fraction of ERMS harbors MET amplification.

(A) Western blot analysis in a panel of primary murine MHI-null ERMS probed for the indicate proteins. (B) Immunohistochemical analysis of primary murine MHI-null ERMS shown in A, probed for Met and phosphorylated Met. (Scale bar = 100 µm). (C) Waterfall plot showing the MET Z-score expression from a panel of previously characterized human RMS tumors (Shern et al., 2014) (http://pob.abcc.ncifcrf.gov/cgi-bin/JK). The exceptionally high MET expression in Patient 2083 (highlighted) is associated with focal amplification of chromosome 7q31.2 (Shern et al., 2014). (D) FISH for MET in a human ERMS sample (INT291) characterized by small cluster signals (with an average of 9 signals per cell; MET is labeled in green and centromeres in red). (E) CGH analysis of murine MHI-null ERMS. Red indicates copy number gain, green indicates copy number loss. Arrowheads mark the Met (red) and Kras (blue) loci.

DOI: http://dx.doi.org/10.7554/eLife.12116.011

Figure 5.

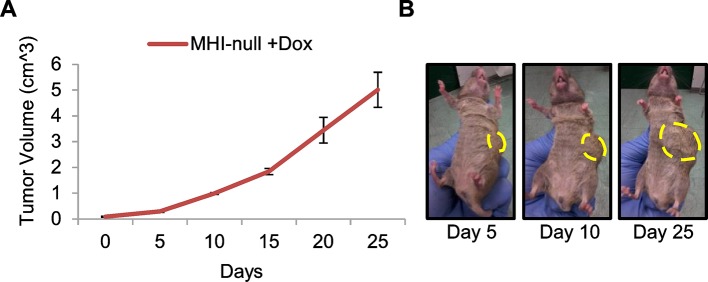
Figure 5—figure supplement 1. Transgenic Hgf downmodulation does not impair tumor growth.

Figure 5—figure supplement 1.

(A) Growth curve (mean ± SEM) of tumors in MHI-null mice treated with Dox when tumors became palpable (n=3). (B) Representative images of a MHI-null mouse described in A.
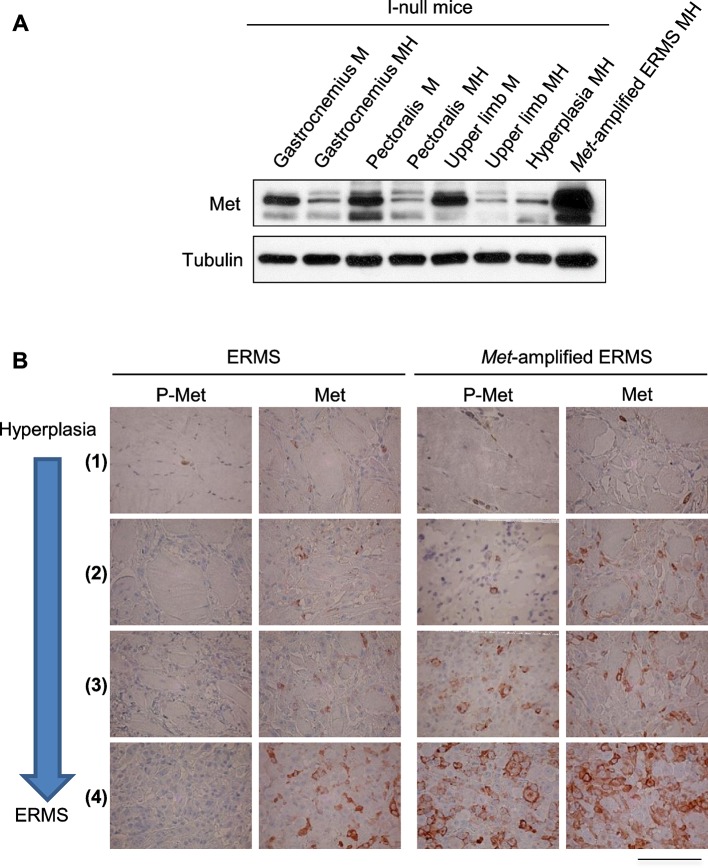
Figure 5—figure supplement 2. Determination of the level of Met protein and phosphorylation in rhabdomyosarcomagenesis.

Figure 5—figure supplement 2.

(A) Western blot analysis in the indicated samples of control (MI-null) and MHI-null mice, probed for the indicate proteins. (B) Representative immunohistochemical analysis of Met and P-Met in ERMS carrying or not Met amplification. For the indicated stages of rhabdomyosarcomagenesis see Figure 3D. (Scale bar = 100 µm).
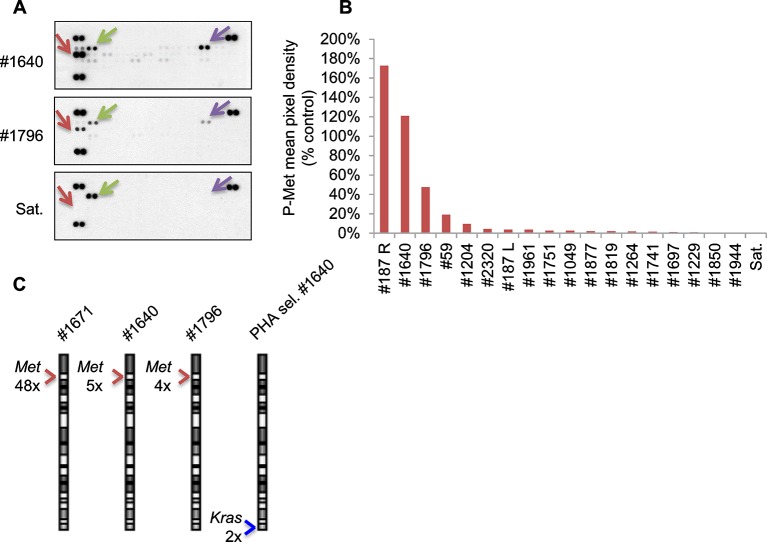
Figure 5—figure supplement 3. Only a minor fraction of murine ERMS displays Met activation and amplification.

Figure 5—figure supplement 3.

(A) Array-based detection of phosphorylated RTKs (p-RTK) in the indicated cell lysates. Arrows indicate duplicate signals for P-Met (in red), P-Erbb2 (in green) and P-Axl (in violet); positive controls are shown on the top left, top right, and lower left corners. (B) Densitometric quantification of P-Met signal detected through p-RTK analysis in the indicated MHI-null ERMS-derived cell lysates. (C) Real-time PCR analysis of Met and Kras relative copy number variation (CNV) performed in the indicated MHI-null ERMS. Arrowheads mark the Met (red) and Kras (blue) loci.
Figure 5—figure supplement 4. Evaluation of Met expression in human RMS datasets.
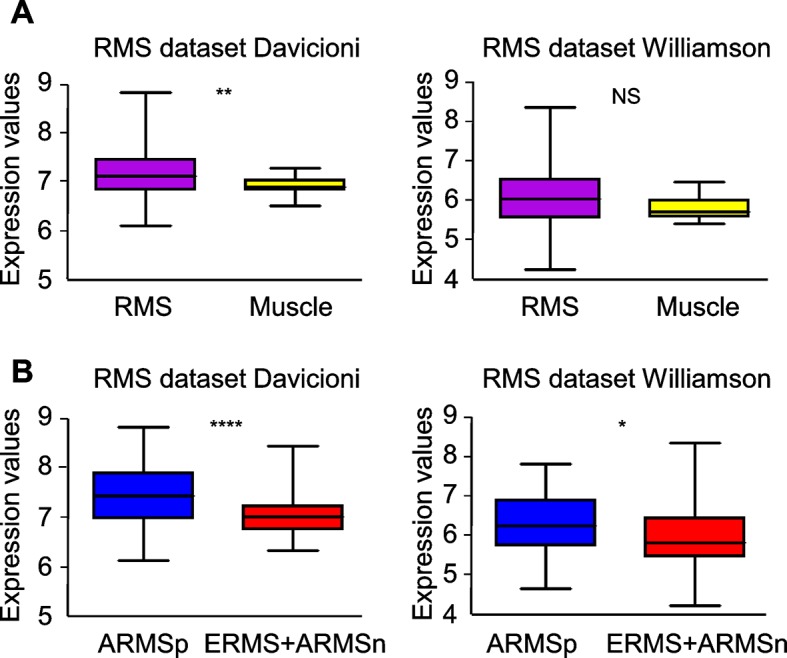
Figure 5—figure supplement 4.

(A) Box plot of MET mRNA expression level in primary human RMS tumors and skeletal muscles in the indicated datasets. NSp>0.05; **p<0.01; (t test). (B) Box plot of MET mRNA expression level in human ARMSp tumors and in ERMS+ARMSn tumors in the indicated datasets. *p<0.05; ****p<0.0001 (t test).