

Abstract
Glioblastoma multiforme (GBM) is the most aggressive human primary brain cancer. Using a Trp53-deficient mouse model of GBM, we show that genetic inactivation of the Atm cofactor Atmin, which is dispensable for embryonic and adult neural development, strongly suppresses GBM formation. Mechanistically, expression of several GBM-associated genes, including Pdgfra, was normalized by Atmin deletion in the Trp53-null background. Pharmacological ATM inhibition also reduced Pdgfra expression, and reduced the proliferation of Trp53-deficient primary glioma cells from murine and human tumors, while normal neural stem cells were unaffected. Analysis of GBM datasets showed that PDGFRA expression is also significantly increased in human TP53-mutant compared with TP53-wild-type tumors. Moreover, combined treatment with ATM and PDGFRA inhibitors efficiently killed TP53-mutant primary human GBM cells, but not untransformed neural stem cells. These results reveal a new requirement for ATMIN-dependent ATM signaling in TP53-deficient GBM, indicating a pro-tumorigenic role for ATM in the context of these tumors.
DOI: http://dx.doi.org/10.7554/eLife.08711.001
Research Organism: Human, Mouse
eLife digest
Glioblastomas are the most common and aggressive brain cancers in adults, and currently lack efficient treatment options. Glioblastoma cells contain genetic mutations that enable them to grow and divide more quickly than they would under normal conditions. The occurrence of these mutations often leads to a functional impairment in so-called 'tumor suppressor' proteins that may have a range of roles, including repairing genetic damage or controlling the rate of cell division.
Blake et al. have now studied how some of these tumor suppressor proteins interact. Deleting a prominent tumor suppressor called TP53 from the brain of mice caused these animals to develop glioblastomas. If, however, both TP53 and another tumor suppressor called ATMIN were deleted at the same time, the majority of mice did not develop any brain tumors. Further in-depth profiling of these brain tumor cells revealed that TP53-deleted cells had very high levels of the oncogene PDGFRA, which causes cells to divide more rapidly. These high PDGFRA levels were brought back to normal conditions upon deletion of ATMIN.
Blake et al. then studied primary human glioblastoma cells that lack TP53 and found that these cells could be efficiently killed by a combination of drugs that block the activity of PDGFRA and the protein ATM, which is known to work in concert with ATMIN. Importantly, this combination of drugs did not adversely affect healthy brain cells, opening up new strategies and potential treatment options for glioblastoma patients.
Introduction
Glioblastoma multiforme (GBM) is the most common and aggressive form of primary brain cancer in adults. Despite improvements in clinical care, a rapid disease progression and insufficient understanding of the etiology of these tumors results in very poor survival prognosis. The standard treatment for GBM patients involves a combination of the DNA damaging agent temozolomide together with radiotherapy (Stupp et al., 2005). However, the benefits of current treatment regimes come with severe side effects for patients, as well as drug resistance and inevitable recurrence of the tumor (Wen and Kesari, 2008).
Over recent years, great efforts by individual research groups and consortia have shed light on the key genetic events that lie at the heart of human GBM formation, raising the possibility of a more targeted approach to therapy. This has identified activation of growth factor receptor signaling (for example by amplification or overexpression of the PDGF receptor) and direct or indirect inactivation of the TP53 and retinoblastoma tumor suppressors as core deregulated pathways in human GBM (Cancer Genome Atlas Research Network, 2008). Unfortunately, many of these pathways are difficult to target pharmacologically in vivo, and for others, like PDGFR signaling, available inhibitors have so far lacked clinical impact (Wen et al., 2006; Rich et al., 2004). Hence, an important goal of GBM research is to identify novel, more effective therapies to generate better outcomes.
One of the central determinants of tumor progression and the response to therapy is the DNA damage response (Lord and Ashworth, 2012). The DNA damage kinase ATM is known primarily as a tumor suppressor, through its role in the response to DNA double-strand breaks (Shiloh and Ziv, 2013), and systemic loss of ATM has previously been shown to accelerate glioblastoma progression (Squatrito et al., 2010). This tumor suppressive role is in line with the activation of the DNA damage response in precancerous lesions as a barrier to tumorigenesis (Bartkova et al., 2005). A recent study has, however, demonstrated loss of ATM signaling to inhibit the growth of TP53-null tumor xenografts, via stabilization of p14ARF (Velimezi et al., 2013), suggesting that ATM function in cancer is highly context-dependent.
As well as its canonical activation at break sites, ATM signaling also occurs in response to other cellular stresses (Bakkenist and Kastan, 2003), and this mode of ATM signaling requires the ATM INteractor ATMIN (Kanu and Behrens, 2007). ATMIN interacts with the ATM kinase in basal conditions and disassociates from ATM in response to ionizing radiation, to allow ATM to interact with the MRN complex at double-strand break sites (Zhang et al., 2014). ATMIN also has ATM-independent functions, most notably the transcriptional activation of Dynll1, a motor protein involved with ciliogenesis and crucial for lung development (Jurado et al., 2012a; Goggolidou et al., 2014). In addition, ATMIN has been shown to counteract oxidative damage in the brain (Kanu et al., 2010) and to protect against B cell lymphomagenesis (Loizou et al., 2011), but its role in other cancer types has not yet been determined.
A key downstream mediator of the DNA damage response pathway, activated by both the double-strand break and ATMIN-dependent responses, is the tumor suppressor TP53. Precancerous lesions in which the DNA damage response is activated are under selective pressure to lose or mutate TP53, and loss of TP53 is known to cooperate with several genes to accelerate tumorigenesis (as summarized in the IARC database [Petitjean et al., 2007]). Among these cooperating changes is loss of ATM, which induces rapid T-cell lymphoma development (Westphal et al., 1997). TP53 is also one of the most commonly mutated genes in human GBM. Consequently, the majority of available mouse models of GBM use deletion of one or both copies of the Trp53 gene in combination with other mutations (Chen et al., 2012). Overexpression of the Pdgf receptor ligand Pdgfrb in adult Nestin-positive neural stem cells, for instance, results in glioma formation, which is accelerated in a Trp53-mutant background (Squatrito et al., 2010).
In this study, we demonstrate that congenital loss of Trp53 in the mouse brain is sufficient to precipitate spontaneous glioblastoma formation, and that this correlates with upregulation of Pdgfra. Further, we show that ATMIN plays a critical role in GBM formation, promoting Pdgfra protein and gene expression in a Trp53-deficient background, using an in vivo glioma model as well as neural stem cell and primary tumor cell cultures. Importantly, we find that these results are translatable to therapeutic ATM inhibition in human patient-derived GBM stem cells, and that combining ATM inhibition with PDGFRA inhibition results in synergistic tumor cell killing with minimal effects on untransformed cells.
Results
Glioblastomas develop at high frequency in p53ΔN (Trp53 mutant) mice
Loss of TP53 is one of the earliest occurring events in human GBM initiation (Maher et al., 2001; Wang et al., 2009; Ohgaki et al., 2004; Mazor et al., 2015; Johnson et al., 2014). This inevitably results in the accumulation of a plethora of secondary hits, which, after a long latency period, leads to tumor formation. To recapitulate this chain of events in mice, we deleted Trp53 as an initial driver during neural development (using p53f/f; Nestin-Cre (p53ΔN) mice) and monitored brain tumor formation in late adult life. After 8 months, brain tumors arose in p53ΔN mice with high penetrance (Figure 1A and B), similar to previous observations using an hGFAP-Cre model (Wang et al., 2009). Animals began to show neurological symptoms including reduced movements and tremor at an average age of 263 days. When examined histologically, many p53ΔN tumors had features consistent with WHO classification criteria for Grade IV GBM (Figure 1C). Out of 17 animals, 14 (82%) showed diffusely infiltrative astrocytic brain tumors, the majority of which were classified as GBM by independent analysis (57% Grade IV, glioblastoma; 29% Grade III, anaplastic astrocytoma; 14% Grade II, fibrillary astrocytoma), while one displayed an osteosarcoma (Figure 1B and D, Figure 1—figure supplement 1 and Supplementary file 1). p53ΔN GBMs displayed pseudopalisading necrosis (i), microvascular proliferation with endothelial hyperplasia (ii) and occasional endovascular thrombosis (iii), hallmarks of human GBM tumors (Figure 1E [i–iii]). The markers Gfap (iv), Nestin (v), and Olig2 (vi) were expressed in all tumors, while they were negative for the neuronal marker NeuN, supporting the diagnosis of glioma (Figure 1E (iv–vi) and Figure 1—figure supplement 2). Intertumoral and intratumoral heterogeneity, a classic hallmark of high-grade gliomas, was also frequently observed (Figure 1F). These data indicate that early embryonic loss of Trp53 in the brain is sufficient to promote GBM formation. The long latency of these tumors, together with the genome instability and transcriptional changes known to be induced by loss of Trp53, indicated that these gliomas almost certainly develop as a result of secondary mutations arising in the Trp53-null brain. In line with this notion, mouse SNP array data revealed large chromosomal gains and losses (typical tumorigenic genetic changes) in four out of five analyzed p53ΔNgliomas, whereas no changes were detected in one wt and three Trp53-deficient non-tumorigenic control NS cells (Figure 1—figure supplement 3). These secondary hits are not congenitally predefined and thus possibly allow a better representation of the genetic diversity of the disease in patients. In addition, the high frequency of brain tumor formation, proportion of high-grade tumors, and consistency of tumor latency on a mixed genetic background make this a valuable GBM model.
Figure 1. Loss of Trp53 is sufficient to induce GBM with high penetrance.
(A) Kaplan-Meier curves showing tumor-free survival in p53f/f; Nestin-Cre (p53ΔN) and control Nestin-Cre mice. (B) Status of mouse cohorts at 450 days, showing tumor incidence. (C) H&E-stained p53ΔN brain tumor sections showing histological features of malignant GBM. Arrowheads indicate (i) a mitotic cell, (ii) neo-vascularization, (iii) rosetta formation, (iv) mitotic catastrophe, (v) a multinucleated giant cell, and (vi) large areas of necrosis. (D) Grades of gliomas for p53ΔN mice. (E) Examples of human GBM hallmarks observed in p53ΔN tumors: pseudopalisading necrosis (i), microvascular proliferation with endothelial hyperplasia (ii), and endovascular thrombosis (iii) (all H&E). Immunohistochemistry shows expression of the glial markers GFAP (iv), NESTIN (v), and OLIG2 (vi) in p53ΔN tumors. (F) p53ΔN glioblastomas display high inter- and intra-tumoral heterogeneity. H&E images i-ii, iii-iv, and v-vi represent different regions of the same tumors #1, #2, and #3 respectively. GBM, Glioblastoma multiforme.

Figure 1—figure supplement 1. Histological features of lower grade tumors observed in p53ΔN animals.

Figure 1—figure supplement 2. Histological features of glioblastomas observed in p53ΔN animals.

Figure 1—figure supplement 3. SNP array analysis on primary cells derived from GBM bearing p53ΔN, non-tumor bearing p53ΔN , and wild-type (wt) animals.

Figure 1—figure supplement 4. Table representing CGHcall output for SNP array analysis compressed to comparable regions between arrays in the series.

Loss of Atmin strongly suppresses GBM formation in the p53ΔN model
As an integral part of the response to genomic stress, activation of the DNA damage response pathway typically represents a barrier to tumorigenesis. Consistent with this, it has previously been shown that loss of the DNA damage kinase Atm accelerates tumorigenesis in a Pdgf-driven glioblastoma model (Squatrito et al., 2010). In addition, deletion of the Atm cofactor Atmin promotes B cell lymphomagenesis (Loizou et al., 2011). Whether loss of Atmin affects tumorigenesis in other cancer types is so far unknown. To investigate the potential role of Atmin in glioma formation, we crossed AtminΔN mice (Kanu et al., 2010) with p53ΔN mice. Strikingly, AtminΔN; p53ΔN mice showed significantly longer tumor-free survival than p53ΔNanimals (p<0.0002) (Figure 2A). The largest proportion of AtminΔN; p53ΔNmice (43%) did not develop any signs of sickness and were still alive after 450 days; a further 36% succumbed either to non-tumor-related illness or, in one case, a pancreatic tumor (Figure 2B and Supplementary file 1). Only three animals out of a cohort of 14 AtminΔN; p53ΔNdouble mutants (21%) initiated glial tumors (Figure 2B), compared with 82% of p53ΔNmice over the same period. The three GBMs arising in AtminΔN; p53ΔNdouble-mutant mice arose later but were histologically similar to those observed in p53ΔN mice (Figure 2—figure supplement 1), and did not escape Atmin deletion, suggesting that the requirement for Atmin can eventually be overcome, but only in a small proportion of cases. Importantly, central nervous system deletion of Atmin alone (AtminΔN) did not affect brain morphology or histology (Kanu et al., 2010) and the mice remained tumor free (Figure 2A). Thus, Atmin deletion strongly suppresses GBM formation in p53ΔN animals.
Figure 2. Loss of Atmin rescues GBM formation in p53ΔN brains.
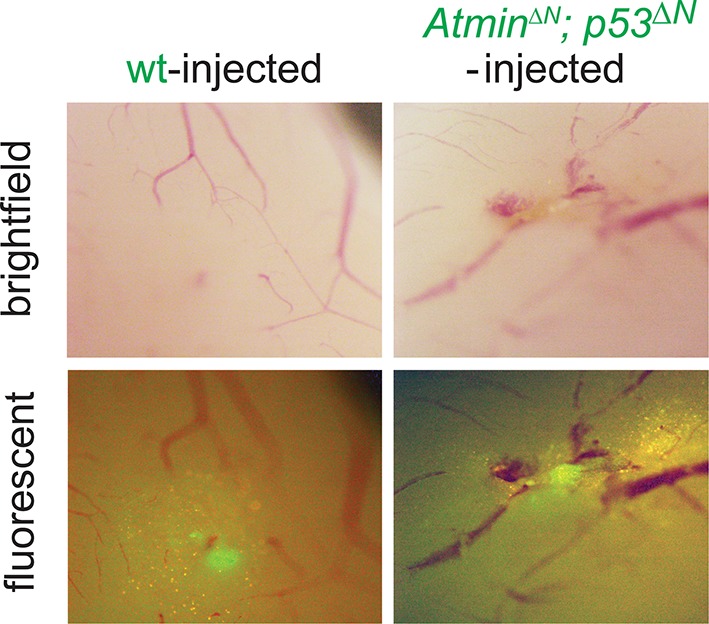
(A) Kaplan-Meier curves showing tumor-free survival in AtminΔN and AtminΔN; p53ΔN mice. p53ΔN curve from Figure 1A (same experiment) is shown for comparison. (B) Status of mouse cohorts at 450 days, showing tumor incidence. (C) Atmin loss rescues the increased proliferation of p53ΔN NSCs. (D) Mean percentage of BrdU-positive NSCs from the indicated genotypes, assessed by FACS following a 2-hr BrdU pulse. (E) Mean number of DAPI-permeable (non-viable) cells after IR or (F) hypoxia, showing sensitivity of AtminΔN; p53ΔN NSCs to hypoxia but not IR. n.s., not significant; * p<0.05, ** p<0.01. (G) Scheme of orthotopic NSC transplant experiment (left) and Kaplan-Meier curves indicating survival of NOD/SCID mice orthotopically transplanted with p53ΔN and AtminΔN; p53ΔN NSCs (right). Error bars represent the SEM of three biological repeats, and two biological repeats for (E). IR, Ionizing radiation; NSC, Neural stem cell.

Figure 2—figure supplement 1. Histological features of glioblastomas observed in p53ΔN and AtminΔN; p53ΔN animals.

Figure 2—figure supplement 2. Examples of murine neural stem cells in culture.
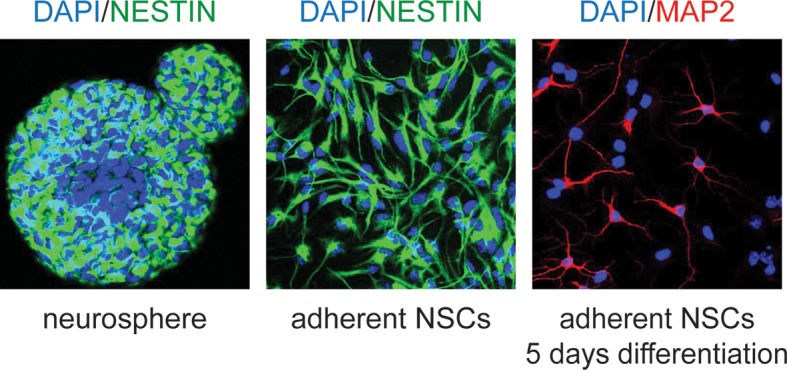
Figure 2—figure supplement 3. AtminΔN NSCs proliferate at a similar rate as wild-type NSCs.
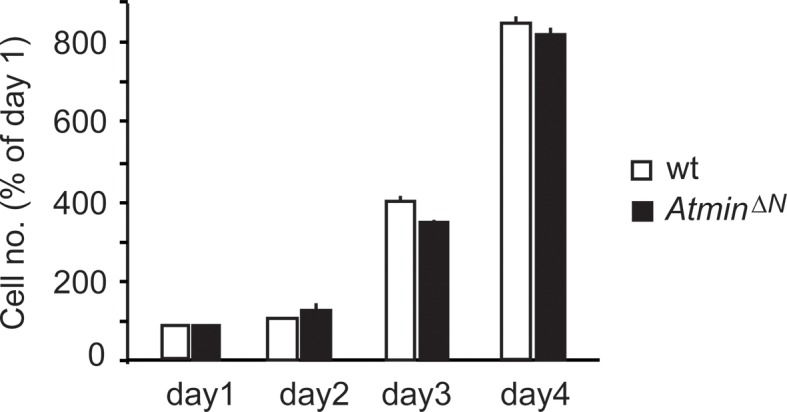
Figure 2—figure supplement 4. Gross genome stability is unaffected in Atmin/Trp53 double mutant NSCs.

Figure 2—figure supplement 5. Radiation-induced arrest is similarly impaired in Trp53-mutant and Atmin/Trp53 double mutant NSCs.
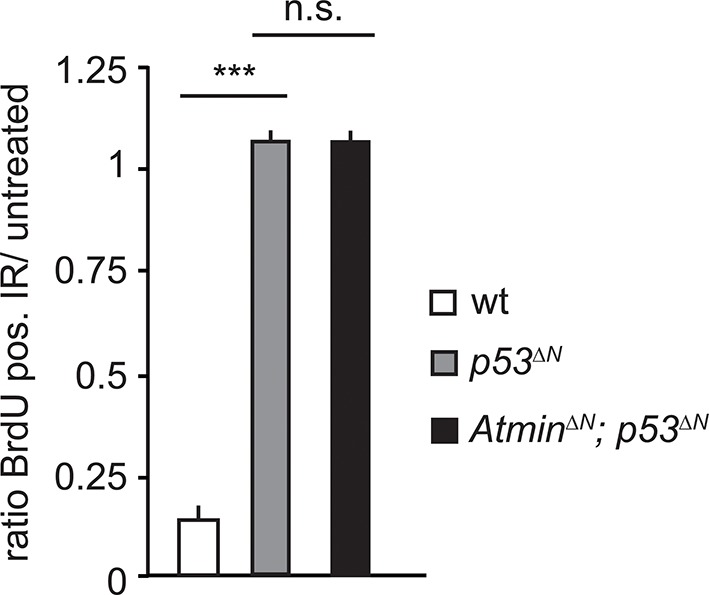
Figure 2—figure supplement 6. Tumors arising from orthotopic injection of NSCs are Nestin and Ki67-positive.
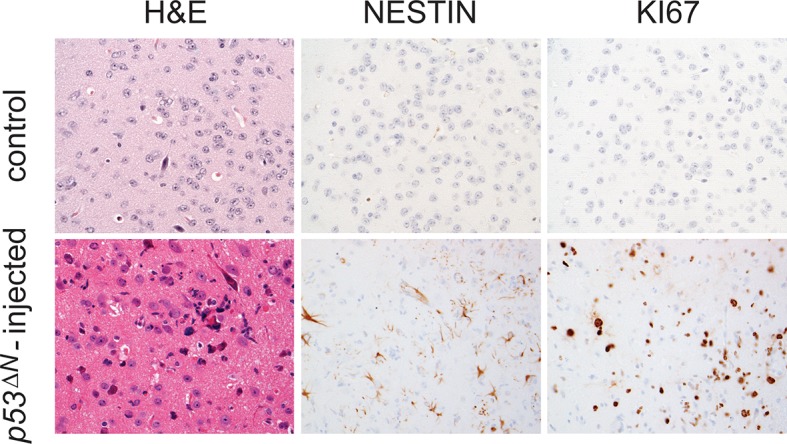
Figure 2—figure supplement 7. Asymptomatic AtminΔN; p53ΔN-injected animals show persistent GFP-positive cells.
Atmin loss rescues hyperproliferation and sensitivity to hypoxia in p53ΔNNSCs
Loss of Trp53 affects diverse fundamental cellular processes including proliferation, genome stability, cell cycle arrest, and apoptosis (Vousden and Lane, 2007). To understand the involvement of Atmin in the suppression of the Trp53-null phenotype, we isolated neural stem cells (NSCs) (Figure 2—figure supplement 2) from p53ΔNembryos and tested the effect of Atmin loss on these processes. p53ΔNNSCs proliferated more rapidly than wild-type (wt) controls. This proliferative advantage, however, was rescued in AtminΔN; p53ΔN NSCs (Figure 2C and D), indicating that Atmin is required for the hyperproliferation of Trp53-deficient NSCs. Loss of Atmin alone did not alter proliferation of NSCs (Figure 2—figure supplement 3). FACS profiling of p53ΔN and AtminΔN; p53ΔN NSCs revealed a decrease in the proportion of AtminΔN; p53ΔN cells in S phase compared with p53ΔN NSCs, in agreement with the reduced proliferation rate, but no change in cells with a >4n DNA content, and metaphase spreads at passage 10 revealed no obvious difference in ploidy (Figure 2—figure supplement 4). We analyzed cell cycle arrest and cell death in response to ionizing radiation (IR) by quantifying the percentage of BrdU-incorporating and DAPI-permeable NSCs respectively. As expected, p53ΔN NSCs arrested less efficiently than wt NSCs and cell death was reduced; but cell cycle arrest and cell death were not rescued in AtminΔN; p53ΔN NSCs (Figure 2E and Figure 2—figure supplement 5). In addition to IR-induced cell death, p53ΔN NSCs were more resilient to hypoxia-induced death, consistent with previous studies (Liu et al., 2007; Graeber et al., 1996). Atmin deletion in these cells re-sensitized them to hypoxia, to similar levels as wt NSCs (Figure 2F). Thus, loss of Atmin is able to rescue some of the phenotypes of Trp53 loss, such as hyperproliferation and hypoxia induced death, but not others, such as IR-induced cell cycle arrest and cell death.
Loss of Atmin impairs the tumorigenicity of neural stem cells in orthotopic transplants
As increased proliferation and hypoxia resistance are attributes commonly found in tumor initiating cells of solid tumors, including glioma (Graeber et al., 1996; Gilbertson and Rich, 2007), we evaluated the tumorigenic potential of p53ΔN and AtminΔN; p53ΔN NSCs in vivo. We performed intracranial injections of NSCs isolated from wt, p53ΔN, and AtminΔN; p53ΔNembryos (Figure 2G). Five out of five animals injected with p53ΔN NSCs died within 93 days post-injection, while four out of five wt and three out of four p53ΔN; AtminΔNNSC-injected animals were still alive even at 155 days, the endpoint of the experiment (Figure 2G). Histologically, injected cells appeared as atypical glial cells expressing Nestin and Ki67, diffusely infiltrating the host brain (Figure 2—figure supplement 6), similar to previous observations with human GBM xenografts (Stricker et al., 2013). Fluorescent imaging of asymptomatic mice at the experimental endpoint readily detected injected AtminΔN; p53ΔN and wt NSCs (Figure 2—figure supplement 7), suggesting that these cells survived in the host brain, but did not induce lethality. Thus, genetic inactivation of Atmin greatly impairs the tumorigenic potential of p53ΔNcells.
Atmin loss normalizes expression of the proto- oncogene Pdgfra in p53ΔN NSCs
To understand the molecular basis of the observed attenuation of tumorigenic potential, we performed gene expression profiling on wt, p53ΔN, and AtminΔN; p53ΔNembryonic NSCs. Compared with wt NSCs, 145 genes were downregulated more than 1.5-fold in p53ΔN, whereas 77 were overexpressed (Figure 3A). Many of the canonical Trp53 target genes, such as Bax, Puma, and Cdkn1a, were downregulated to a similar extent in AtminΔN; p53ΔN compared with p53ΔNNSCs. However, 27% of genes deregulated in p53ΔNNSCs returned to wt expression levels when Atmin was also deleted (36/145 of the decreased, and 24/77 of the increased genes; examples in Figure 3B). When this subset of genes ‘rescued’ in double mutant NSCs was queried against the Cancer Genome Atlas (TCGA) database, in several cases abnormal levels of these transcripts were found to be associated with human GBM (Cancer Genome Atlas Research Network, 2008; Suvasini et al., 2011). Particularly notable among this list was the platelet-derived growth factor receptor alpha (Pdgfra) (Figure 3C). Elevated levels of PDGFRA have been observed in human gliomas of various malignancy grades (Engström et al., 2012), and increased PDGFR signaling has been shown to induce glioma-like growths in vivo (Jackson et al., 2006). Increased PDGFRA levels are also a characteristic hallmark of the proneural GBM subtype as classified in (Brennan et al., 2013; Verhaak et al., 2010). Interestingly, we found that p53ΔNNSCs were associated most closely with the proneural subtype when comparing the microarray expression profile from the murine NSCs to that of publically available human GBM samples from TCGA (Verhaak et al., 2010) (Figure 3—figure supplement 1), which is in agreement with elevated Pdgfra mRNA as well as protein levels (Figure 3D). This increased protein expression was also apparent in high-grade GBMs from endstage p53ΔNanimals (Figure 3E and Figure 3—figure supplement 2). Other growth factor receptors, like Egfr, and proteins commonly deregulated in glioma including Rb, Pten, Cyclin D2, Junc, and Cdk4 (Wang et al., 2009) remained unaltered in p53ΔNcells and tumors (Figure 3—figure supplements 2 and 3), as did the closely related Pdgf receptor Pdgfrb and the receptor ligands Pdgfa and Pdgfb (Figure 3—figure supplement 4).
Figure 3. Atmin regulates Pdgfra expression in a mutant Trp53 background.
(A) Heatmap showing genes deregulated more than 1.5-fold in Trp53 null NSCs and their corresponding expression in AtminΔN; p53ΔN double null NSCs. (B, C) qRT-PCR validation of GBM implicated genes that show deregulated expression in p53ΔN but not AtminΔN; p53ΔN NSCs. (D) Elevated Pdgfra protein expression in p53ΔN but not AtminΔN; p53ΔN NSCs. Corresponding p-Akt and total Akt levels were probed to analyze pathway activation. Actin was used as loading control. (E) Tumor section from a GBM arising from a p53ΔN animal showing elevated Pdgfra expression. 'N' denotes the normal brain region adjacent to the tumor mass. Dotted lines indicate tumor border. (F) Myc-Atmin overexpression increases expression of Pdgfra mRNA in AtminΔN; p53ΔN but not wt cells. (G) Myc-Atmin overexpression increases Pdgfra protein levels in AtminΔN; p53ΔN NSCs. Tubulin was used as loading control. (H) Atmin silencing using two independent shRNA constructs reduces Pdgfra expression, assessed by qRT-PCR. (I) Stable Pdgfra silencing using two independent shRNA constructs reduces primary tumor cell proliferation, measured using IncuCyte timelapse microscopy. Error bars represent the SEM of at least three biological repeats and two biological repeats in (I).* p<0.05, ** p<0.01, *** p<0.001. NSC, Neural stem cell

Figure 3—figure supplement 1. The transcriptional profile of p53ΔN NSCs is most closely related to the human proneural GBM subtype, relative to expected distances.

Figure 3—figure supplement 2. Pdgfra expression is elevated in p53ΔNtumors, but Egfr is not.
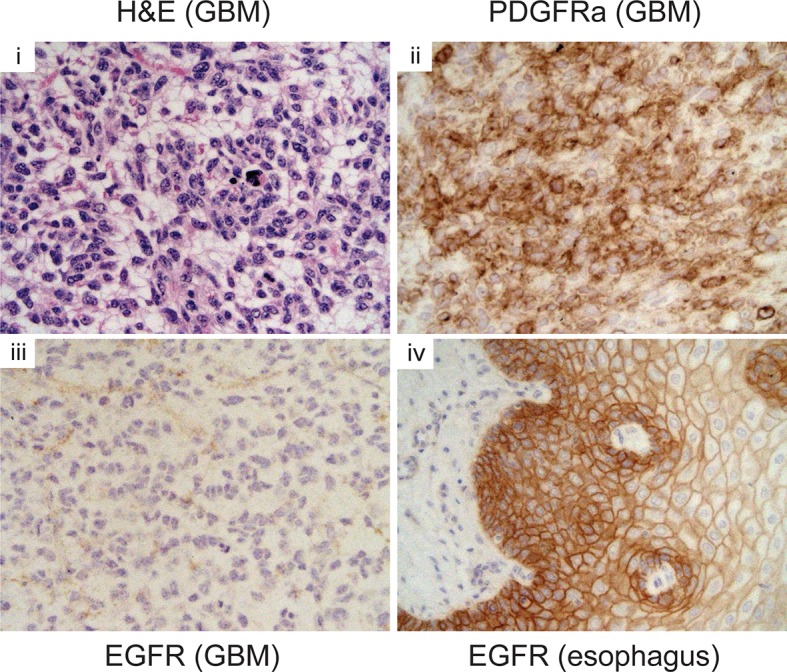
Figure 3—figure supplement 3. Some markers frequently altered in GBM are unaltered in p53ΔN NSCs.
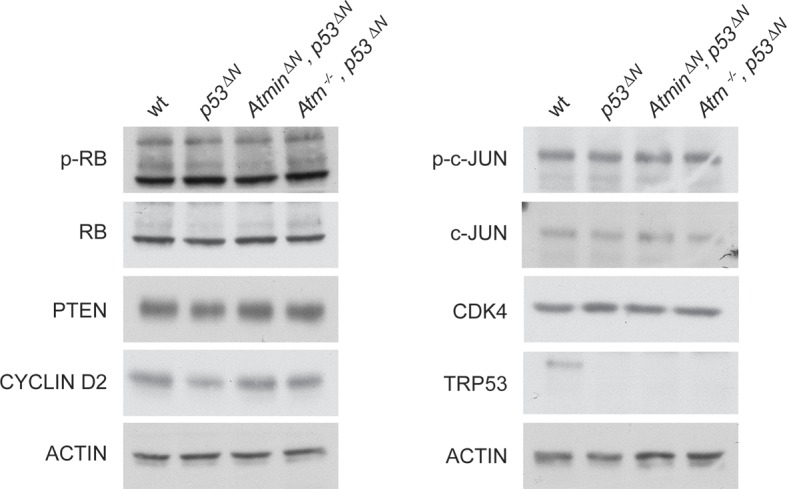
Figure 3—figure supplement 4. Pdgf ligand expression is not significantly altered in p53ΔN NSCs.
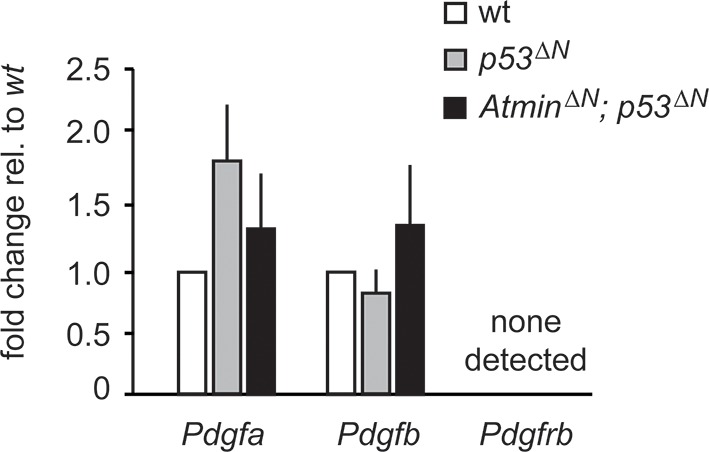
Figure 3—figure supplement 5. Two independent shRNAs cause Pdgfra knockdown.

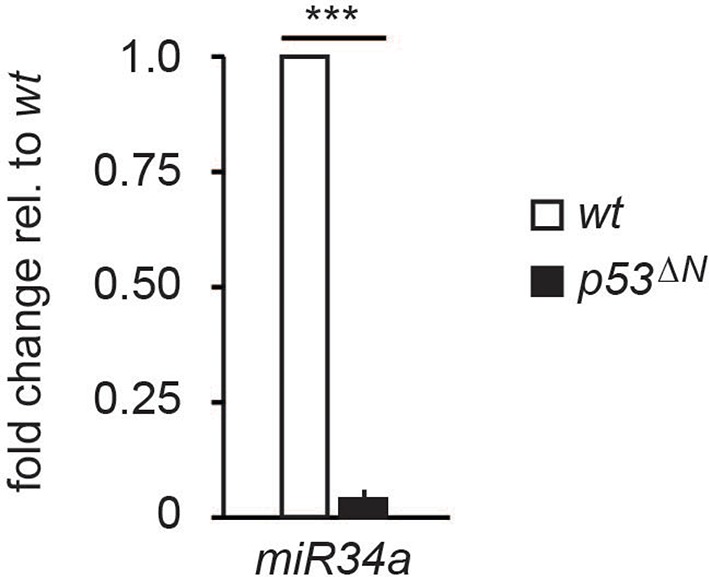
Figure 3—figure supplement 6. miR34a expression is reduced in p53ΔN NSCs.
Importantly, deletion of Atmin together with Trp53 completely rescued the elevated Pdgfra expression, reducing it to wild-type levels (Figure 3C and D). Overexpression of tagged Atmin in double mutant NSCs restored elevated Pdgfra expression at both the mRNA and protein levels (Figure 3F and G), while acute silencing of Atmin in p53ΔNNSCs, using two independent shRNA constructs, reduced Pdgfra levels (Figure 3H), implying that sustained Pdgfra upregulation in p53ΔNNSCs constantly requires Atmin function to maintain increased Pdgfra expression. Thus, interference with Atmin function is sufficient to reduce Pdgfra overexpression in Trp53-deficient cells.
To assess whether Trp53 null tumors require sustained Pdgfra overexpression, we isolated primary tumor cells from GBM-bearing p53ΔNmice and induced stable knockdown of Pdgfra using shRNA (Figure 3—figure supplement 5). This resulted in a significant decrease in the proliferation rate of these primary tumor cells (Figure 3I), emphasizing the importance of Atmin function in supporting elevated Pdgfra expression in p53ΔNgliomas.
Pdgfra overexpression is reversible with pharmacological Atm inhibition
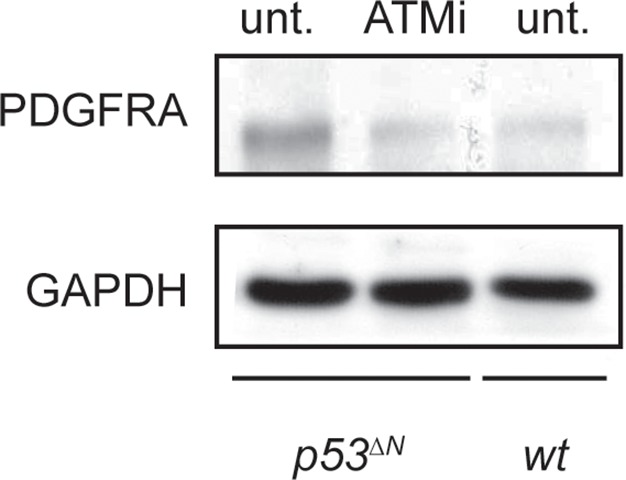
Atmin has two known functions: an Atm-dependent function, in which Atmin interacts with Atm and is required for Atm signaling in several stress contexts, and an Atm-independent function, in which Atmin is required for transcription of the dynein light chain Dynll1. To determine whether acute silencing of Atmin in tumor cells might reduce Pdgfra expression by disrupting Atm signaling, we tested the effects of pharmacological Atm inhibition in p53ΔNprimary tumor cells. Treatment with an Atm inhibitor (ATMi) significantly reduced Pdgfra transcript and protein levels (Figure 4A and B) and efficiently reduced proliferation of p53∆Nprimary tumor cells (Figure 4C), similar to our observations after Pdgfra silencing. ATMi treatment also reduced Pdgfra expression in p53ΔNNSCs (Figure 4D and Figure 4—figure supplement 1). Consistent with these results, Atm-/-; p53ΔNdouble-mutant NSCs had dramatically lower Pdgfra expression levels than p53ΔNNSCs, comparable to AtminΔN; p53ΔNand wt NSCs (Figure 4E and F). Furthermore, in vitro proliferation assays showed that genetic loss of Atm reduced the proliferation of p53ΔNNSCs to wt levels (Figure 4G). Importantly, the reduction in cell proliferation in vitro correlated with reduced tumorigenic potential of the NSCs when orthotopically injected into the brains of NOD/SCID mice. Mice injected with Atm-/-; p53ΔNNSCs survived up to 50% longer than those receiving p53ΔNNSCs (Figure 4H). However, Atmin deletion (Figure 2G) was more effective than deletion of Atm (Figure 4H). Atmin can also act as a transcription factor (Jurado et al., 2012a; 2012b; Goggolidou et al., 2014), and it is conceivable that this Atm-independent function of Atmin contributes to the suppression on GBM. The similar effect of Atmin deletion and Atm inhibition on Pdgfra expression and proliferation of NSCs and primary tumor cells supports the hypothesis that Atmin functions in these processes via its modulation of Atm signaling. Given the extensively characterized role of PDGFRA in cell proliferation and in particular in glioma, it is reasonable to propose that the reduction in Pdgfra expression upon Atm loss contributes to the reduced tumorigenic potential observed.
Figure 4. Atm inhibition reduces Pdgfra expression and reduces tumorigenic potential in murine p53ΔN primary tumor cells and NSCs.
(A–B) Atm inhibitor (ATMi) treatment reduces Pdgfra protein levels (A) and Pdgfra expression (B) in p53ΔN primary tumor cells. (C) ATMi treatment reduces in vitro proliferation of p53ΔN primary tumor cells. Error bars represent the SEM of two biological repeats. (D) ATMi reduces Pdgfra expression in p53ΔN NSCs, assayed by qPCR. (E–F) Pdgfra expression (E) and Pdgfra protein levels (F) are reduced in Atm-/-; p53ΔN and AtminΔN; p53ΔN compared with p53ΔN NSCs. cDNA is normalized to Actin levels. Error bars represent the SEM of at least three biological repeats. s.e. and l.e. denote short and long exposures of the same blot, respectively. (G) Genetic loss of Atm reduces in vitro proliferation of p53ΔN NSCs. Error bars represent the SEM of two biological repeats. (H) Kaplan-Meier curves indicating increased survival of NOD/SCID mice orthotopically transplanted with Atm-/-; p53ΔN NSCs compared with p53ΔN NSCs. n.s., not significant; * p<0.05, ** p<0.01, *** p<0.001. NSC, Neural stem cell.

Figure 4—figure supplement 1. ATM inhibitor (ATMi) treatment reduces Pdgfra protein levels in p53ΔN NSCs. NSCs, Neural stem cells.
Since Atm is best known as a DNA damage signaling kinase, we examined whether the effect of Atm on Pdgfra expression and tumorigenicity was related to altered DNA damage signaling in p53ΔNglioma cells. Neither p53ΔNnor AtminΔN; p53ΔNNSCs showed increased γh2ax or 53bp1 foci in basal conditions (Figure 5A and B), suggesting that the different proliferation rates are not caused by changes in endogenous DNA damage. Pdgfra expression was not affected by IR or hydroxyurea (HU), two well-described inducers of ATM signaling, either in wt or in p53ΔNNSCs (Figure 5C) and no increased Atm substrate phosphorylation could be detected in untreated p53ΔN NSCs (Figure 5D), suggesting that Pdgfra upregulation is not a consequence of stimulation of DNA damage signaling. Atm substrate phosphorylation was also comparable in IR- and HU-treated wt, p53ΔNand AtminΔN; p53ΔNNSCs (Figure 5D), suggesting that the response to DNA damage stimuli is comparable in these cells. This suggests that while Atm is required for the increased Pdgfra expression in p53ΔN cells, this does not involve alterations in IR or HU-induced Atm signaling, but at this point does not exclude the possibility that increased ROS (reactive oxygen species) levels in p53∆N GBM cells might contribute to Atm pathway activation and subsequent Pdgfra induction and GBM development.
Figure 5. Atm signaling in response to DNA damaging agents is remarkably unaffected in p53ΔN and AtminΔN; p53ΔN cells and DNA damaging treatments do not affect Pdgfra expression.

(A) p53ΔN and AtminΔN; p53ΔN NSCs do not show elevated γh2ax and 53bp1 foci in untreated conditions, suggesting low endogenous damage. Cells treated with 5Gy IR (wt +IR) are shown as a positive control. (B) Quantification of γh2ax and 53bp1 foci in (A). Error bars indicate 95% confidence intervals. (C) qPCR of Pdgfra in wt and p53ΔN NSCs in untreated conditions and after DNA damage-inducing stimuli. cDNA is normalized to Actin levels. Error bars represent SEM of three biological repeats. (D) Western blots depicting Atm substrate phosphorylation after the indicated stimuli in NSCs of different genotypes.
Primary human glioma neural stem cells are sensitive to ATM inhibition and combinatorial treatment with PDGFR inhibitors
To investigate the relevance of ATM signaling for PDGFRA upregulation in human GBM, we took advantage of patient derived human GBM neural stem cells (GNSCs) (Stricker et al., 2013) that have documented TP53 mutations (lines G26, G166, and G179, Figure 6A). We confirmed that cell extracts from each of these human tumors were unable to activate a luciferase construct containing multiple TP53-binding elements (Figure 6—figure supplement 1). PDGFRA expression was significantly increased in two out of three human GNSC lines compared with untransformed human neural stem cells (cb660; (Engström et al., 2012; Pollard et al., 2009) (Figure 6B). To assess whether this observation is representative of the wider human GBM spectrum, we analyzed the gene expression patterns in the 'Glioblastoma Multiforme (TCGA, provisional)' dataset from The Cancer Genome Atlas. We analyzed 153 RNA-seq and 500 microarray datasets for 518 glioblastoma samples and completed these with the clinical subgroup information from (Brennan et al., 2013). The gene expression datasets contained z-scores representing the differences in expression levels of PDGFRA between cancer and control samples (Figure 6—figure supplements 2 and 3). The RNA-seq and microarray data were handled separately; for each, we observed higher average PDGFRA expression in TP53-mutant glioblastoma samples compared with TP53 wild-type samples (Figure 6C,D). We also observed higher PDGFRA expression levels in the Proneural and GCiMP GBM subtypes when compared to the Classical, Neural, and Mesenchymal (Figure 6E and Figure 6—figure supplement 4).
Figure 6. ATM inhibitor treatment reduces elevated PDGFRA expression and decreases proliferation in human GBM tumor cells.
(A) Mutational status of TP53, PTEN, IDH1, and EGFR in the indicated glioma neural stem stell (GNSC) lines. n.e., not expressed. wt, wild type. (B) Western blot depicting PDGFRA, TP53, PTEN, and ACTIN expression in three GNSC lines (G26, G166, and G179) and cb660 control cells. (C,D) Box plots showing PDGFRA expression in TP53-wt and TP53-mutant TCGA human glioblastoma datasets, measured by microarray (n=153). (C) or RNA-Seq (n=500). (D) Data from 518 patient samples in total with an overlap of 135 patients. (E) Box plots showing PDGFRA expression z-scores in TCGA human glioblastoma subtypes, measured by RNA-Seq (n=150). p-Values in (C–E) calculated using Wilcoxon’s test. (F) qRT-PCR showing decreased PDGFRA expression in TP53-mutant GNSC lines after ATM inhibitor (ATMi) treatment. cDNA is normalized to GAPDH levels. Error bars represent the STDEV of two biological repeats. (G) Western blot showing knockdown of PDGFRA using a doxycycline (Dox)-inducible shRNA construct. (H) PDGFRA knockdown using doxycycline (Dox)-inducible shRNA reduces proliferation of TP53-mutant G179 GNSCs. Cell confluence measured by IncuCyte timelapse microscopy. Error bars represent the SEM of three biological repeats. * p<0.05, *** p<0.001, n.s., not significant.

Figure 6—figure supplement 1. Luciferase reporter assay for TP53 activity using the p53-550RE construct in human GNSC (G26, G166, G179) and control NSC (cb660) lines. NSC, Neural stem cell.
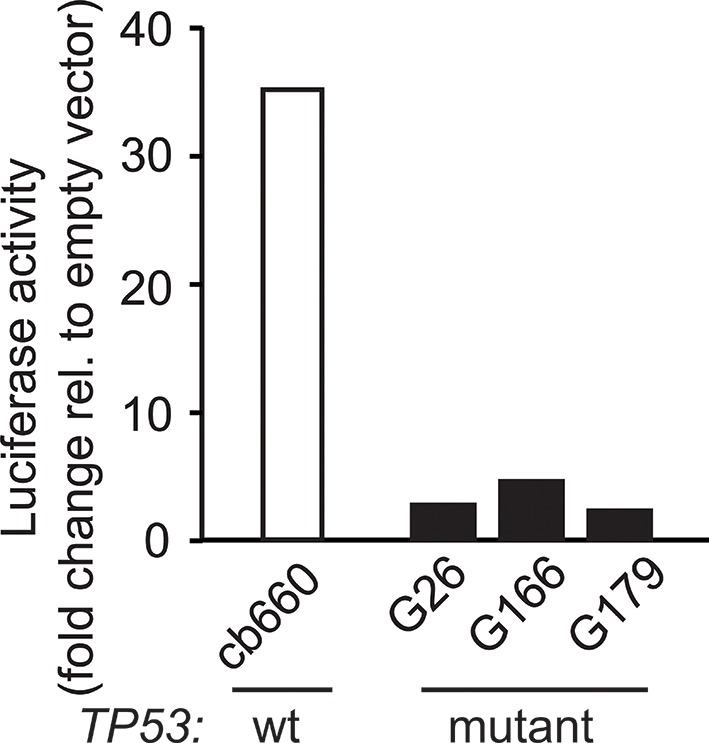
Figure 6—figure supplement 2. Correlation of PDGFRA expression levels in TCGA glioblastoma samples represented in both microarray and RNASeq datasets.
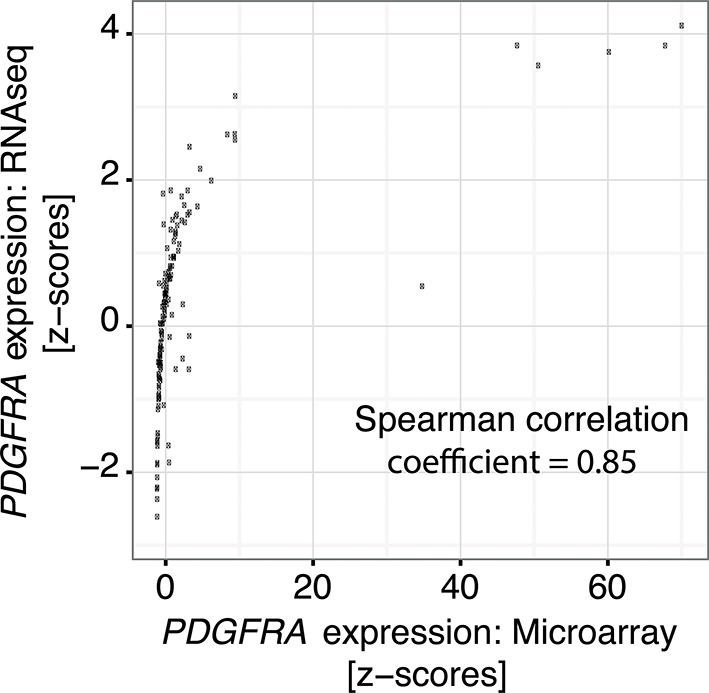
Figure 6—figure supplement 3. Comparison of the distribution of PDGFRA expression levels in human glioblastoma samples measured by RNASeq and by microarray.
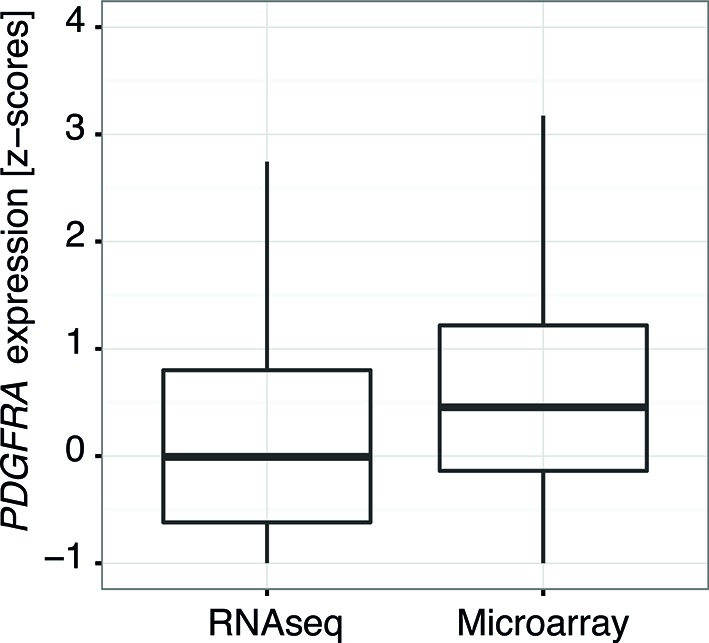
Figure 6—figure supplement 4. Box plots showing PDGFRA expression z-scores in TCGA human glioblastoma subtypes measured by microarray (n=487).
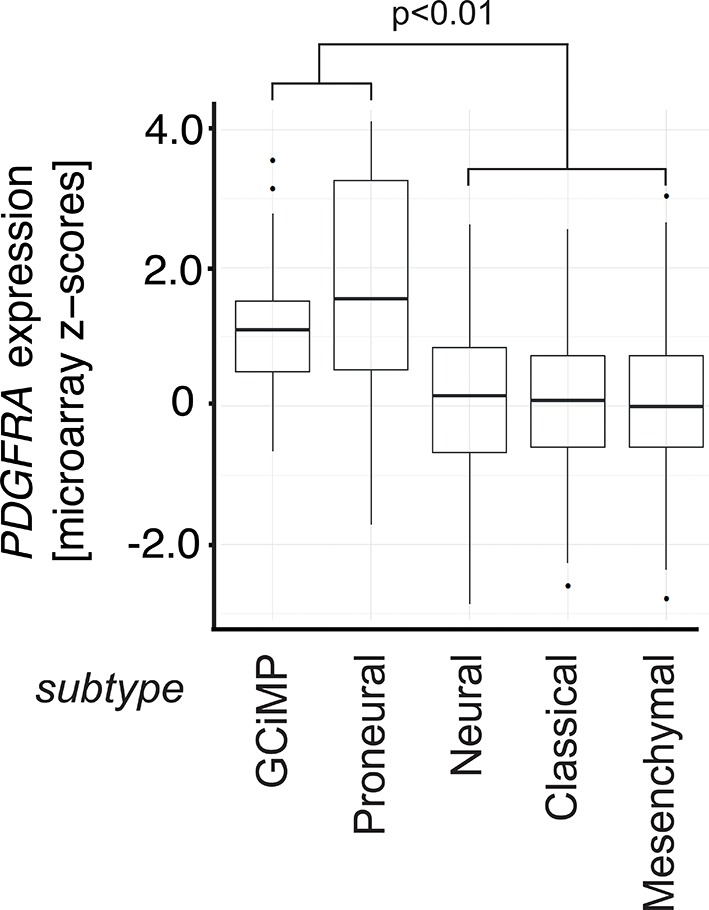
Figure 6—figure supplement 5. Control for Figure 6G and H showing efficient knockdown of PDGFRA after doxycycline administration.
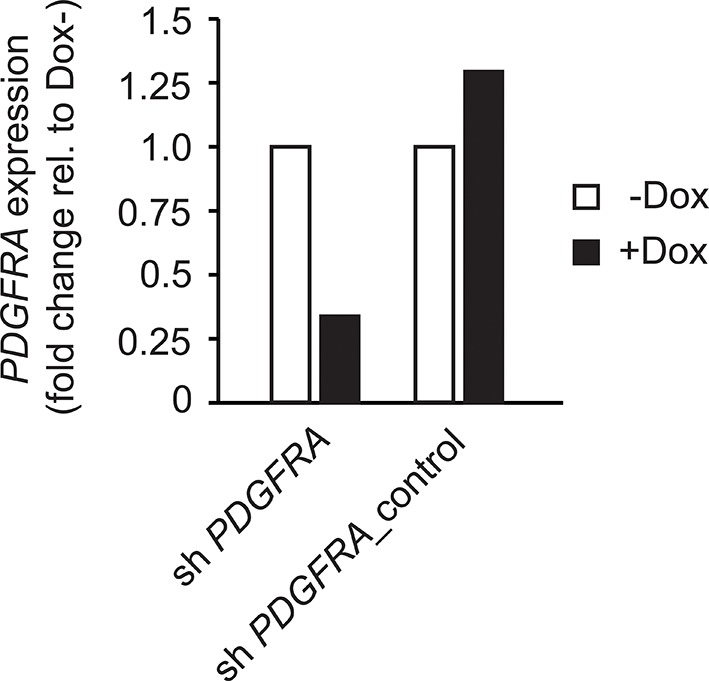
In line with the data from our mouse model, treatment with an ATMi strongly reduced PDGFRA expression in GNSCs, whereas no significant effect on PDGFRA expression was detected in cb660 controls (Figure 6F). To determine whether a reduction in PDGFRA levels would be sufficient to inhibit the proliferation of primary GNSCs from human tumors, G179 cells were infected with doxycycline (dox)-inducible shRNA constructs targeting PDGFRA (Figure 6G and Figure 6—figure supplement 5), and their proliferation was monitored over a period of 10 days. In agreement with our results in the mouse, depletion of PDGFRA led to a significant decrease in the proliferation rate of human GNSCs (Figure 6H). Thus, both murine and human TP53-mutant glioma cells are sensitive to loss of PDGFRA.
To analyze the physiological effects of ATM inhibition on GNSCs, proliferation was monitored over a period of 7 days. Similar to our observations in murine NSCs, ATMi treatment reduced the proliferation rate of human TP53 mutant GNSCs, but not cb660 control cells (Figure 7A). PDGFR inhibitors (PDGFRi) have previously been shown in vitro and in vivo to reduce tumor growth in a glioma model (Kilic et al., 2000). These advances, however, have so far failed to transition into clinical practice (Wen et al., 2006; Rich et al., 2004). We reasoned that ATMi-mediated reduction in PDGFRA protein levels could potentiate the effects of PDGFR inhibition. Consistent with this, we observed that co-treatment of GNSCs, but not untransformed NSCs (e.g. cb660), with relevant ATM and PDGFR inhibitor concentrations further reduced cell proliferation (Figure 7A and Figure 7—figure supplement 1). More detailed analysis revealed that this treatment combination induced substantial cell death, while untransformed NSCs remained largely unaffected (Figure 7B,C). The proportion of apoptotic GNSCs receiving the combination treatment was quantifiable by microscopic detection of a caspase-cleaved fluorescent substrate after up to four days of drug treatment; thereafter, dead cells detached from the plate, precluding accurate quantification. Essentially, all GNSCs were eventually killed by the combination of ATM and PDGFR inhibitors, as judged by cell detachment. In contrast, PDGFRi treatment by itself had little effect on cell death and proliferation (Figure 7 A–C). Seeding GNSCs at higher confluence gave similar results (Figure 7—figure supplement 2), as did a second, independent PDGFRi in combination with the ATMi (Figure 7—figure supplement 3), indicating that cell death was not an indirect consequence of slower proliferation induced by the ATMi or a side effect of a particular drug. Hence, ATM is required for PDGFRA overexpression in both murine and human GBM cells, and combined inhibition of ATM and PDGFR induces lethality in TP53-mutant glioma cells, promising new opportunities for future GBM treatment.
Figure 7. Combinatorial treatment with both ATM and PDGFR inhibitors induces apoptosis of human glioma stem cells.
(A) Growth curves showing the proliferation of wild-type control human neural stem cells (cb660) and two independent cell lines isolated from TP53-deficient human gliomas (G166 & G179) over 7 days in the presence of vehicle control (DMSO), ATM inhibitor (ATMi), PDGFR inhibitor (PDGFRi), or both inhibitors. Error bars depict STDEV from two biological repeats. (B) Representative bright-field/fluorescent images of the same cell types treated as above after 4 days. Cells undergoing apoptosis are labeled by emitting GFP. (C) Quantification of apoptotic cells after the treatments indicated above, represented as % apoptotic cells from total live cells. Error bars depict STDEV from three biological repeats. After four days, it became impossible to quantify apoptotic GNSCs receiving the combination treatment, since they detached completely from the culture plate. These percentages thus represent an underestimate of the total extent of G166 and G179 cell death with ATMi + PDGFRi.

Figure 7—figure supplement 1. ATM and PDGFR inhibitors were used at minimally required concentration to achieve pathway inhibition.
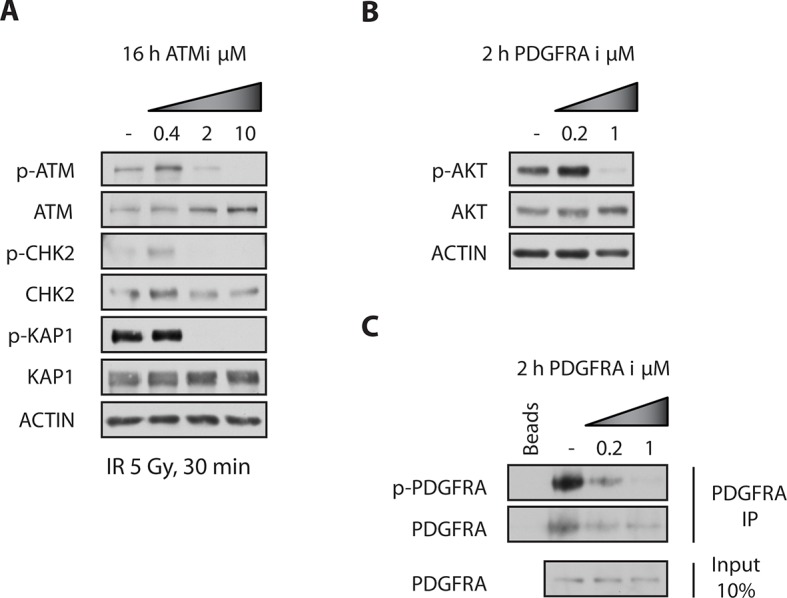
Figure 7—figure supplement 2. Bright-field images of timelapse microscopy using cells seeded at high confluency.

Figure 7—figure supplement 3. Apoptosis quantification of a second PDGFR inhibitor.

Our data indicate that disruption of Atm/Atmin function not only inhibits GBM initiation in Trp53-deficient animals, but also reduces the tumorigenic potential of established human glioma cells, suggesting that ATM inhibitors might be valuable tools in GBM therapy.
Discussion
An important goal of personalized cancer medicine is to identify vulnerabilities of specific tumor genotypes. Since TP53 signaling is the most common genetically altered pathway in human gliomas (Cancer Genome Atlas Research Network, 2008), it is desirable for future cancer therapies to identify new molecular targets that affect TP53-deficient cells. Here, we have shown that genetic loss of Atmin or Atm reduces GBM formation initiated by deletion of Trp53. This finding indicates that Atm/Atmin is crucial for Trp53-deficient GBM development, and suggests the use of ATM inhibitors, which have already been developed, for GBM therapy (Basu et al., 2012; Golding et al., 2009; 2012; Batey et al., 2013).
Although other groups have previously observed that loss of Trp53 is sufficient to provoke GBM formation (Wang et al., 2009; Zheng et al., 2008), the potential advantages of this model system have largely been overlooked. Even on a mixed genetic background, mice harboring a Nestin-driven Trp53 deletion show strong consistency in tumor latency, high penetrance of brain tumors and high-grade GBM formation. Such a model, incorporating the stochastic evolution and genetic heterogeneity of human glioblastoma patients, complements existing genetically defined mouse models that show an accelerated disease course (Chen et al., 2012).
Atm is a rare example of a protein required for formation of a Trp53-deficient tumor that is amenable to pharmacological inhibition, with potential direct therapeutic implications. This pro-tumorigenic function for Atmin and Atm signaling in brain cancer is unexpected, as systemic Atm deletion has previously been found to accelerate Pdgf ligand-induced gliomagenesis (Squatrito et al., 2010). However, the previous study was carried out in Trp53 wild-type animals. It was recently shown that TP53 status is crucial in determining the cellular response to ATM inhibition in human glioma cell lines (Biddlestone-Thorpe et al., 2013), so this difference might explain the apparently opposite function of Atm in our model. TCGA data indicates that ATM mutation/deletion is rare in TP53-mutant GBM, supporting the hypothesis that ATM loss is not a tumor driver and may even inhibit tumorigenesis in this context. Because the pleiotropic effects of ATM signaling are highly context dependent, factors other than TP53 status must also influence the outcome in vivo. For example, loss of Atm cooperates with Trp53 deficiency and accelerates the progression of T-cell lymphoma (Westphal et al., 1997). Thus, the relationship between TP53 and ATM signaling in tumorigenesis may be tissue specific, ranging from cooperation to antagonism.
Adding to this context dependency, ATM’s function in the DNA damage response inhibits tumorigenesis in precancerous lesions but can also promote resistance to DNA damaging therapies in established tumors. Indeed, recently published work has shown that ATM inhibition preferentially radiosensitizes TP53 mutant GBM cell lines (Biddlestone-Thorpe et al., 2013). Our data reveal an additional pro-tumorigenic effect of Atm, which acts in the absence of ionizing radiation and involves non-canonical, Atmin-dependent signaling. It is possible that the effect of Atm inhibition in our model would also be enhanced by ionizing radiation, since the radiosensitizing effect would be predicted to be largely independent of Atmin (Kanu and Behrens, 2007). Thus, combination treatment with ATM and PDGFR inhibitors together with radiotherapy may represent a therapeutic opportunity for GBM.
Our results indicate that the requirement for the Atm/Atmin pathway in p53∆N GBM lies in the initiation of a program of altered gene expression (Figure 3A) and does not directly involve the DNA damage response to double-strand breaks induced by IR or HU (Figure 5B and C). Although Atmin has been implicated directly as a transcription factor for Dynll1 (Jurado et al., 2012b), a broader role for Atmin in transcriptional regulation had not yet been determined. We find here that Atmin loss leads to widespread rescue of glioma-associated changes in gene expression in the p53∆Nbackground. Several of these genes could be collectively responsible for suppressing GBM formation in AtminΔN; p53∆N animals. The most compelling single candidate, however, is the proto-oncogene Pdgfra. It has been shown that stimulating Pdgf signaling in vivo is sufficient to induce glioma-like growths (Jackson et al., 2006). Moreover, PDGFRA is commonly overexpressed in human glioma (Engström et al., 2012), but only a subset of gliomas display PDGFRA locus amplification (Furnari et al., 2007) (Cancer Genome Atlas Research Network, 2008), indicating that additional mechanisms drive its increased expression. PDGFRA overexpression frequently correlates with LOH on chromosome 17p, where the human TP53 gene is located (Hermanson et al., 1996), supporting the view that the oncogenic misexpression of PDGFRA might be a direct consequence of TP53 inactivation in human GBM. In our murine and human glioma lines, Pdgfra levels could be dynamically modulated by depleting Atmin or inhibiting Atm. At present, how Atm/Atmin controls Pdgfra expression in this background is unclear. Chromatin immunoprecipitation experiments in murine NSCs indicated that Atmin does not bind the Pdgfra gene (unpublished observations), making the regulation unlikely to be via direct transactivation, most likely involving currently unidentified intermediate transcriptional regulators of Pdgfra expression. We speculate that Trp53 controls the expression of a negative regulator of Pdgfra, for example, a repressor or a miR RNA, and that Atm signalling is required for the expression or function of this factor. As these intermediate factors could be promising targets for pharmacological inhibition, further investigation into their identity is of therapeutic interest.
Although the oncogenic role of PDGFR signaling in glioma is well established, the clinical efficacy of PDGFR inhibitors has so far been disappointing (Wen et al., 2006; Rich et al., 2004). Here, we demonstrate that the effect of these drugs on the proliferation and survival of human glioma cells can be greatly potentiated by combining PDGFR inhibitor treatment with ATM inhibitors. Importantly, the strongest effects of combinatorial treatment on cell proliferation and survival are specific to tumor cells that have lost TP53 function, suggesting that systemic therapy should target TP53-deficient tumors with minimal impairment to normal tissue.
A second encouraging result of combining ATM and PDGFRA inhibitors is that they not only reduce tumor cell proliferation, but also potently induce cell death. While our data support cooperation based on simultaneous inhibition of PDGFR signaling at the transcriptional and protein kinase levels, it is likely that this synergy also encompasses broader effects of ATM and PDGFRA inhibition. In addition, current PDGFR inhibitors are not completely specific and also inhibit EGFR, VEGFR, FLT3, and c-KIT kinases amongst others (Andrae et al., 2008; Homsi and Daud, 2007). Similarly, ATM inhibitors have also been shown to display broader kinase inhibitor activity, especially at higher concentrations (Hickson et al., 2004). Thus, PDGFR-independent mechanisms could contribute to the observed treatment synergy.
In summary, we have identified a novel protumorigenic function of ATM signaling in GBM. Our results present a rationale for expanding the investigation of ATM inhibitors from radiosensitizers to potential therapies in their own right, and point toward improvements in the efficacy of PDGFRA inhibition using combination treatment.
Materials and methods
Ethics statement
Experiments in mice were carried out with the approval of the Crick Institute’s Ethical Review Committee and under the guidance of the Biological Resources Unit.
Animal models
Atminf/f, p53f/f, Atm-/-, and Nestin-Cre mice have been described previously (Kanu et al., 2010; Jonkers et al., 2001; Barlow et al., 1996; Tronche et al., 1999). Immunocompromised NOD/SCID mice were maintained in-house. Mice were maintained and bred on a mixed background in pathogen-free conditions, monitored for signs of ill health and culled when moribund. Strain background had no significant effect on the latency or development of gliomas in p53ΔNmice.
Cell culture
NSCs were isolated as spheres from fore and midbrains of mouse E13.5 embryos. Cells were initially cultured as spheres under self-renewal conditions, as previously described. Adherent NSC cultures were derived as previously described (Pollard et al., 2006; Conti et al., 2005) with minor modifications (Sancho et al., 2013). Briefly, primary spheres were plated in Neurobasal Medium (Invitrogen, Grand Island, NY, USA) supplemented with 1% Penicillin/Streptomycin (Invitrogen), 1% L-glutamine (Invitrogen), 2% B27 supplement (Invitrogen), 1% N-2 supplement (Invitrogen), 20 ng/ml EGF (PeproTech), 20 ng/ml FGF-basic (PeproTech), and 1 μg/ml laminin (Sigma). All experiments were performed using undifferentiated adherent NSCs (see Figure 2—figure supplement 2).
Primary tumor cells were generated from brain tumor samples of symptomatic mice (Figure 3—figure supplement 5). Tissue was subjected to mechanical and enzymatic dissociation, and single cells initially cultured to form spheres. Tumor spheres formed were then maintained as adherent tumor cell cultures in NSC media as described above.
Plasmids and reagents
pCMV6-myc-ATMIN was generated by cloning mouse Atmin into a pCMV6 backbone. Silencing and mismatch constructs for Atmin have been described previously (Kanu and Behrens, 2007). The luciferase p53 response element (pGL3-550RE) was kindly provided by Karen Vousden. The ATM inhibitor Ku55993 (Merck) was used at 10 µM and replenished every 24 hr.
For DNA damage induction, NSCs of the indicated genotypes were either left untreated or subjected to 0.8 Gy irradiation or 2 mM hydroxyurea (HU) and harvested after 1 hr and 3 hr respectively for RNA extraction or protein lysates.
Transfection and luciferase assay
For transfection, NSCs and GNSCs were plated at subconfluence and transfected with Lipofectamine 2000 according to the manufacturer’s protocol (Invitrogen).
For luciferase assays, samples were transiently transfected with Firefly and Renilla luciferase reporters and luciferase activity was measured using the Dual-Luciferase Reporter Assay System (Promega), 36-hr post-transfection. Data are expressed as fold induction of luciferase activity after being normalized to expression of thymidine kinase-renilla luciferase (TK-renilla).
Western blots and immunoprecipitation
For Western Blots (WB), NSCs were extracted in RIPA lysis buffer (NEB) supplemented with protease inhibitors (Sigma). For immunoprecipitation (IP) cells were lysed in IP buffer (20mM sodium phosphate buffer, 1 mM EDTA, 0.2% NP40, 150 mM NaCl supplemented with Na-orthovanadate, PMSF, NaF and protease inhibitor mixture [Sigma]). After sonication and centrifugation, supernatant was incubated overnight at 4°C with PDGFRA antibody, followed by 2-hr incubation with Dynabeads M-280 (Invitrogen), washed with IP buffer (0 mM NaCl, 150 mM NaCl and 1 M NaCl) and eluted in Laemmli sample buffer. All primary antibodies were used at 1:1000 dilution and secondary antibodies at 1:10000. The following antibodies were used: p53, Pdgfra, p-Pdgfra, p-Chk2, p-Akt, Akt (all Cell Signaling); Myc-9E10 (CRUK); Smc1 (Abcam); p-Smc1, Chk2, Tubulin (all Merck); p-Kap1, Kap1 (both Bethyl Labs); Atm (Santa Cruz), p-Atm (Epitomics), p-p53, Actin, GAPDH, HRP-conjugated goat anti-mouse/rabbit IgG (all Sigma).
Quantitative RT-PCR
For qRT-PCR analysis, mRNA was isolated from NSCs using the RNeasy mini kit (Qiagen). Results (normalized to Actin expression) are presented as fold change relative to control. Sequences of primers used are listed in Supplementary file 2.
Cell proliferation and hypoxia assays
For cell proliferation assays, NSCs were plated in duplicate in 12-well plates and cell number measured every day using a ViCell cell counter. The initial number of cells seeded was used to normalize to 100%. Mean averages were taken from at least four independent lines per genotype taken from different embryos and crosses. For BrdU profiling, cells pulsed with BrdU for 2 hr were fixed in 70% ethanol, stained with BrdU antibody and propidium iodide (PI) and analyzed by flow cytometry.
For hypoxia assay, NSCs were seeded in duplicate into 6-well plates and next day placed into a hypoxic chamber at 0.1% O2 for 72 hr. ATM inhibitor was replenished after 24 hr and 48 hr. For cell death analysis, control-treated and hypoxia-treated cells were subjected to DAPI staining and analyzed via flow cytometry. Mean averages were taken from at least three independent experiments.
IR-induced death and arrest
To determine IR-induced death, NSCs were irradiated at 5Gy and after 24 hr incubated with 4'-6-Diamidino-2-phenylindole (DAPI; Sigma) and assessed for apoptosis via flow cytometry. G1/S phase arrest was assessed by irradiating NSCs at 5Gy and after 18 hr pulsing with BrdU for 1.5 hr. Cells were prepared for flow cytometry as described above and gated on BrdU-positive cells. Mean averages were taken from at least three independent experiments.
Orthotopic transplants
1x10⁵ early passage (p.4) GFP labeled NSCs of the indicated genotypes were injected using a stereotaxic frame into the striatum of 6- to 8-week-old mice (NOD/SCID strain), following administration of general anaesthesia as previously described. Animals were monitored daily and culled when moribund.
Human NS and GNS cell culture
Fetal NS cell lines and GNS lines derived from human glioma samples have been described previously (Stricker et al., 2013; Pollard et al., 2009). The same culture conditions apply as previously described for mouse NSCs. Cell proliferation was measured over a period of four or seven days using an incubator microscope system for live cell imaging and measurement of cell confluence over several days (IncuCyte) and cell death was quantified using CellPlayer Caspase 3/7 Reagent from Essen Bioscience. Cells were seeded at 1.2x10⁴ or 2.4x10⁴ into a 48-well plate and images taken every 30 min. The ATM inhibitor KU55993 was added at 10 μM. PDGFR inhibitors III and V (CAS 205254-94-0 and CAS 347155-76-4 respectively, both Merck) were used at 1μM and replenished every 24 hr over a period of four or seven days as indicated. Stable shPDGFRA GNSC lines were generated by viral infection of GNSCs with pTRIPZ-shPDGFRA targeting and control vectors (Thermo Fisher). Doxycycline was added at a final concentration of 0.5 μg/ml and replenished every day.
Histological analysis and tumor grading
All mice were euthanized in a CO2 chamber to preserve brain tissue. Brain sections were cut at 4 μm for Hematoxylin & Eosin (H&E) staining and all antibody staining. The following antibodies were used for IHC: Nestin (BD Bioscience), Gfap (Dako), Olig2, Neun (both Merck), Synaptophysin (Sigma), Pdgfra (Cell Signaling), Ki67 (Abcam). Tumor grading was determined on the basis of the WHO grading system for malignant astrocytoma.
Microarray analysis
Three independent NSC lines from each indicated genotype were pooled and submitted for genome wide gene expression profiling using the Illumina Mouse ref 8 v3.0 expression bead chip. Raw data were processed using the 'lumi' package (Du et al., 2008) within Bioconductor (Gentleman et al., 2004) first by applying the variance-stabilizing transform, and then carrying out quantile normalization. Following this, genes were selected on the basis of a 1.5-fold threshold on the mean of the technical duplicates (technical correlation being higher than 0.996 in all cases). The microarray data depicted in Figure 3A has been uploaded to the GEO database under the accession number GSE76296.
Using our normalised microarray data, we calculated the average log fold change between each condition and the wild-type samples. We then calculated distance (following the procedure of [Dabney, 2006]) of these expression profiles to the centroids of the four GBM subtypes identified in (Verhaak et al., 2010). We mapped the expression profile from mouse to human by matching up gene names between the two species, resulting in a correspondence for 674 of the 840 genes in the GBM signature. To assess informally the specificity of the subtypes, and to gain some insight into the strength of the similarities to GBM subtypes, we bootstrapped the log fold changes within samples 1000 times, recording the pairwise distances between bootstrapped samples and fixed GBM subtype-centroids.
Copy number variation calling
Total genomic DNA was extracted and purified using DNeasy Blood & Tissue Kit (Qiagen). Copy number variation (CNV) detection was performed using the Affymetrix Mouse Diversity Genotyping Array (MDGA) at AROS Applied Biotechnology. Genotypes were called from the CEL files using the BRLMM-P algorithm in Affymetrix Power Tools (APT) (available from: http://www.affymetrix.com/estore/partners_programs/programs/developer/tools/powertools.affx) using default settings, including quantile normalization. PennAffy (available from: http://penncnv.openbioinformatics.org/en/latest/user-guide/download/) was implemented to generate Log R Ratio (LRR) and B-allele frequency (BAF) using canonical genotype clustering and population frequency of the B-allele (PFB) files kindly provided by Locke et al. (Locke et al., 2015). Markers that do not probe allelic balance (exon markers in the MDGA) were removed. GC content was calculated for 1 Mb windows centred by each marker using BEDTools (Quinlan and Hall, 2010). LRR was then corrected for genomic waviness by subtracting the median normalised GC content multiplied by a coefficient optimised to generate the minimum variance when subtracted from the LRR. Copy number states were then called for mouse autosomes using the ‘CGHcall’ R package (van de Wiel et al., 2007) in Bioconductor (Gentleman et al., 2004) using the 'sdundo' option for the undo.splits parameter for segmentation. Only CNVs larger than 1 Mb were reported.
TCGA data analysis
Gene expression measurements were obtained by downloading the 'Glioblastoma Multiforme (TCGA, provisional)' dataset using the cBioPortal (http://www.cbioportal.org/, version 05/09/2014) for The Cancer Genome Atlas (http://cancergenome.nih.gov/). The dataset contained 500 microarrays and 153 RNA-seq measurements for 518 glioblastoma patients. Glioblastoma expression subgroup information was obtained from (Brennan et al., 2013), and gene expression levels were represented as z-scores. The RNA-seq and microarray data were analyzed separately but the z-scores for PDGFRA are correlated across 135 samples for which both data types are available (Spearman correlation coefficient = 0.85 for 135 samples with both RNA-seq and microarray data, Figure 6—figure supplement 2), indicating that the two measurement types are comparable. Differences in expression z-scores between TP53 mutant and TP53 wt status, as well as glioblastoma subgroups (combining GCiMP and Proneural versus Neural, Classical, and Mesenchymal) were tested using the Wilcoxon’s test. Three outlier points from each of the TP53 wt and mutant groups in Figure 6D, as well as six outlier points (5 Proneural and 1 Mesenchymal) in Figure 6E are excluded from the plot for clarity.
Statistical analysis
Tumor-free survival was analyzed using GraphPad Prism 6 and statistical analyses to determine tumor-free survival were performed using the Mantel-Cox test. For TCGA data analysis p values were determined using the Wilcoxon’s test. For all other experiments with error bars, the unpaired Student’s t-test was performed to determine statistical significance.
Acknowledgements
We thank E Sahai for critical reading of the manuscript and C Cremona and E Schröder for assistance in editing the manuscript. We are indebted to E Nye, B Spencer-Dene, and the Experimental Histopathology Lab at the Crick at Lincoln’s Inn Field for technical assistance and Mike Howell from the High Throughput Screening Laboratory for IncuCyte assistance. We thank Elizabeth Locke at the Department of Computer Science, University of Western Ontario, for providing us with files required for processing our Mouse Diversity Genotyping array data and for analysis support and advice.
Funding Statement
The funders had no role in study design, data collection and interpretation, or the decision to submit the work for publication.
Funding Information
This paper was supported by the following grants:
Cancer Research UK Core funding to Axel Behrens.
European Research Council 281661 ATMINDDR to Axel Behrens.
Federation of European Biochemical Societies Long-term fellowship to Sophia M Blake.
European Molecular Biology Organization Long-term fellowship to Sophia M Blake, Stefan H Stricker.
Cancer Research UK Postdoctoral fellowship to Sophia M Blake, Nnennaya Kanu.
Breast Cancer Research Foundation Grant to Nnennaya Kanu.
Medical Research Council G0800020.85704 to Silvia Marino.
Epigenesys FP7 Network of Excellence to Anna R Poetsch.
Peter and Traudl Engelhorn Foundation Fellowship to Anna R Poetsch.
The Brain Tumor Charity Grant to Steven M Pollard.
Alex Bolt Research Fellowship to Steven M Pollard.
Additional information
Competing interests
The authors declare that no competing interests exist.
Author contributions
SMB, Conceived and designed study, Acquired data, Analyzed and interpreted data, Drafted the manuscript.
SHS, Generated data from human glioma lines and performed intra-cranial brain injections, Assisted with study design, Conceived and designed study, Acquired data, Analyzed and interpreted data, Drafted the manuscript.
HH, Assisted with data acquisition.
ARP, Analyzed TCGA data.
GC, Analysed SNP array data.
GK, Analysed the mouse microarray data and performed the mouse:GBM-subtype analysis.
NK, Generated conditional Atmin mouse.
SM, Analyzed histopathology of the tumors.
NML, Analyzed TCGA data.
SMP, Performed intra-cranial brain injections, Assisted with the design.
AB, Supervised experiments and contributed as senior author, Drafting of the manuscript.
Ethics
Animal experimentation: Experiments in mice were carried out in accordance with the UK's Animals (Scientific Procedures) Act 1986, with the approval of the Crick Institute's Ethical Review Committee and under the guidance of the Biological Resources Unit.
Additional files
Major datasets
The following datasets were generated:
Behrens A, Blake S,2015,ATMIN function in p53-deficient GBM,http://www.ncbi.nlm.nih.gov/geo/query/acc.cgi?acc=GSE76296,Publicly available at the NCBI Gene Expression Omnibus (Accession no: GSE76296)
The following previously published dataset was used:
Glioblastoma Multiforme,2014,Glioblastoma Multiforme (TCGA, provisional),http://cancergenome.nih.gov/,Publically available
References
- Andrae J, Gallini R, Betsholtz C. Role of platelet-derived growth factors in physiology and medicine. Genes & Development. 2008;22:1276–1312. doi: 10.1101/gad.1653708. [DOI] [PMC free article] [PubMed] [Google Scholar]
- Bakkenist CJ, Kastan MB. DNA damage activates ATM through intermolecular autophosphorylation and dimer dissociation. Nature. 2003;421:499–506. doi: 10.1038/nature01368. [DOI] [PubMed] [Google Scholar]
- Barlow C, Hirotsune S, Paylor R, Liyanage M, Eckhaus M, Collins F, Shiloh Y, Crawley JN, Ried T, Tagle D, Wynshaw-Boris A. Atm-deficient mice: a paradigm of ataxia telangiectasia. Cell. 1996;86:159–171. doi: 10.1016/S0092-8674(00)80086-0. [DOI] [PubMed] [Google Scholar]
- Bartkova J, Hořejší Z, Koed K, Krämer A, Tort F, Zieger K, Guldberg P, Sehested M, Nesland JM, Lukas C, Ørntoft T, Lukas J, Bartek J. DNA damage response as a candidate anti-cancer barrier in early human tumorigenesis. Nature. 2005;434:864–870. doi: 10.1038/nature03482. [DOI] [PubMed] [Google Scholar]
- Basu B, Yap TA, Molife LR, de Bono JS. Targeting the DNA damage response in oncology. Current Opinion in Oncology. 2012;24:316–324. doi: 10.1097/CCO.0b013e32835280c6. [DOI] [PubMed] [Google Scholar]
- Batey MA, Zhao Y, Kyle S, Richardson C, Slade A, Martin NMB, Lau A, Newell DR, Curtin NJ. Preclinical evaluation of a novel ATM inhibitor, KU59403, in vitro and in vivo in p53 functional and dysfunctional models of human cancer. Molecular Cancer Therapeutics. 2013;12:959–967. doi: 10.1158/1535-7163.MCT-12-0707. [DOI] [PMC free article] [PubMed] [Google Scholar]
- Biddlestone-Thorpe L, Sajjad M, Rosenberg E, Beckta JM, Valerie NCK, Tokarz M, Adams BR, Wagner AF, Khalil A, Gilfor D, Golding SE, Deb S, Temesi DG, Lau A, O'Connor MJ, Choe KS, Parada LF, Lim SK, Mukhopadhyay ND, Valerie K. ATM kinase inhibition preferentially sensitizes p53-mutant glioma to ionizing radiation. Clinical Cancer Research. 2013;19:3189–3200. doi: 10.1158/1078-0432.CCR-12-3408. [DOI] [PMC free article] [PubMed] [Google Scholar]
- Brennan CW, Verhaak RG, McKenna A, Campos B, Noushmehr H, Salama SR, Zheng S, Chakravarty D, Sanborn JZ, Berman SH, Beroukhim R, Bernard B, Wu CJ, Genovese G, Shmulevich I, Barnholtz-Sloan J, Zou L, Vegesna R, Shukla SA, Ciriello G, Yung WK, Zhang W, Sougnez C, Mikkelsen T, Aldape K, Bigner DD, Van Meir EG, Prados M, Sloan A, Black KL, Eschbacher J, Finocchiaro G, Friedman W, Andrews DW, Guha A, Iacocca M, O'Neill BP, Foltz G, Myers J, Weisenberger DJ, Penny R, Kucherlapati R, Perou CM, Hayes DN, Gibbs R, Marra M, Mills GB, Lander E, Spellman P, Wilson R, Sander C, Weinstein J, Meyerson M, Gabriel S, Laird PW, Haussler D, Getz G, Chin L, TCGA Research Network The somatic genomic landscape of glioblastoma. Cell. 2013;155:462–477. doi: 10.1016/j.cell.2013.09.034. [DOI] [PMC free article] [PubMed] [Google Scholar]
- Cancer Genome Atlas Research Network Comprehensive genomic characterization defines human glioblastoma genes and core pathways. Nature. 2008;455:1061–1068. doi: 10.1038/nature07385. [DOI] [PMC free article] [PubMed] [Google Scholar]
- Chen J, McKay RM, Parada LF. Malignant glioma: lessons from genomics, mouse models, and stem cells. Cell. 2012;149:36–47. doi: 10.1016/j.cell.2012.03.009. [DOI] [PMC free article] [PubMed] [Google Scholar]
- Conti L, Pollard SM, Gorba T, Reitano E, Toselli M, Biella G, Sun Y, Sanzone S, Ying Q-L, Cattaneo E, Smith A. Niche-independent symmetrical self-renewal of a mammalian tissue stem cell. PLoS Biology. 2005;3:e08711. doi: 10.1371/journal.pbio.0030283. [DOI] [PMC free article] [PubMed] [Google Scholar]
- Dabney AR. ClaNC: point-and-click software for classifying microarrays to nearest centroids. Bioinformatics. 2006;22:122–123. doi: 10.1093/bioinformatics/bti756. [DOI] [PubMed] [Google Scholar]
- Du P, Kibbe WA, Lin SM. Lumi: a pipeline for processing illumina microarray. Bioinformatics. 2008;24:1547–1548. doi: 10.1093/bioinformatics/btn224. [DOI] [PubMed] [Google Scholar]
- Engström PG, Tommei D, Stricker SH, Ender C, Pollard SM, Bertone P. Digital transcriptome profiling of normal and glioblastoma-derived neural stem cells identifies genes associated with patient survival. Genome Medicine. 2012;4:76. doi: 10.1186/gm377. [DOI] [PMC free article] [PubMed] [Google Scholar]
- Furnari FB, Fenton T, Bachoo RM, Mukasa A, Stommel JM, Stegh A, Hahn WC, Ligon KL, Louis DN, Brennan C, Chin L, DePinho RA, Cavenee WK. Malignant astrocytic glioma: genetics, biology, and paths to treatment. Genes & Development. 2007;21:2683–2710. doi: 10.1101/gad.1596707. [DOI] [PubMed] [Google Scholar]
- Gentleman RC, Carey VJ, Bates DM, Bolstad B, Dettling M, Dudoit S, Ellis B, Gautier L, Ge Y, Gentry J, Hornik K, Hothorn T, Huber W, Iacus S, Irizarry R, Leisch F, Li C, Maechler M, Rossini AJ, Sawitzki G, Smith C, Smyth G, Tierney L, Yang JYH, Zhang J. Bioconductor: open software development for computational biology and bioinformatics. Genome Biology. 2004;5:R80. doi: 10.1186/gb-2004-5-10-r80. [DOI] [PMC free article] [PubMed] [Google Scholar]
- Gilbertson RJ, Rich JN. Making a tumour's bed: glioblastoma stem cells and the vascular niche. Nature Reviews Cancer. 2007;7:733–736. doi: 10.1038/nrc2246. [DOI] [PubMed] [Google Scholar]
- Goggolidou P, L. Stevens J, Agueci F, Keynton J, Wheway G, Grimes DT, Patel SH, Hilton H, Morthorst SK, DiPaolo A, Williams DJ, Sanderson J, Khoronenkova SV, Powles-Glover N, Ermakov A, Esapa CT, Romero R, Dianov GL, Briscoe J, Johnson CA, Pedersen LB, Norris DP. ATMIN is a transcriptional regulator of both lung morphogenesis and ciliogenesis. Development. 2014;141:3966–3977. doi: 10.1242/dev.107755. [DOI] [PMC free article] [PubMed] [Google Scholar]
- Golding SE, Rosenberg E, Adams BR, Wignarajah S, Beckta JM, O’Connor MJ, Valerie K. Dynamic inhibition of ATM kinase provides a strategy for glioblastoma multiforme radiosensitization and growth control. Cell Cycle. 2012;11:1167–1173. doi: 10.4161/cc.11.6.19576. [DOI] [PMC free article] [PubMed] [Google Scholar]
- Golding SE, Rosenberg E, Valerie N, Hussaini I, Frigerio M, Cockcroft XF, Chong WY, Hummersone M, Rigoreau L, Menear KA, O'Connor MJ, Povirk LF, van Meter T, Valerie K. Improved ATM kinase inhibitor KU-60019 radiosensitizes glioma cells, compromises insulin, AKT and ERK prosurvival signaling, and inhibits migration and invasion. Molecular Cancer Therapeutics. 2009;8:2894–2902. doi: 10.1158/1535-7163.MCT-09-0519. [DOI] [PMC free article] [PubMed] [Google Scholar]
- Graeber TG, Osmanian C, Jacks T, Housman DE, Koch CJ, Lowe SW, Giaccia AJ. Hypoxia-mediated selection of cells with diminished apoptotic potential in solid tumours. Nature. 1996;379:88–91. doi: 10.1038/379088a0. [DOI] [PubMed] [Google Scholar]
- Hermanson M, Funa K, Koopmann J, Maintz D, Waha A, Westermark B, Heldin CH, Wiestler OD, Louis DN, von Deimling A, Nistér M. Association of loss of heterozygosity on chromosome 17p with high platelet-derived growth factor alpha receptor expression in human malignant gliomas. Cancer Research. 1996;56:164–171. [PubMed] [Google Scholar]
- Hickson I, Zhao Y, Richardson CJ, Green SJ, Martin NM, Orr AI, Reaper PM, Jackson SP, Curtin NJ, Smith GC. Identification and characterization of a novel and specific inhibitor of the ataxia-telangiectasia mutated kinase ATM. Cancer Research. 2004;64:9152–9159. doi: 10.1158/0008-5472.CAN-04-2727. [DOI] [PubMed] [Google Scholar]
- Homsi J, Daud AI. Spectrum of activity and mechanism of action of VEGF/PDGF inhibitors. Cancer Control. 2007;14:285–294. doi: 10.1177/107327480701400312. [DOI] [PubMed] [Google Scholar]
- Jackson EL, Garcia-Verdugo JM, Gil-Perotin S, Roy M, Quinones-Hinojosa A, VandenBerg S, Alvarez-Buylla A. PDGFRα-positive b cells are neural stem cells in the adult SVZ that form glioma-like growths in response to increased PDGF signaling. Neuron. 2006;51:187–199. doi: 10.1016/j.neuron.2006.06.012. [DOI] [PubMed] [Google Scholar]
- Johnson BE, Mazor T, Hong C, Barnes M, Aihara K, McLean CY, Fouse SD, Yamamoto S, Ueda H, Tatsuno K, Asthana S, Jalbert LE, Nelson SJ, Bollen AW, Gustafson WC, Charron E, Weiss WA, Smirnov IV, Song JS, Olshen AB, Cha S, Zhao Y, Moore RA, Mungall AJ, Jones SJM, Hirst M, Marra MA, Saito N, Aburatani H, Mukasa A, Berger MS, Chang SM, Taylor BS, Costello JF. Mutational analysis reveals the origin and therapy-driven evolution of recurrent glioma. Science. 2014;343:189–193. doi: 10.1126/science.1239947. [DOI] [PMC free article] [PubMed] [Google Scholar]
- Jonkers J, Meuwissen R, van der Gulden H, Peterse H, van der Valk M, Berns A. Synergistic tumor suppressor activity of BRCA2 and p53 in a conditional mouse model for breast cancer. Nature Genetics. 2001;29:418–425. doi: 10.1038/ng747. [DOI] [PubMed] [Google Scholar]
- Jurado S, Conlan LA, Baker EK, Ng J-L, Tenis N, Hoch NC, Gleeson K, Smeets M, Izon D, Heierhorst J. ATM substrate Chk2-interacting Zn2+ finger (aSCIZ) is a bi-functional transcriptional activator and feedback sensor in the regulation of dynein light chain (dYNLL1) expression. Journal of Biological Chemistry. 2012a;287:3156–3164. doi: 10.1074/jbc.M111.306019. [DOI] [PMC free article] [PubMed] [Google Scholar]
- Jurado S, Gleeson K, O’Donnell K, Izon DJ, Walkley CR, Strasser A, Tarlinton DM, Heierhorst J. The zinc-finger protein ASCIZ regulates b cell development via DYNLL1 and bim. The Journal of Experimental Medicine. 2012b;209:1629–1639. doi: 10.1084/jem.20120785. [DOI] [PMC free article] [PubMed] [Google Scholar]
- Kanu N, Behrens A. ATMIN defines an NBS1-independent pathway of ATM signalling. The EMBO Journal. 2007;26:2933–2941. doi: 10.1038/sj.emboj.7601733. [DOI] [PMC free article] [PubMed] [Google Scholar]
- Kanu N, Penicud K, Hristova M, Wong B, Irvine E, Plattner F, Raivich G, Behrens A. The ATM cofactor ATMIN protects against oxidative stress and accumulation of DNA damage in the aging brain. Journal of Biological Chemistry. 2010;285:38534–38542. doi: 10.1074/jbc.M110.145896. [DOI] [PMC free article] [PubMed] [Google Scholar]
- Kilic T, Alberta JA, Zdunek PR, Acar M, Iannarelli P, O'Reilly T, Buchdunger E, Black PM, Stiles CD. Intracranial inhibition of platelet-derived growth factor-mediated glioblastoma cell growth by an orally active kinase inhibitor of the 2-phenylaminopyrimidine class. Cancer Research. 2000;60:5143–5150. [PubMed] [Google Scholar]
- Liu T, Laurell C, Selivanova G, Lundeberg J, Nilsson P, Wiman KG. Hypoxia induces p53-dependent transactivation and Fas/CD95-dependent apoptosis. Cell Death and Differentiation. 2007;14:411–421. doi: 10.1038/sj.cdd.4402022. [DOI] [PubMed] [Google Scholar]
- Locke MEO, Milojevic M, Eitutis ST, Patel N, Wishart AE, Daley M, Hill KA. Genomic copy number variation in mus musculus. BMC Genomics. 2015;16 doi: 10.1186/s12864-015-1713-z. [DOI] [PMC free article] [PubMed] [Google Scholar]
- Loizou JI, Sancho R, Kanu N, Bolland DJ, Yang F, Rada C, Corcoran AE, Behrens A. ATMIN is required for maintenance of genomic stability and suppression of b cell lymphoma. Cancer Cell. 2011;19:587–600. doi: 10.1016/j.ccr.2011.03.022. [DOI] [PMC free article] [PubMed] [Google Scholar]
- Lord CJ, Ashworth A. The DNA damage response and cancer therapy. Nature. 2012;481:287–294. doi: 10.1038/nature10760. [DOI] [PubMed] [Google Scholar]
- Maher EA, Furnari FB, Bachoo RM, Rowitch DH, Louis DN, Cavenee WK, DePinho RA. Malignant glioma: genetics and biology of a grave matter. Genes & Development. 2001;15:1311–1333. doi: 10.1101/gad.891601. [DOI] [PubMed] [Google Scholar]
- Mazor T, Pankov A, Johnson BE, Hong C, Hamilton EG, Bell RJA, Smirnov IV, Reis GF, Phillips JJ, Barnes MJ, Idbaih A, Alentorn A, Kloezeman JJ, Lamfers MLM, Bollen AW, Taylor BS, Molinaro AM, Olshen AB, Chang SM, Song JS, Costello JF. DNA methylation and somatic mutations converge on the cell cycle and define similar evolutionary histories in brain tumors. Cancer Cell. 2015;28:307–317. doi: 10.1016/j.ccell.2015.07.012. [DOI] [PMC free article] [PubMed] [Google Scholar]
- Ohgaki H, Dessen P, Jourde B, Horstmann S, Nishikawa T, Di Patre PL, Burkhard C, Schüler D, Probst-Hensch NM, Maiorka PC, Baeza N, Pisani P, Yonekawa Y, Yasargil MG, Lütolf UM, Kleihues P. Genetic pathways to glioblastoma: a population-based study. Cancer Research. 2004;64:6892–6899. doi: 10.1158/0008-5472.CAN-04-1337. [DOI] [PubMed] [Google Scholar]
- Petitjean A, Mathe E, Kato S, Ishioka C, Tavtigian SV, Hainaut P, Olivier M. Impact of mutant p53 functional properties on TP53 mutation patterns and tumor phenotype: lessons from recent developments in the IARC TP53 database. Human Mutation. 2007;28:622–629. doi: 10.1002/humu.20495. [DOI] [PubMed] [Google Scholar]
- Pollard SM, Conti L, Sun Y, Goffredo D, Smith A. Adherent neural stem (nS) cells from fetal and adult forebrain. Cerebral Cortex. 2006;16:i112–i120. doi: 10.1093/cercor/bhj167. [DOI] [PubMed] [Google Scholar]
- Pollard SM, Yoshikawa K, Clarke ID, Danovi D, Stricker S, Russell R, Bayani J, Head R, Lee M, Bernstein M, Squire JA, Smith A, Dirks P. Glioma stem cell lines expanded in adherent culture have tumor-specific phenotypes and are suitable for chemical and genetic screens. Cell Stem Cell. 2009;4:568–580. doi: 10.1016/j.stem.2009.03.014. [DOI] [PubMed] [Google Scholar]
- Quinlan AR, Hall IM. BEDTools: a flexible suite of utilities for comparing genomic features. Bioinformatics. 2010;26:841–842. doi: 10.1093/bioinformatics/btq033. [DOI] [PMC free article] [PubMed] [Google Scholar]
- Rich JN, Reardon DA, Peery T, Dowell JM, Quinn JA, Penne KL, Wikstrand CJ, Van Duyn LB, Dancey JE, McLendon RE, Kao JC, Stenzel TT, Ahmed Rasheed BK, Tourt-Uhlig SE, Herndon JE, Vredenburgh JJ, Sampson JH, Friedman AH, Bigner DD, Friedman HS. Phase II trial of gefitinib in recurrent glioblastoma. Journal of Clinical Oncology. 2004;22:133–142. doi: 10.1200/JCO.2004.08.110. [DOI] [PubMed] [Google Scholar]
- Sancho R, Blake SM, Tendeng C, Clurman BE, Lewis J, Behrens A. Fbw7 repression by Hes5 creates a feedback loop that modulates notch-mediated intestinal and neural stem cell fate decisions. PLoS Biology. 2013;11:e08711. doi: 10.1371/journal.pbio.1001586. [DOI] [PMC free article] [PubMed] [Google Scholar]
- Shiloh Y, Ziv Y. The ATM protein kinase: regulating the cellular response to genotoxic stress, and more. Nature Reviews Molecular Cell Biology. 2013;14:197–210. doi: 10.1038/nrm3546. [DOI] [PubMed] [Google Scholar]
- Squatrito M, Brennan CW, Helmy K, Huse JT, Petrini JH, Holland EC. Loss of ATM/Chk2/p53 pathway components accelerates tumor development and contributes to radiation resistance in gliomas. Cancer Cell. 2010;18:619–629. doi: 10.1016/j.ccr.2010.10.034. [DOI] [PMC free article] [PubMed] [Google Scholar]
- Stricker SH, Feber A, Engstrom PG, Caren H, Kurian KM, Takashima Y, Watts C, Way M, Dirks P, Bertone P, Smith A, Beck S, Pollard SM. Widespread resetting of DNA methylation in glioblastoma-initiating cells suppresses malignant cellular behavior in a lineage-dependent manner. Genes & Development. 2013;27:654–669. doi: 10.1101/gad.212662.112. [DOI] [PMC free article] [PubMed] [Google Scholar]
- Stupp R, Mason WP, van den Bent MJ, Weller M, Fisher B, Taphoorn MJ, Belanger K, Brandes AA, Marosi C, Bogdahn U, Curschmann J, Janzer RC, Ludwin SK, Gorlia T, Allgeier A, Lacombe D, Cairncross JG, Eisenhauer E, Mirimanoff RO, European Organisation for Research and Treatment of Cancer Brain Tumor and Radiotherapy Groups. National Cancer Institute of Canada Clinical Trials Group Radiotherapy plus concomitant and adjuvant temozolomide for glioblastoma. New England Journal of Medicine. 2005;352:987–996. doi: 10.1056/NEJMoa043330. [DOI] [PubMed] [Google Scholar]
- Suvasini R, Shruti B, Thota B, Shinde SV, Friedmann-Morvinski D, Nawaz Z, Prasanna KV, Thennarasu K, Hegde AS, Arivazhagan A, Chandramouli BA, Santosh V, Somasundaram K. Insulin growth factor-2 binding protein 3 (iGF2BP3) is a glioblastoma-specific marker that activates phosphatidylinositol 3-Kinase/Mitogen-activated protein kinase (pI3K/MAPK) pathways by modulating IGF-2. Journal of Biological Chemistry. 2011;286:25882–25890. doi: 10.1074/jbc.M110.178012. [DOI] [PMC free article] [PubMed] [Google Scholar]
- Tronche F, Kellendonk C, Kretz O, Gass P, Anlag K, Orban PC, Bock R, Klein R, Schütz G. Disruption of the glucocorticoid receptor gene in the nervous system results in reduced anxiety. Nature Genetics. 1999;23:99–103. doi: 10.1038/12703. [DOI] [PubMed] [Google Scholar]
- van de Wiel MA, Kim KI, Vosse SJ, van Wieringen WN, Wilting SM, Ylstra B. CGHcall: calling aberrations for array CGH tumor profiles. Bioinformatics. 2007;23:892–894. doi: 10.1093/bioinformatics/btm030. [DOI] [PubMed] [Google Scholar]
- Velimezi G, Liontos M, Vougas K, Roumeliotis T, Bartkova J, Sideridou M, Dereli-Oz A, Kocylowski M, Pateras IS, Evangelou K, Kotsinas A, Orsolic I, Bursac S, Cokaric-Brdovcak M, Zoumpourlis V, Kletsas D, Papafotiou G, Klinakis A, Volarevic S, Gu W, Bartek J, Halazonetis TD, Gorgoulis VG. Functional interplay between the DNA-damage-response kinase ATM and ARF tumour suppressor protein in human cancer. Nature Cell Biology. 2013;15:967–977. doi: 10.1038/ncb2795. [DOI] [PubMed] [Google Scholar]
- Verhaak RG, Hoadley KA, Purdom E, Wang V, Qi Y, Wilkerson MD, Miller CR, Ding L, Golub T, Mesirov JP, Alexe G, Lawrence M, O'Kelly M, Tamayo P, Weir BA, Gabriel S, Winckler W, Gupta S, Jakkula L, Feiler HS, Hodgson JG, James CD, Sarkaria JN, Brennan C, Kahn A, Spellman PT, Wilson RK, Speed TP, Gray JW, Meyerson M, Getz G, Perou CM, Hayes DN, Cancer Genome Atlas Research Network Integrated genomic analysis identifies clinically relevant subtypes of glioblastoma characterized by abnormalities in PDGFRA, IDH1, EGFR, and NF1. Cancer Cell. 2010;17:98–110. doi: 10.1016/j.ccr.2009.12.020. [DOI] [PMC free article] [PubMed] [Google Scholar]
- Vousden KH, Lane DP. P53 in health and disease. Nature Reviews Molecular Cell Biology. 2007;8:275–283. doi: 10.1038/nrm2147. [DOI] [PubMed] [Google Scholar]
- Wang Y, Yang J, Zheng H, Tomasek GJ, Zhang P, McKeever PE, Lee EY-HP, Zhu Y. Expression of mutant p53 proteins implicates a lineage relationship between neural stem cells and malignant astrocytic glioma in a murine model. Cancer Cell. 2009;15:514–526. doi: 10.1016/j.ccr.2009.04.001. [DOI] [PMC free article] [PubMed] [Google Scholar]
- Wen PY, Kesari S. Malignant gliomas in adults. New England Journal of Medicine. 2008;359:492–507. doi: 10.1056/NEJMra0708126. [DOI] [PubMed] [Google Scholar]
- Wen PY, Yung WK, Lamborn KR, Dahia PL, Wang Y, Peng B, Abrey LE, Raizer J, Cloughesy TF, Fink K, Gilbert M, Chang S, Junck L, Schiff D, Lieberman F, Fine HA, Mehta M, Robins HI, DeAngelis LM, Groves MD, Puduvalli VK, Levin V, Conrad C, Maher EA, Aldape K, Hayes M, Letvak L, Egorin MJ, Capdeville R, Kaplan R, Murgo AJ, Stiles C, Prados MD. Phase I/II study of imatinib mesylate for recurrent malignant gliomas: north american brain tumor consortium study 99-08. Clinical Cancer Research. 2006;12:4899–4907. doi: 10.1158/1078-0432.CCR-06-0773. [DOI] [PubMed] [Google Scholar]
- Westphal CH, Rowan S, Schmaltz C, Elson A, Fisher DE, Leder P. Atm and p53 cooperate in apoptosis and suppression of tumorigenesis, but not in resistance to acute radiation toxicity. Nature Genetics. 1997;16:397–401. doi: 10.1038/ng0897-397. [DOI] [PubMed] [Google Scholar]
- Zhang T, Cronshaw J, Kanu N, Snijders AP, Behrens A. UBR5-mediated ubiquitination of ATMIN is required for ionizing radiation-induced ATM signaling and function. Proceedings of the National Academy of Sciences of the United States of America. 2014;111:12091–12096. doi: 10.1073/pnas.1400230111. [DOI] [PMC free article] [PubMed] [Google Scholar]
- Zheng H, Ying H, Yan H, Kimmelman AC, Hiller DJ, Chen A-J, Perry SR, Tonon G, Chu GC, Ding Z, Stommel JM, Dunn KL, Wiedemeyer R, You MJ, Brennan C, Wang YA, Ligon KL, Wong WH, Chin L, DePinho RA. P53 and pten control neural and glioma stem/progenitor cell renewal and differentiation. Nature. 2008;455:1129–1133. doi: 10.1038/nature07443. [DOI] [PMC free article] [PubMed] [Google Scholar]