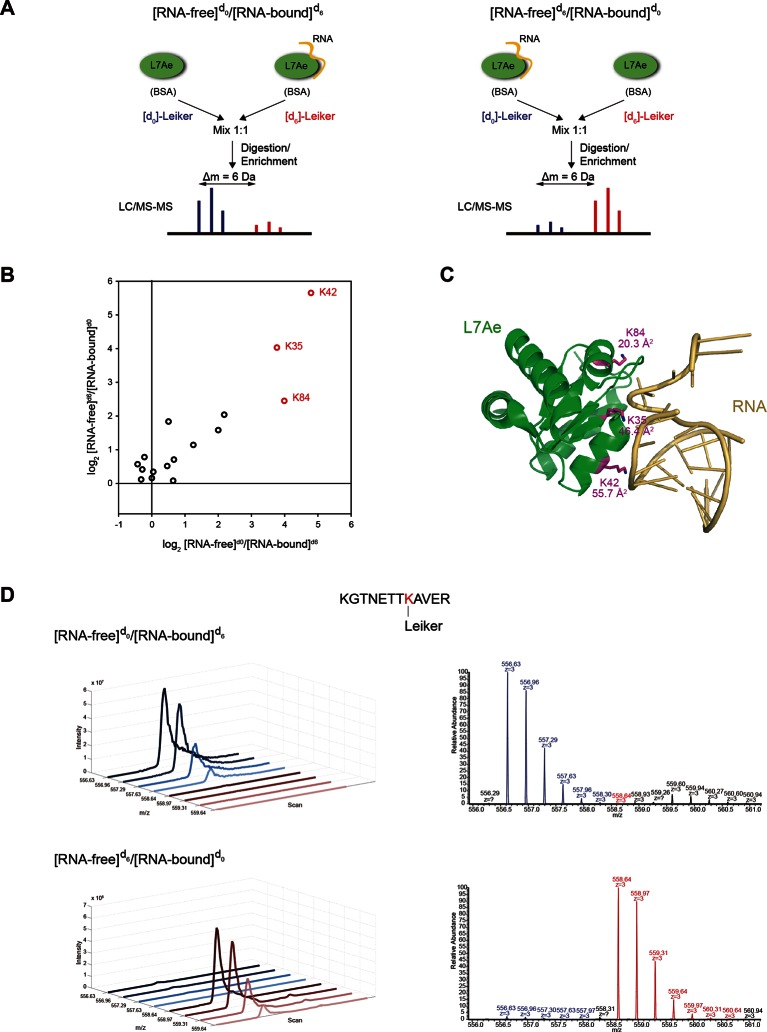
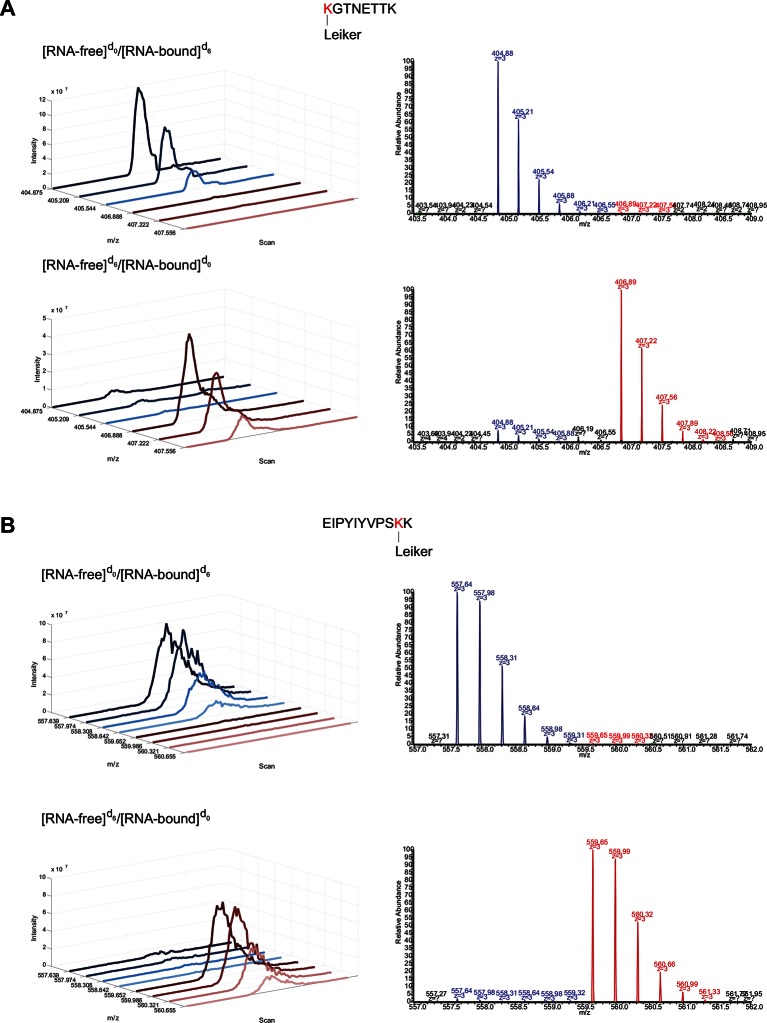
Figure 7. Quantitative CXMS analysis of the L7Ae-RNA complex.
(A) Reciprocal labeling of RNA-free (F) and RNA-bound (B) L7Ae with [d0]/[d6]-Leiker. (B) Abundance ratios of mono-links (F/B) in the forward (F[d0]/B[d6]) and the reverse labeling experiment (F[d6]/B[d0]). Each circle represents a mono-linked lysine residue and is colored red if it has a ratio greater than five in both labeling schemes. (C) The three lysine residues affected by RNA binding are highlighted in the structure model (PDB code: 2HVY). The number below each such lysine residue indicates the buried surface area (Å2) upon RNA binding. (D) Extracted ion chromatograms (left) and representative MS1 spectra (right) of a K42 mono-link.
DOI: http://dx.doi.org/10.7554/eLife.12509.035


