Abstract
Background
Cerebral autoregulation (CA) enables the brain to maintain stable cerebral blood flow (CBF). CA can be assessed non-invasively by determining correlations between cerebral blood flow velocity (CBFV) and spontaneous changes in blood pressure. Post-recording signal analysis methods have included both frequency- and time-domain methods. However, the test-retest reliability, cross-validation, and determination of normal values have not been adequately established.
Methods
In 53 healthy volunteers a transfer function analysis was applied to calculate phase shift (PS) and gain in the low frequency range (0.06-0.12 Hz) where CA is most apparent. Correlation analysis was used to derive mean velocity index (Mx). Intra-class correlation and bivariate correlation coefficients were applied to assess asymmetry, cross-validity, and test-retest
Results
The bihemispheric average PS, gain and Mx means were 45.99+/−14.24 degrees, 0.62+/−0.38 cm/sec/mm Hg and 0.41+/− 0.13 respectively. Gain exhibited a difference by age (p=0.03). PS, gain and Mx values showed excellent inter-hemispheric correlation (r>0.8; p<0.001). PS and gain showed good reliability (R ICC=0.632, L ICC=0.576; p<0.001). PS and Mx showed fair correlation (r=−.37; p<0.001).
Conclusions
CA parameters obtained by time- and frequency-domain methods correlate well, and show good inter-hemispheric and test-retest reliability. Group means from healthy controls may provide adequate norms for determining abnormal CA in cerebrovascular patients.
Keywords: cerebral autoregulation, transcranial doppler phase shift, autoregulatory index, gain
Introduction
Under normal circumstances, cerebral blood flow (CBF) is well regulated to meet the metabolic needs of the brain, adjusting to alterations of cerebral perfusion pressure (CPP) through unique, native properties of the brain and its vasculature. This process is called cerebral autoregulation.1,2 Over the last decade and with advances in operational informatics and neuroimaging, a diversity of methods for monitoring of cerebral autoregulation has been implemented in a variety of clinical settings including traumatic brain injury (TBI), stroke and intracranial hemorrhage.3-5 Acquired information enables clinicians to assess the cerebral autoregulatory status by measuring cerebrovascular reserve at steady-state blood pressure (static autoregulation) or during the response to a rapid change in blood pressure (dynamic cerebral autoregulation -- DCA).
The study of the dynamics of pressure-flow relationship of cerebral circulation can be performed by analyzing the physiological signal at various discrete times (time domain) or at frequencies of interest (frequency domain). Mean velocity index (Mx) is a time domain method to measure DCA by calculating a time average Pearson correlation coefficient between cerebral blood velocity (CBFV) and mean arterial pressure (MAP) over a given time period.6 Transfer function analysis (TFA) is a frequency domain technique that assesses cerebral blood flow regulation by determining the independence of oscillations of systemic blood pressure and cerebral flow velocities at a specified frequency range7, 8. In both methods Transcranial Doppler ultrasonography (TCD) insonating large cerebral vessels is used as a surrogate for cerebral blood flow. Based on the clinical context, MAP can be measured invasively -by using arterial catheterization-, or a non-invasively - by using servo-controlled finger plethysmography.
Mx has been previously cross-validated with transfer function analysis and CO2 reactivity methodologies in patients with different levels of severe carotid stenosis.9 We have also found that cerebrovascular reactivity index might negatively correlate with the percentage of decrease in TFA values during carbon dioxide (CO2) inhalation across healthy individuals.10 However, normal Mx and TFA values have primarily derived from studies performed in patients that had brain injury secondary to trauma or ischemia. Thus, some studies have encountered cut-offs and absolute values that might differ in healthy subjects11, 12. Moreover, the DCA test-retest reliability measured by TFA between recordings in the same subject remains unreported. Establishing norms and reliability will allow absolute quantification for use in research studies and clinical monitoring. Such information is crucial in interpreting longitudinal data since in the clinical setting DCA changes could be the result of a disease process, a physiological intervention, or the measurement variability of the test. In addition, we wished to examine hemispheric asymmetry and age effect because dynamic autoregulation was found to exhibit slight asymmetry and not to be impaired in elderly healthy controls when DCA was measured before and after increasing BP by applying an external stimuli 13,14.
In this study we aimed to determine the correlation between time domain and frequency domain methods, and evaluate their reliability over time in healthy individuals by studying the response of CBFV to spontaneous BP fluctuations. Specifically we tested the hypothesis that Mx and TFA by phase shift and gain would be correlated in healthy control subjects. In addition we assessed Mx and TFA intra-subject reliability at two different time points. Secondary aims evaluated the asymmetry between hemispheres of healthy individuals and the effect of age and gender in DCA.
Methods
Subjects and measurements
Healthy volunteers were recruited from the faculty and staff at Columbia Presbyterian Medical Center. All individuals were free of cardiovascular, pulmonary and cerebrovascular diseases. Subjects were provided with detailed written information regarding the intent and methods of the study. Approval for the study was obtained from the Institutional Review Board.
Measurements were performed in supine position with 45 ° inclination of the upper body, while the subjects were breathing spontaneously. Cerebral blood flow velocities (CBFV) were assessed using transcranial Doppler (DWL-Multidop-X, Sipplingen, Germany). The left and right proximal middle cerebral artery was insonated through the temporal window with a 2 MHz probe attached to a head frame. Depth of insonation was 50-60 mm. Arterial blood pressure (ABP) was recorded simultaneously via non-invasive servo-controlled in-phase finger plethysmography (Finometer Pro, Amsterdam, Netherlands) with the subject's right hand positioned at heart level. The appropriate finger cuff (Size: small, medium or large) was placed on the middle phalanx of the left or right middle finger. After the routine calibration procedure and establishing a stable recording based on the arterial blood pressure waveform appearance the calibration was turned off and data was recorded for 10 minutes. All parameter recorded in analog signals at 100 Hz, were digitized, and stored. Prior to data analysis a temporal synchronizing of the ABP and both CBFV signals was performed using ICUpilot software (Dipylon Medical, Solna, Sweden). Deletion of major artifact was done by visual inspection using the same program.
Mean Velocity Index (Mx)
The time domain correlation coefficient analysis to establish Mx was obtained based on a described method in several investigations 6. In an initial step, CBFV and ABP mean values were calculated with the use of waveform time integration for 3-second periods, after which 20 consecutive, 3-second averages of mean ABP and CBVF were used to calculate the Pearson's correlation coefficient. The resulting set of 1-min correlation coefficients was then averaged yielding the autoregulatory index Mx for the whole monitoring period. A positive coefficient signifies a positive association between CBFV and perfusion pressure, interpreted as impaired autoregulation. A zero or negative correlation coefficient would indicate intact autoregulation15. In contrast to the frequency domain methods, the time domain method does not require stationary assumption and it will work just as well even when the linearity assumption is not valid.
Transfer function analysis
Transfer the estimation of spectra and transfer function was calculated based the method described by Welch 16using Matlab (MathWorks, Natick, USA) with parameters determined by an in-house written program. The three signals (ABP, and both CBFV) were mean subtracted prior to frequency spectrum analysis. The transfer function H(f) relating each CBFV to ABP was approximated by assuming linearity and time invariance and calculated as follows:
where Sxx(f) represented the autospectrum of ABP and Sxy(f) represented the cross spectrum of ABP and each CBF.
The gain |H(f)| and phase Φ(f) of the system were calculated from H(f) as follows:
where Hr(f) represented the real component and Hi(f) represented the imaginary component of the transfer function H(f).
The squared coherence γ2(f) was approximated as follows:
where Sxy(f) and Sxx(f) were as described above and Syy(f) represented the autospectrum of each CBF.
Spectra were calculated using individual segments 1/6th the total length of the time series with 50% overlap. Given the 10 minute recordings at 100Hz, this came to be segments of 10000 points with 5000 points of overlap. Smoothing was accomplished by employing a Hanning window w(n) of length L equivalent to the individual segment:
Where L = N+1.
Coherence significance criterion (γmin), above which coherence differs significantly from 0, was derived from the degrees of freedom ν of the spectral estimate at a significance level α of 0.0516:
Estimates of the degrees of freedom of the Welch method with smoothing using Hanning window was performed 14. Employing this estimate, with 50% overlap between segments, ν = 19.6. Using the above formula for coherence significance level, γmin = 0.5372 with 50% overlap. For estimation of the cerebral regulatory capacity, a low-frequency range (0.06 to 0.12) was analyzed18. Phase shifts and gains were calculated only for measurements that fell above the coherence significance level threshold >0.5372. Output values for phase shift and gain were determined using the CBFV and ABP oscillations for both MCA sides at each target frequency within the range, which were averaged and reported as DCA value. A lower phase shift indicated poorer autoregulation status. Although gain interpretation is less understood, higher gains may reflect poorer regulatory control 9.
Statistical Analysis
Continuous variables were assessed for normality by using the Kolmogorov-Smirnov test. Normally distributed data were reported as a means and standard deviation (SD). Means were compared by using paired Student T-test. Quartiles were compared using one-way ANOVA with Bonferroni correction to adjust for multiple comparisons. The level of agreement between the DCA estimates (phase, gain and Mx) and test-retest reliability was assessed by Pearson's correlation coefficient, and Intraclass correlation coeficients (ICC). A p-value of less than 0.05 was considered statistically significant. For additional intra-subject variability assessment, Bland-Altman plots were used. The Bland–Altman analysis consists of plotting the difference between two parameters or the same parameter at two different times (repeatability) against the mean of these two parameters. Given approximate normality in the distribution of the differences, the 95% confidence interval for method agreement is the mean difference ±1.96 standard deviations. A small mean difference indicates small measurement bias, while a small variance indicates good inter-measurement agreement19.
Results
DCA parameters and hemispheric asymmetry assessment
A total of 53 healthy subjects (30F/ 22M) with mean age of 44.4 years (range 21-74) voluntarily participated in the study. One patient was excluded from the analysis due to the absence of suitable acoustic windows. The majority of patients were whites (61% whites; 17% Hispanic; 15% Asians; and 4% African American). The bihemispheric MAP and CBFV means were 85 +/− 13 mm Hg and 60.03+/− 11.90 cm/sec. The bihemispheric average PS, gain and Mx means were 45.99+/−14.24 degrees, 0.62+/− 0.38 cm/sec/mm Hg and 0.41+/− 0.13 respectively. Mean coherence at the frequency of interest (0.06 to 0.12) was 0.81+/− 0.093 and the median number of and 39/53 controls had all seven values >0.53 (range 4-7).
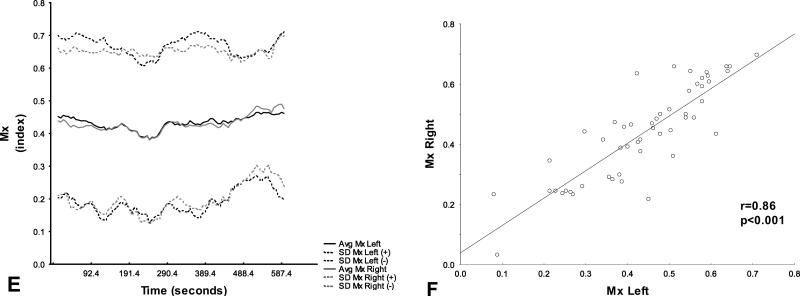
A detailed right to left comparison revealed that there were no mean hemispheric differences in any of the DCA parameters (table 1). PS, gain and Mx values showed an excellent positive correlation (r>0.8; p<0.001) between hemispheres (figure 1). Hemispheric comparison of CBFV correlation coefficient also revealed a good correlation (r=0.77; p<0.001).
Table 1.
Right to left hemispheric comparison of DCA parameters and CBF.
| Left | Right | Mean Difference | 95% CI of Difference | p value | |
|---|---|---|---|---|---|
| Phase shift (degrees) | 46.570 (18.160) | 47.769 (17.446) | −1.2 | −3.531 - 1.131 | 0.306 |
| Gain (cm/sec/mmHg) | 0.594 (0.438) | 0.539 (0.435) | 0.055 | −0.016 - 0.126 | 0.127 |
| Coherence (index) | 0.797 (0.102) | 0.795 (0.102) | 0.002 | −0.013 - 0.017 | 0.753 |
| Mx (index) | 0.440 (0.145) | 0.439 (0.154) | 0.001 | −0.022 - 0.024 | 0.94 |
| CBFV (cm/sec) | 57.980 (13.459) | 56.562 (14.179) | 1.418 | −1.197 - 4.033 | 0.282 |
cm: centimeters; sec: seconds; Mx mean velocity index; mmHg: millimeters of mercury; CVFV: cerebral blood flow velocities.
Figure 1A-F. Hemispheric DCA parameters.
Hemispheric average (solid line) +/− standard deviation (dashed line) and correlation coefficient with regression line of phase shift (A and B), gain (C and D), and Mx (E and F) between mean ABP and CBFV in healthy controls. Gray areas represent frequency range of interest at which values were calculated (0.06-0.12 Hz).
DCA differences on age and gender
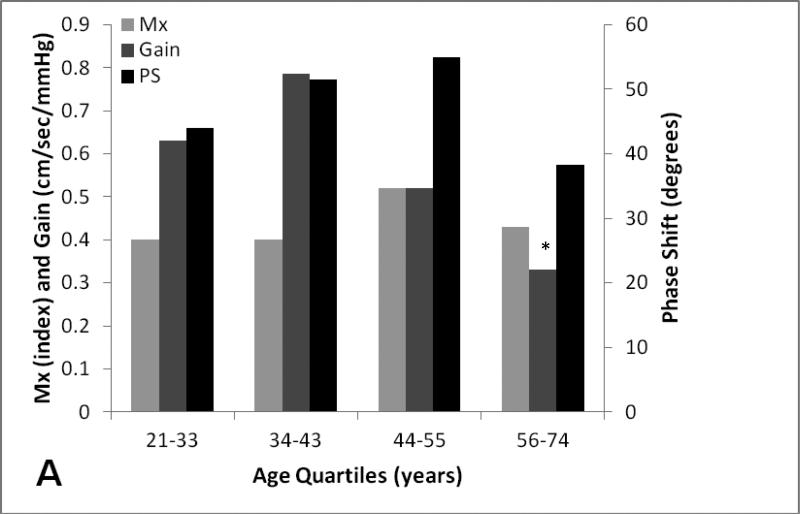
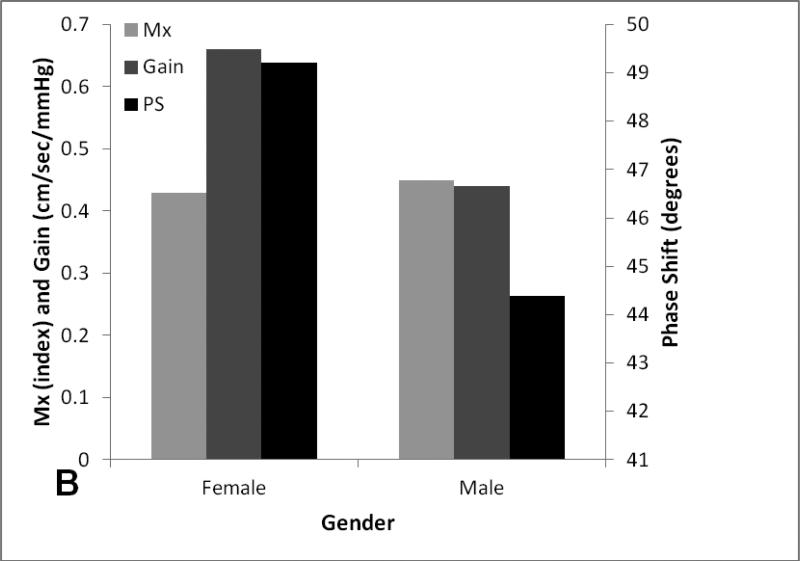
One-way ANOVA analysis revealed on age quartiles (n=13) revealed that there was a significant difference in mean gain (p=0.03) between the second (34-43) and fourth age quartile (56-74). There were no differences in mean PS, Mx between different quartiles. (figure 2).
Figure 2A-B. Age and gender effect on dynamic cerebral autoregulatory parameters.
Average and standard errors of DCA parameters and CBF stratified by age quartiles (A) and gender (B).
Mx and TFA cross validation
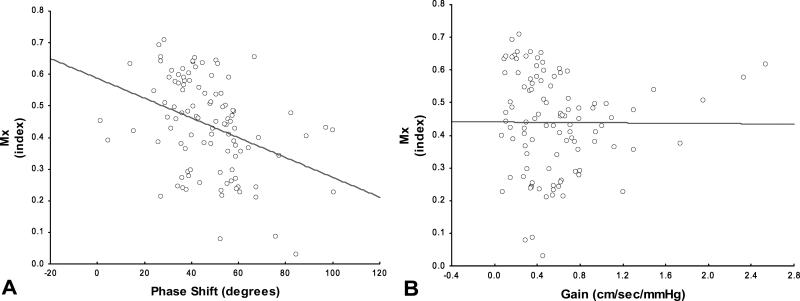
Cross correlations between time domain and frequency domain methods hemispheric averages were summarized in figure 3. PS showed a significant negative correlation with Mx (r=−.37; p<0.001), indicating that despite both parameters intend to measure autoregulation, there exist some differences between parameters. In contrast gain did not have significant correlation when compared with Mx (r=−0.022; p=.878).
Figure 3A-B. Time domain-TFA cross validation.
Scatterplot with regression line of phase between average Mx and PS shift (A) and Mx and gain (B).
Test retest reliability
A total of 19 patients had a second DCA assessment performed at median time of 17 days (IQR: 5-27). Relative reliability measured by ICC in all cerebral autoregulatory parameters and CBFV were shown in table 2. Phase shift and gain showed significant fair to good reliability (R ICC=0.632, L ICC=0.576; p<0.001) that was comparable to the coefficients obtained for CBFV, a clinically used parameter for monitoring the incidence of vaspospasm in subarachnoid hemorrhage patients. The corresponding 95% CI were fairly broad, suggesting that the estimates were subjected to a wide intra-subject variability. The lowest ICC and broader 95% CIs were obtained for Mx.
Table 2.
ICC and mean comparisons of autoregulatory parameters and cerebral blood flow velocities at two different time points.
| ICC | 95% CI | p-value | Mean differences | p-value | |
|---|---|---|---|---|---|
| Left Phase shift (degrees) | 0.632 | 0.262 - 0.840 | 0.0 01 | 3.81 | 0.276 |
| Right Phase shift (degrees) | 0.576 | 0.178 - 0.812 | 0.004 | 1.15 | 0.718 |
| Left Gain (cm/sec/mmHg) | 0.635 | 0.266 - 0.841 | 0.001 | 0.2 | 0.033 |
| Right Gain (cm/sec/mmHg) | 0.54 | 0.127 - 0.794 | 0.007 | 0.07 | 0.497 |
| Left Mx (index) | 0.456 | 0.015 - 0.748 | 0.022 | −0.02 | 0.672 |
| Right Mx (index) | 0.416 | −0.034 - 0.726 | 0.034 | 0.02 | 0.691 |
| Left CBFV (cm/sec) | 0.645 | 0.282 - 0.847 | 0.001 | 5.88 | 0.05 |
| Right CBFV (cm/sec) | 0.517 | 0.095 - 0.781 | 0.01 | 1.14 | 0.696 |
ICC: intraclass correlation; cm: centimeters; sec: seconds; Mx mean velocity index; mmHg: millimeters of mercury; CVFV: cerebral blood flow velocities.
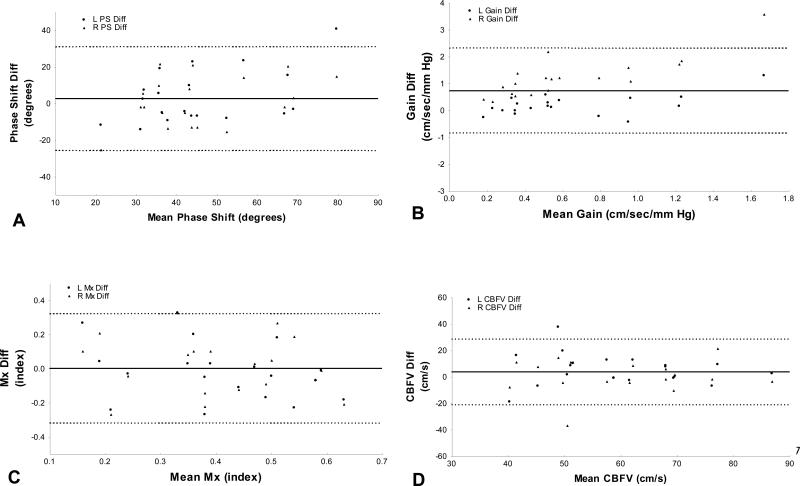
Figure 4 shows the Bland-Altman plots of phase shift, gain, Mx and CBFV in both hemispheres. With the exception of one outlier in each parameter, the measurement differences remained between 2 standard deviations, which is considered acceptable19
Figure 4A-D. Test-retest reliability.
Bland-Altman plots of phase shift (A), gain (B), Mx (C) and CBFV (D). Triangles represent values from the left MCA, circles those from the right MCA.
The bias (solid line) and 95% confidence interval (dashed lines) are presented.
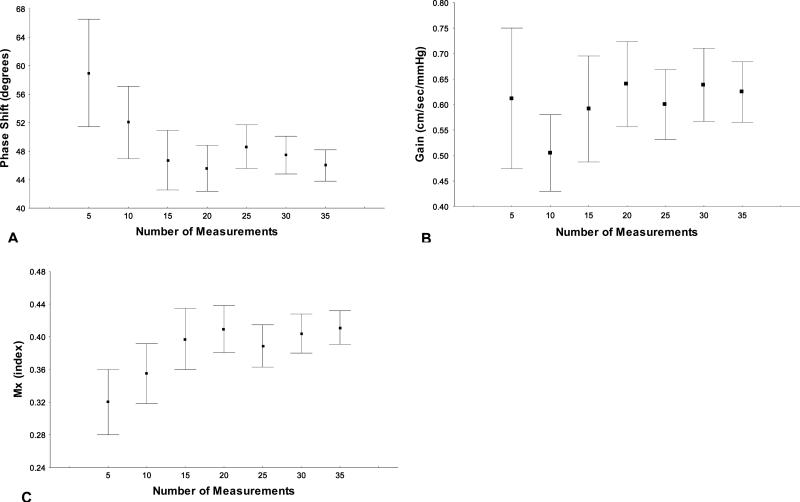
There were no significant differences in means values of any parameter between the two longitudinal measurements (table 2). To estimate the variability attributed to the number of measurements used in group mean comparisons, a stratified analysis by number of measurements was performed for all DCA parameters (figure 5). Mean and CI's variability consistently diminishes when the number of values used was ≥ 15 for all parameters.
Figure 5A-C. DCA's parameters values based on the number of measurements.
Means and confident intervals variation of phase shift (A), gain (B) and Mx (B) stratified by number of measurements included in the study.
Discussion
Our findings suggest that among healthy controls: 1) DCA measurements were symmetric between hemispheres 2) PS and Mx did not differ significantly by age and gender ; 2) Mx and PS have a fair correlation; and 3) both methodologies offer a fair to good test-retest reliability, comparable to CBFV, a parameter used in clinical practice.
Assessment of DCA is currently most commonly performed by evaluating responses of CBFV to single-step BP challenges or to spontaneous fluctuations in BP. Studies using BP challenges have shown an asymmetric hemispheric DCA response in autoregulatory index (ARI) and Mx (both time-domain methods) in patients suffering from TBI and stroke.13. Healthy volunteers in the same study and a similar one showed, slight or absent asymmetry.13, 17 Our results confirmed a lack of hemispheral asymmetry among healthy controls, which held for Mx, gain and phase shift. Hemispheral symmetry as a norm is clearly of importance to study focal hemispheric disease processes, such as stroke or intracranial hemorrhage. Based on these results, the non-affected hemisphere can potentially be used as a reference for paired comparisons between affected and non-affected hemisphere, although contralateral involvement due to factors such as midline shift, edema or bilateral ischemia could alter the “normal” hemisphere.
We also found that there were no age-related mean differences in PS and Mx, suggesting that DCA remains intact in elderly patients, confirming findings from previous research12 In our study, people 56-74 years of age had significant lower means when compared to people 34-43 years of age, the group with the highest gain which conflicts the work of Narayanan et al., in which gain remained unchanged in the elderly and showed higher mean gain values when compared to our elderly population (0.74+/− 0.24 cm/sec/mm vs 0.33+/− 0.22 cm/sec/mm. Explanations for this difference might be due to discrepancies in the frequency range of interest (0.07-0.012 versus 0.05-0.2) could have contributed to these differences. In fact, Sammons et al. previously observed distinct absolute values when he measured low frequency (0.0-0.1Hz) and mid frequency (0.1-0.25Hz) gain by using finger plethysmography in 45 subjects who underwent elective percutaneous coronary interventions 20. Because of these inconsistencies between labs, the different reported frequencies of gain measurement and its uncertain physiological significance, we believe gain might not be ideal for use in clinical research at this time.
When time domain and frequency domain techniques were compared, we observed a moderate to highly significant correlation between Mx and phase shift that was similar to the results obtained by Reinhard et al. in carotid stenosis patients.9. While both techniques measured DCA, the differences in variance and the small sample size probably contributed to a reduction of the strength of the correlation. We did not find any significant correlation between Mx and gain. In addition several individuals exhibited Mx values above 0.3, the normal threshold cut-off that has widely been used by Czosnyka et al in TBI patients 6. In fact, as seen in figure 1, the mean Mx moving correlation coefficient was around 0.4, which agrees with previous results and suggests that a different cut-off value may need to be reconsidered for healthy individuals. Whether this difference may be related to the use of sedative medications that may have altered DCA status in brain injury patients, will need to be further evaluated21.
Understanding the physiological variability of cerebral autoregulation using spontaneous fluctuations over time in healthy subjects remains essential in further interpreting results in different clinical scenarios. Birch et al. demonstrated low phase shift variability when lower negative pressure was used to induce BP variability in five healthy individuals22. Brodie et al. were the first to report reliability measuring DCA with spontaneous BP fluctuation. They found that antiregulatory index (ARI), a time-domain parameter, had a fair longitudinal reliability comparable to CBFV in 10 healthy subjects during four different serial measurements23. We found a fair to good test/retest ICC in phase shift and gain values. Mx showed lower longitudinal reliability and more variability. Our CBF ICC was also lower compared with results reported by other groups, where the CBFV intraclass correlation was 0.8. Potential explanations for this difference might arise from alterations in locating an accurate ultrasonic window, incorrect assessment of depth of sample volume and the changes in the angle of insonation24.
Nevertheless the wide 95% CIs agreement it is far from optimal and potentially reflect the wide physiological variability of DCA during 10 min recording. This variability should caution against relying on single individual measurements of DCA. Instead, given the homoscedastic distribution of time domain and frequency domain parameters, mean group values from healthy patient hemispheres or from control population might need to be used for longitudinal data analysis. The calculation of our mean values provides a data set to establish threshold cut-offs for clinical use. For example, 1.5 S.D. below the mean PS would be a phase shift of 25 degrees, a potential threshold for distinguishing ‘normal vs. “abnormal” autoregulatory status.
Limitations
There are several limitations to the present study. Firstly, while this study contains the largest population of healthy control individuals reported to date, age stratification analysis only contained 13 subjects per quartile, which is less than the minimum of 15 measurements we found were needed to obtained accurate estimated population DCA mean values with lower 95% CI. Secondly, the second measurement was performed at different intervals between subjects. Although this resembles a more realistic clinical scenario where consecutive measurements might not be performed in constant times, it adds additional variability to the estimated measure and therefore increases the error. Finally the potential variation due to circadian rhythm was not considered.
Conclusion
This study provides evidence that age and gender do not affect DCA measurements using either time domain or frequency domain methods. In addition, to our knowledge this is the first study to assess hemispheric symmetry and test-retest reliability of phase shift derived from spontaneous fluctuations in BP. DCA measured by PS and gain does not differ between hemispheres in healthy individuals and possesses good reliability. Finally group comparisons using means from affected-unaffected hemispheres or using healthy control norms may be established to evaluate individual patients.
Acknowledgments
Grant Support:R01 NS076277/NS/NINDS NIH HHS/United States
References
- 1.Powers WJ, Grubb RL, Jr., Darriet D, Raichle ME. Cerebral blood flow and cerebral metabolic rate of oxygen requirements for cerebral function and viability in humans. J Cereb Blood Flow Metab. 1985;5:600–608. doi: 10.1038/jcbfm.1985.89. [DOI] [PubMed] [Google Scholar]
- 2.Derdeyn CP, Videen TO, Yundt KD, Fritsch SM, Carpenter DA, Grubb RL, Powers WJ. Variability of cerebral blood volume and oxygen extraction: Stages of cerebral haemodynamic impairment revisited. Brain. 2002;125:595–607. doi: 10.1093/brain/awf047. [DOI] [PubMed] [Google Scholar]
- 3.Radolovich DK, Aries MJ, Castellani G, Corona A, Lavinio A, Smielewski P, Pickard JD, Czosnyka M. Pulsatile intracranial pressure and cerebral autoregulation after traumatic brain injury. Neurocrit Care. 2011;15:379–386. doi: 10.1007/s12028-011-9553-4. [DOI] [PubMed] [Google Scholar]
- 4.Reinhard M, Rutsch S, Lambeck J, Wihler C, Czosnyka M, Weiller C, Hetzel A. Dynamic cerebral autoregulation associates with infarct size and outcome after ischemic stroke. Acta Neurol Scand. 2012;125:156–162. doi: 10.1111/j.1600-0404.2011.01515.x. [DOI] [PubMed] [Google Scholar]
- 5.Nakagawa K, Serrador JM, LaRose SL, Sorond FA. Dynamic cerebral autoregulation after intracerebral hemorrhage: A case-control study. BMC Neurol. 2011;11:108. doi: 10.1186/1471-2377-11-108. [DOI] [PMC free article] [PubMed] [Google Scholar]
- 6.Czosnyka M, Smielewski P, Kirkpatrick P, Menon DK, Pickard JD. Monitoring of cerebral autoregulation in head-injured patients. Stroke. 1996;27:1829–1834. doi: 10.1161/01.str.27.10.1829. [DOI] [PubMed] [Google Scholar]
- 7.Diehl RR, Linden D, Lucke D, Berlit P. Phase relationship between cerebral blood flow velocity and blood pressure. A clinical test of autoregulation. Stroke. 1995;26:1801–1804. doi: 10.1161/01.str.26.10.1801. [DOI] [PubMed] [Google Scholar]
- 8.Reinhard M, Muller T, Guschlbauer B, Timmer J, Hetzel A. Transfer function analysis for clinical evaluation of dynamic cerebral autoregulation--a comparison between spontaneous and respiratory-induced oscillations. Physiol Meas. 2003;24:27–43. doi: 10.1088/0967-3334/24/1/303. [DOI] [PubMed] [Google Scholar]
- 9.Reinhard M, Roth M, Muller T, Czosnyka M, Timmer J, Hetzel A. Cerebral autoregulation in carotid artery occlusive disease assessed from spontaneous blood pressure fluctuations by the correlation coefficient index. Stroke. 2003;34:2138–2144. doi: 10.1161/01.STR.0000087788.65566.AC. [DOI] [PubMed] [Google Scholar]
- 10.Carrera E, Lee LK, Giannpoulos S, Marshall RS. Cerebrovascular reactivity and cerebral autoregulation in normal subjects. J Neurol Sci. 2009;285(1-2):191–4. doi: 10.1016/j.jns.2009.06.041. [DOI] [PubMed] [Google Scholar]
- 11.Lipsitz LA, Mukai S, Hamner J, Gagnon M, Babikian V. Dynamic regulation of middle cerebral artery blood flow velocity in aging and hypertension. Stroke. 2000;31:1897–1903. doi: 10.1161/01.str.31.8.1897. [DOI] [PubMed] [Google Scholar]
- 12.Yam AT, Lang EW, Lagopoulos J, Yip K, Griffith J, Mudaliar Y, Dorsch NW. Cerebral autoregulation and ageing. J Clin Neurosci. 2005;12:643–646. doi: 10.1016/j.jocn.2004.08.017. [DOI] [PubMed] [Google Scholar]
- 13.Aaslid R, Blaha M, Sviri G, Douville CM, Newell DW. Asymmetric dynamic cerebral autoregulatory response to cyclic stimuli. Stroke. 2007;38:1465–1469. doi: 10.1161/STROKEAHA.106.473462. [DOI] [PubMed] [Google Scholar]
- 14.Narayanan K, Collins JJ, Hamner J, Mukai S, Lipsitz LA. Predicting cerebral blood flow response to orthostatic stress from resting dynamics: Effects of healthy aging. Am J Physiol Regul Integr Comp Physiol. 2001;281:R716–722. doi: 10.1152/ajpregu.2001.281.3.R716. [DOI] [PubMed] [Google Scholar]
- 15.Budohoski KP, Reinhard M, Aries MJ, Czosnyka Z, Smielewski P, Pickard JD, Kirkpatrick PJ, Czosnyka M. Monitoring cerebral autoregulation after head injury. Which component of transcranial doppler flow velocity is optimal? Neurocrit Care. 2011 doi: 10.1007/s12028-011-9572-1. [DOI] [PubMed] [Google Scholar]
- 16.Lengyel,ba Welch P. introduction to laser physics. Opt Acta. 1967;14:211–&. [Google Scholar]
- 17.Tzeng YC, Willie CK, Atkinson G, Lucas SJ, Wong A, Ainslie PN. Cerebrovascular regulation during transient hypotension and hypertension in humans. Hypertension. 2010;56:268–273. doi: 10.1161/HYPERTENSIONAHA.110.152066. [DOI] [PubMed] [Google Scholar]
- 18.Zhang R, Zuckerman JH, Giller CA, Levine BD. Transfer function analysis of dynamic cerebral autoregulation in humans. Am J Physiol. 1998;274:H233–241. doi: 10.1152/ajpheart.1998.274.1.h233. [DOI] [PubMed] [Google Scholar]
- 19.Bland JM, Altman DG. Statistical methods for assessing agreement between two methods of clinical measurement. Lancet. 1986;1:307–310. [PubMed] [Google Scholar]
- 20.Sammons EL, Samani NJ, Smith SM, Rathbone WE, Bentley S, Potter JF, Paneirai RB. Influence of noninvasive peripheral arterial blood pressure measurements on assessment of dynamic autoregulation. J Appl Physiol. 2007;103(1):369–75. doi: 10.1152/japplphysiol.00271.2007. [DOI] [PubMed] [Google Scholar]
- 21.Ogawa Y, Iwasaki K, Aoki K, Kojima W, Kato J, Ogawa S. Dexmedetomidine weakens dynamic cerebral autoregulation as assessed by transfer function analysis and the thigh cuff method. Anesthesiology. 2008;109:642–650. doi: 10.1097/ALN.0b013e3181862a33. [DOI] [PubMed] [Google Scholar]
- 22.Birch AA, Neil-Dwyer G, Murrills AJ. The repeatability of cerebral autoregulation assessment using sinusoidal lower body negative pressure. Physiol Meas. 2002;23:73–83. doi: 10.1088/0967-3334/23/1/307. [DOI] [PubMed] [Google Scholar]
- 23.Brodie FG, Atkins ER, Robinson TG, Panerai RB. Reliability of dynamic cerebral autoregulation measurement using spontaneous fluctuations in blood pressure. Clin Sci (Lond) 2009;116:513–520. doi: 10.1042/CS20080236. [DOI] [PubMed] [Google Scholar]
- 24.Aaslid R, Markwalder TM, Nornes H. Noninvasive transcranial doppler ultrasound recording of flow velocity in basal cerebral arteries. J Neurosurg. 1982;57:769–774. doi: 10.3171/jns.1982.57.6.0769. [DOI] [PubMed] [Google Scholar]


