Abstract
Metastasis-associated protein 1 (MTA1) and its short form (MTA1s) regulate the function of estrogen receptors (ERs). Estrogens, via ERs, affect placental growth and fetal development, a process that may involve MTA1 signaling. Expression of MTA1, MTA1s, ERα, and ERβ genes and proteins in rat placentas was studied on 16, 19, and 21 days of gestation (dg). The ERβ messenger RNA decreased significantly toward the end of gestation, whereas its protein level increased in the nuclear fraction on 21 dg. Both MTA1 and MTA1s increased with gestation. Decidual, trophoblast giant, glycogen, and villous trophoblast cells expressed MTA1, ERα, and ERβ proteins on all dg with colocalization of MTA1 with ERα and ERβ in the nucleus and cytoplasm. Expression of MTA1 suggests a possible role in regulating placental functions; considering the repressive function of MTA1 on ERs, the expression of MTA1 suggests that placental cells may be less sensitive to estrogens during late pregnancy.
Keywords: placental growth, MTA1, estrogens, estrogen receptor alpha, estrogen receptor beta
Introduction
As an interface between mother and fetus, the placenta acts as a barrier between maternal and fetal circulation, limits trespassing of chemicals or drugs, supplies nutrition, mediates gas exchange and waste disposal as well as acts as an endocrine organ.1 Thus, a proper structural and physiological placentation is essential for normal fetal growth and pregnancy outcome.2 During pregnancy, the enhanced production of estrogens controls various aspects of placental function and fetal development. However, in rats, a minor elevation in maternal serum estradiol levels during pregnancy causes placental and fetal growth restriction.3 Therefore, estrogen action should be carefully regulated to prevent its deleterious growth-retarding effects so as to maintain a normal pregnancy. The actions of estrogens are mediated by the expression of its receptors,4 which either increase or decrease depending upon the activity of the hormone; thus, the growth-retarding effects of the hormone are generally nullified.5 Thus, it appears that estrogens play crucial roles in the development and maintenance of the placenta, although these mechanistic aspects of the hormone are not unequivocally proved in humans.6 The estrogen receptors (ERs), therefore, are the rate-limiting steps in estrogen action, but when activated, they regulate cellular functions via both genomic and nongenomic signaling pathways leading to transcription of target genes, which translate into functional proteins.6,7
The signaling and transcriptional activities of the ERs are influenced by a variety of coregulators; some of them belong to a relatively novel family of metastasis-associated protein genes (MTA).8 The MTA family has a set of 3 genes (MTA1, MTA2, and MTA3), which code for 6 protein isoforms (MTA1, MTA1s, MTA1-ZG29p, MTA2, MTA3, and MTA3L). The MTA1, MTA2, and MTA3 proteins are the components of the nuclear remodeling and histone deacetylation complex that modulate transcription and influence chromatin remodeling.9 Due to its ability to manipulate histone binding to DNA, MTA1 can regulate the transcription of genes coding for many tumor suppressors such as p53.10 Further, MTA1 also facilitates methylation of ERα and enhances the metastatic ability of breast cancer cells.11 Thus, overexpression of MTA1 is always associated with tumorigenesis and metastasis. Similar to epithelial–mesenchymal transition in cancer metastasis in which MTA1 has a crucial role,12 the protein might also have a role to play during trophoblast invasion and placentation, although this aspect of MTA1 function has not been studied.
Although MTA1 is expressed in many cancer tissues, it is also expressed in many normal tissues and organs suggesting a role in the regulation of transcription of some genes or DNA damage repair.13 Metastasis-associated protein 1 upregulates β catenin and cyclin D1 activities, which in turn activate the Wnt pathway that results in cell differentiation and proliferation.8 Metastasis-associated protein 1 interacts with the ERs and inhibits the effect of estradiol on ER transactivation.14 Furthermore, MTA1s (short isoform of MTA1) sequesters ERs in the cytoplasm and suppresses their genomic function.15 These findings may be indicative of involvement of MTA1 and MTA1s in regulation of estrogen actions and consequently placental growth. Moreover, MTA1 and MTA3 are also expressed in nuclei of trophoblast cells of human placenta, which also indicates a possible role for these proteins in trophoblast invasion.12 However, the expression of MTA1 and MTA1s in rat placentas at different days of normal pregnancy has not been previously reported. We have shown earlier that ERα and ERβ are expressed in rat placentas during the last third of gestation.5 However, thus far, there are no studies reporting the coexpression of the ERs and MTA1 in a functional placenta. In view of this, the present study was designed to investigate (1) the expression of the ERs and MTA1 at both messenger RNA (mRNA) and protein levels, (2) the localization of the proteins in different placental cells, and (3) the coexpression of proteins in the rat placenta during the last third of gestation.
Materials and Methods
Materials
Estradiol enzyme immunoassay (EIA) kit (solid plate; catalogue #582251.1) and the ultrapure water (catalogue # 400000) were obtained from Cayman Chemical Company, San Diego, California. Antibodies raised against MTA1 (a rabbit polyclonal antibody catalogue # H-166; sc-10813, Santa Cruz Biotechnology Inc, Dallas, Texas), ERα (mouse monoclonal antibody, catalogue # MAB463, Chemicon, Temecula, California), ERβ (rabbit polyclonal antibody, catalogue #07-359, Millipore Corporation, Billerica, Massachusetts), and β actin (mouse monoclonal antibody, catalogue # MAB1501R, Millipore Corporation, Billerica, Massachusetts) were used unless otherwise specified. Polyvinylidene difluoride (PVDF) membranes were obtained from GE Healthcare (Buckinghamshire, United Kingdom). Reverse transcription buffers, enzymes, and reagents were supplied by Invitrogen (Grand Island, New York). Real-time polymerase chain reaction PCR (ReT-PCR) reagents were purchased from Applied Biosystems (Grand Island, New York). The ReT-PCR TaqMan ERα primer/probe set (catalogue# Rn01430446_m1), ERβ primer/probe set (catalogue # Rn00562610_m1), and Vic/MGB-labeled 18S RNA primer/probe set (catalogue # 4319413E) were purchased from Applied Biosystems.
Animals and Tissue Collection
Adult female Sprague-Dawley rats were housed in the Animal Resources Centre at the Faculty of Medicine, Kuwait University, with free access to food and water. The rats were maintained in a 12-hour light–12-hour dark cycle at 22°C. The experiments were carried out in accordance with the guidelines of laboratory animal care in our institution. Female rats (60 to 70 days old) were mated with male rats (60 to 90 days old); pregnancy was verified by the presence of sperm in vaginal smears (day 0 of pregnancy). Pregnant dams were stunned and killed by cervical dislocation on 16, 19, and 21 days of gestation (dg). Uterine horns containing conceptuses were removed and placed on ice immediately. Fetuses and placentas were separated and placental tissues from the litters were pooled (4 pregnancies for each dg and 3 to 4 placentas/pregnancy). The fetuses and placentas were weighed, and the placental efficiency was determined by dividing the mean fetal body weight by the average weight of the placentas. Placentas were frozen at −70°C for protein analysis; the cryoprotective agent, dimethylsulfoxide, (10% v/v) was added before freezing. For RNA isolation and EIA, the samples were cryopreserved using liquid nitrogen and then stored at −70°C. Maternal serum and amniotic fluid were obtained for estradiol estimation by EIA at the time of killing.
Measurement of Estradiol Levels by EIA
The placentas were thawed at room temperature (rt), weighed, and suspended in phosphate buffer. The tissue (0.5 g/1 mL of the buffer) was homogenized for 1 minute and transferred to Eppendorf tubes and incubated on ice for 30 minutes. The homogenates were centrifuged at 15 000g for 5 minutes, and the supernatants were stored at −80°C until use. The estradiol levels in serum, amniotic fluid, and placentas were measured by the estradiol (E2) EIA kit (Cayman Chemical Company, Michigan) according to the manufacturer’s instructions.
RNA Isolation and Quantification
RNA extraction and reverse transcription
The total RNA was extracted using TRIzol method and washed with ethanol and dissolved in diethylpyrocarbonate-treated water at 55°C. The RNA concentration was determined by reading absorbance at 260 nm wavelength, and 2μg portions were used for reverse transcription. Intron-spanning primers were used in the study that excluded interference from genomic DNA in the results; however, all RNA samples were treated with DNAase (4 units/sample; Invitrogen) prior to reverse transcription.16 RNA of 2 μg was used for first-strand complementary DNA synthesis, which was performed with M-MLV reverse transcriptase (RT; Invitrogen) using random hexamer primers, according to the manufacturer’s instructions (RT+ samples). Negative controls (RT− samples) were processed under the same conditions but in the absence of RT, which was replaced by water.16
Real-time PCR
The ReT-PCR reaction was carried out in a ReT-PCR system (model 7500, Applied Biosystems), using the following gene expression assays: (1) TaqMan chemistry ID Rn01430446_m1 for ERα assay (expected amplicon length 73 bp), ID Rn00562610_m1 for ERβ assay (expected amplicon length 89 bp), and assay ID Hs99999901-sl for the internal control 18S (expected amplicon length 187 bp). (2) SYBR-green chemistry was used for detection of MTA1 and MTA1s: the forward and reverse primer sequences for MTA1 and MTA1s are as follows: sense primer MTA1wt_F: 5′-GAGCTGTTACACCACACAGTCTTA-3′ and an antisense primer MTA1_R: 5′-GCCTGGTCTTCATGGCAA-3′ giving a 230-bp product for MTA1; a sense primer MTA1del_S1: 5′-CTGCGAGAGCTGTTACATGT-3′ and the antisense primer MTA1_R giving a 180-bp product for MTA1s.17 The housekeeping gene β-glucuronidase was used as an internal control (forward primer: ATCGCCATCAACAACACAC and reverse primer TGACGCCTTGGAAGTAGAAAG). The PCR reactions were prepared using TaqMan or SYBR-green master mixes (Applied Biosystems) according to the manufacturers’ instruction. The PCR was then run as follows: 2 minutes at 50°C (1 cycle); 10 minutes at 95°C (1 cycle), 15 seconds at 95°C, and 1 minute at 60°C (40 or 60 cycles); this was followed by a dissociation step for 15 seconds at 95°C, 1 minute at 60°C, and 15 seconds at 95°C for 1 cycle (only for SYBR-green chemistry experiments). In all experiments, an RT− control and no template control, where water was added as sample, were included as negative controls, the former to exclude genomic DNA contamination and the latter to exclude any reagent contamination. All samples were run in duplicates; both RT− and water samples were negative (data not shown). In some cases, a 10-μL sample of the PCR product was analyzed by electrophoresis on a 2% agarose gel that contained ethidium bromide in order to verify that the product sizes were obtained as expected.
Western Blotting and Immunodetection
Isolation of proteins
Placentas were processed as described previously.5 The initial homogenate fraction (the total receptor/homogenate fraction) was centrifuged at 1000g for 10 minutes at 4°C. The supernatant was further centrifuged at 105 000g for 45 minutes at 4°C. The resultant supernatant (cytosol) was collected, and a sample was taken for protein estimation and Western blot analysis. The pellet from the first centrifugation was washed with 1 mL ice-cold homogenization buffer and again centrifuged at 1000g for 10 minutes at 4°C. The supernatant was discarded, and the pellet was then resuspended in 1 to 1.5 mL of extraction buffer (homogenization buffer containing 0.6 mol/L NaCl) and incubated on ice for 50 minutes with vortexing twice in between; the mixture was then centrifuged at 50 0000g for 30 minutes at 4°C. The supernatant, containing isolated nuclear proteins, was then collected. The proteins in the supernatant were precipitated by adding 6 volumes of ice-cold ethanol to the supernatant and kept overnight at −20°C and then centrifuged at 10 000g for 10 minutes at 4°C. The pellet was then resuspended in homogenization buffer, and a sample was taken for protein estimation and Western blot analysis.
Verification of cytosolic and nuclear fractions
Western blotting using the histone H4 antibody and glucose 6 phosphate dehydrogenase (G6PD) assay were the two methods employed for verification of nuclear and cytosolic fractions, respectively. The cytosolic and nuclear fractions were subjected to both protocols. In G6PD assay, the following reagents were used: 100 mmol/L Tris-HCl buffer, pH 8.0, 10 mmol/L glucose 6 phosphate, and 10 mmol/L nicotinamide adenine dinucleotide phosphate (NADP). In a glass cuvette, 800 µL of 100 mmol/L Tris-HCl buffer (pH 8.0), 100 µL of 10 mmol/L glucose 6 phosphate, and 100 µL of 10 mmol/L NADP were added. Cytosolic/nuclear fraction sample of 50 µg/µL was added to a cuvette and a reference reading was taken (auto-zeroing the spectrophotometer), followed by a reading at an absorbance of 340 nm wavelength automatically measured for 60 seconds. An absorbance profile (the change in absorbance [ΔA340] vs time in seconds) was provided by the spectrophotometer. A positive graph (ΔA > 0) indicates G6PD enzyme activity. To verify the purity of the nuclear fraction and to exclude contamination of the cytosolic fraction from any nuclear contaminants, Western blotting was carried out using the histone H4 antibody as outlined subsequently. Following immunodetection, 1 band with the size of interest (band size ∼35 kDa) was detected in the nuclear fraction only.
Western blotting
Western blotting and immunodetection with analysis of protein sizes were performed as described earlier.18 Briefly, 20 µg of protein (homogenates, cytosols, and nuclear fractions) and molecular weight rainbow markers were electrophoresed using either 7.5% sodium dodecyl sulfate polyacrylamide gel electrophoresis or gradient gels, and the proteins were then transferred to PVDF membranes. Membranes were then incubated with the following primary antibodies overnight at 4°C: (1) mouse monoclonal anti-ERα antibody (1:500 dilution in 10% nonfat dry milk in Tris-buffered saline with Tween 20 [TBS-T; 20 mmol/L Tris, 137 mmol/L NaCl, pH 7.6 and 0.1% v/v Tween], (2) rabbit polyclonal anti-ERβ antibody (1:100 dilution in 10% nonfat dry milk in TBS-T), and (3) rabbit polyclonal anti-MTA1 antibody (1:500 dilution in 10% nonfat dry milk in TBS-T). Membranes were stripped and incubated with the internal control antiactin antibody (1:50 000 in 5% nonfat dry milk in TBS-T) at rt for 1 hour. For verifying the purity of the nuclear fractions, the membrane was incubated with mouse monoclonal antihistone H4 antibody (1:500 in 10% milk; original concentration 200 µg/mL) for 1 hour at rt. Appropriate horseradish peroxidase -linked secondary antibodies were used at a dilution range of 1:20 000 to 1:40 000 in 10% nonfat dry milk in TBS-T and then washed. Secondary antibody incubation was done for 2 hours at rt. Detection was by chemiluminescence using the ECL-Plus kit (GE Healthcare). Results were expressed relative to actin.
Confocal microscopy
Sections of placentas with 3-µm thickness were deparaffinized in xylene and hydrated by passing through descending grades of alcohol. The sections were treated with phosphate-buffered saline (PBS; pH 7.35), and antigen retrieval was carried out by immersing the slides in 0.1 mol/L citrate buffer in a microwave oven. The sections were treated with PBS-Triton X, 3% hydrogen peroxide, and glycine and sodium borohydride. The sections were then treated with 5% bovine serum albumin. Double labeling for MTA1 (rabbit polyclonal antibody; 1:50; secondary antibody-goat-anti-rabbit FITC) and ERα (mouse monoclonal antibody; 1:50; secondary antibody-goat-anti-mouse TRITC), for MTA1 and ERβ (mouse monoclonal antibody; 1:50; secondary antibody-goat-anti-mouse TRITC), and for ERα and ERβ (rabbit polyclonal antibody; 1:50; secondary antibody-goat-anti-rabbit FITC) was carried out by a simultaneous labeling procedure. The primary antibodies were mixed and the sections were covered with the antibodies and incubated at 4°C overnight. The slides were removed, washed with PBS, and treated with appropriate secondary antibodies (1:250) for 1 hour and again washed with PBS. The sections were counterstained with 4′,6-diamidino-2-phenylindole (1:4000) for 1 minute, washed with PBS, and mounted with Vectashield mounting media (Vector Laboratories, Burlingame). The margins of the coverslips were covered with nail polish, and the slides were stored at 4°C. The slides were observed under a multifluorescence confocal microscopy (Zeiss LSM 510 META, Carl Zeiss Microscopy, New York), and representative photomicrographs were taken using 40× objective.
The immunoexpression of MTA1 and ERs was investigated in 4 main placental cell types: decidual cells, trophoblast giant cells (giant cells), glycogen cells, and villous trophoblast cells. The color intensity was directly proportional to the protein concentration in the cells. The coexpression of the proteins was investigated.
Statistical Analysis
Western blotting images were captured using Gene Genius Bio Imaging System (Syngene, Cambridge). The absorbance readings for target protein are expressed relative to those of internal control. The results for ReT-PCR studies were calculated using the comparative Ct method.19 Briefly, the ΔCt value was determined by subtracting the average housekeeping Ct values from the average target Ct values. The ΔΔCt was calculated by subtracting the ΔCt value of 19 and 21 dg from that of 16 dg, which was used as the calibrator. The normalized expression was determined using 2−ΔΔCt. All data are shown as mean ± standard error of the mean, unless otherwise stated, and a P value of <.05 was considered significant. Data were tested for statistical significance by analysis of variance followed by least significant difference post hoc analysis when the test for homogeneity of variance was fulfilled and using Games-Howell post hoc analysis when the homogeneity of variances was not attained (Software package for statistical analysis [SPSS] software, version 17).
Results
Body and Organ Weights
Body weights of fetuses and the ratio of body to placental weights increased with gestation (P < .01-.001). The placental weight increased significantly between 16 and 19 dg (P = .001) and between 16 and 21 dg (P < .001; Table 1).
Table 1.
Litter Size, Fetal Body Weights, and Placental Weights During Gestation.a
| Gestational Days, dg | Litter Number | Fetal Body Weight, g | Placental Weight, g | Fetal Body Weight/Placental Weight |
|---|---|---|---|---|
| 16 | 12 ± 2 | 0.41 ± 0.03 | 0.31 ± 0.01 | 1.34 ± 0.09 |
| 19 | 13 ± 1 | 2.21 ± 0.19b | 0.48 ± 0.04c | 4.58 ± 0.18d |
| 21 | 11 ± 1 | 4.64 ± 0.29e | 0.55 ± 0.01c | 8.46 ± 0.45d |
Abbreviation: SEM, standard error of the mean.
a Data are mean ± SEM; n = 4.
b P < .01 16 versus 19 dg and 16 versus 21 dg.
c P = .001 16 versus 19 dg; P < .001 16 versus 21 dg.
d P < .001 16 versus 19 dg, 16 vs 21 dg, and 19 vs 21 dg.
e P < .01 19 versus 21 dg.
Estradiol Level
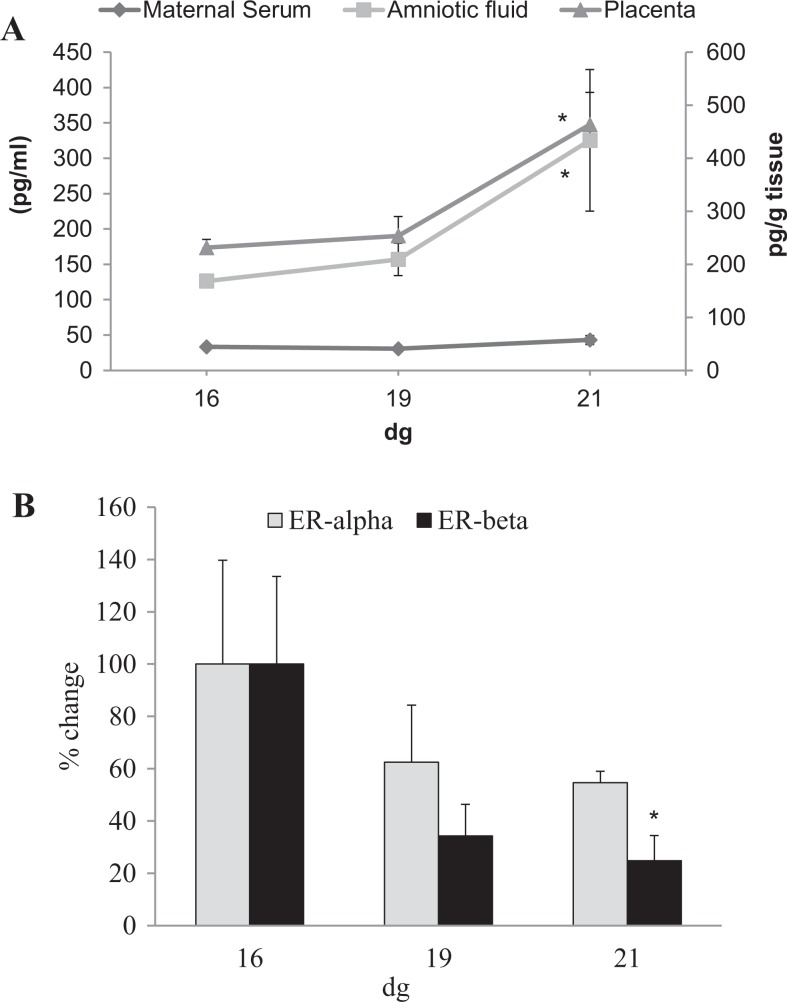
Estradiol level in maternal serum did not vary significantly between the three days of gestation. On the other hand, there was a significant increase (P < .05) in estradiol levels in the placental tissue and in the amniotic fluid on 21 dg when compared to that on 16 dg (Figure 1A). It should be noted that as whole unperfused placentas were homogenized, the presence of maternal and fetal trapped blood may have added to E2 levels.
Figure 1.
Estradiol levels and estrogen receptor (ER) transcript expression in rat placentas. A, Estradiol levels in maternal serum did not show any significant changes; however, in amniotic fluid and placentas, the hormone levels increased on 21 dg compared to that on 16 dg (*P < .05). B, Percentage change in ERα and ERβ messenger RNA (mRNA) expression on 19 dg and 21 dg after normalization with the expression on 16 dg, for each gene, respectively. No significant differences between the three dgs were observed for ERα mRNA. A significant percentage change in mRNA expression of ERβ was detected on 21 dg when normalized to the expression on 16 dg (*P < .05). Note that real-time PCR (ReT-PCR) for both the genes was conducted separately. Samples were run in duplicates; data are mean ± standard error of the mean (n = 4/group).
Expression of ER mRNA
The expression of both ERα and ERβ transcripts in rat placentas is shown in Figure 1B. No significant differences were detected among different dg in expression of ERα mRNA; however, there was a significant decrease in expression of ERβ mRNA on 21 dg when compared to that on 16 dg (P < .05).
Expression of MTA1 and MTA1s mRNA
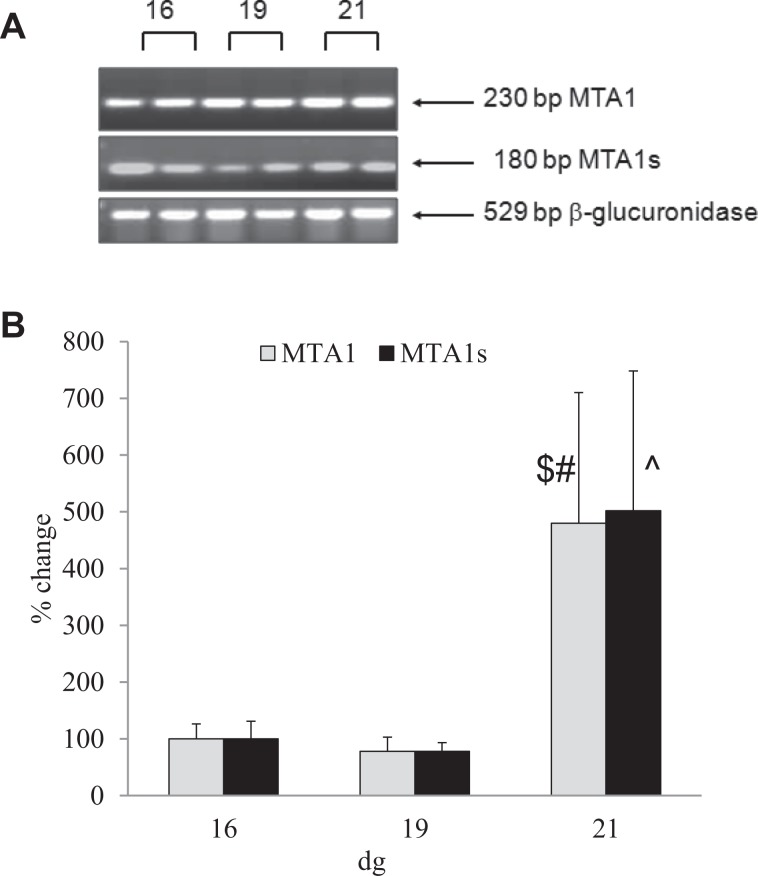
The mRNA for MTA1 and MTA1s was detected from 16 dg onward (Figure 2A). An increase in expression of MTA1 mRNA was detected on 21 dg compared to that on 16 and 19 dg (P < .01; Figure 2B). The expression of MTA1s gene increased between 19 and 21 dg (P < .05; Figure 2B).
Figure 2.
The expression of metastasis-associated protein 1 (MTA1) and MTA1s transcripts in rat placentas. A, Ethidium bromide-labeled gel for MTA1, MTA1s, and β glucuronidase (internal control) following real-time PCR (ReT-PCR). MTA1 and MTA1s were detected from 16 dg. Both negative controls (RT-) and water samples were negative (data not shown). B, A significant increase in expression of MTA1 mRNA was detected between 16 dg and 21 dg and 19 dg and 21 dg ($P < .001 and #P < .01, respectively). Expression of MTA1s increased between 19 dg and 21 dg (^P < .05). Samples were run in duplicates; data are mean ± standard error of the mean (n = 4/group).
Expression of MTA1 and ER Proteins
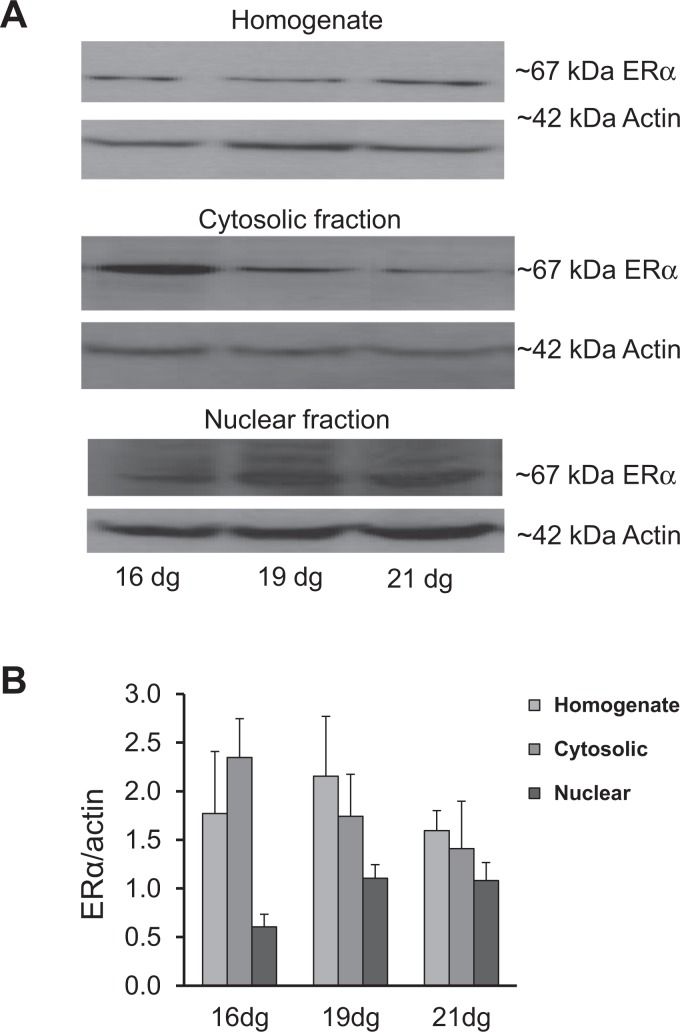
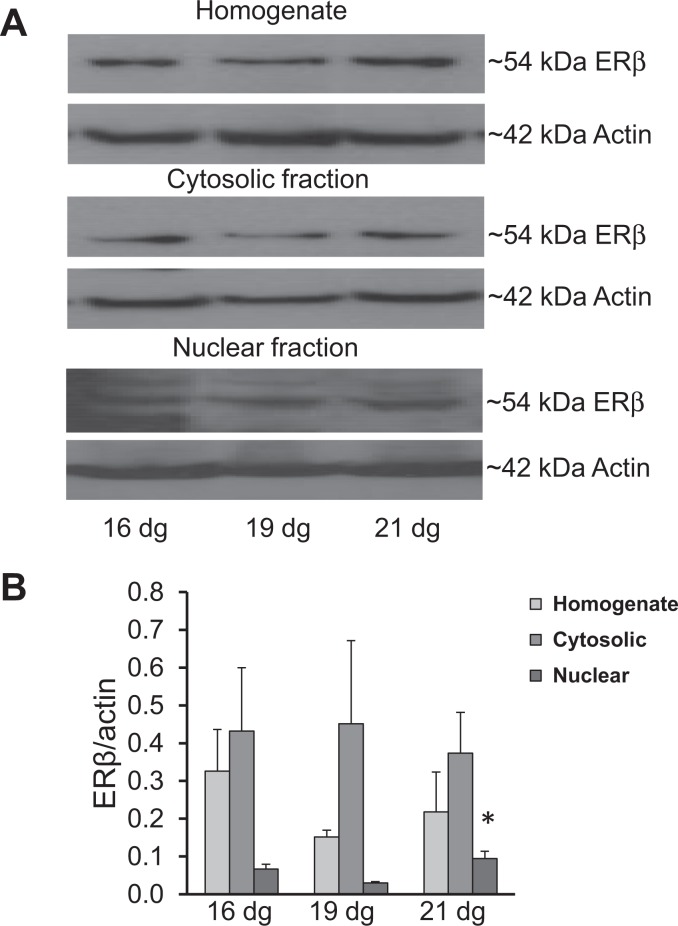
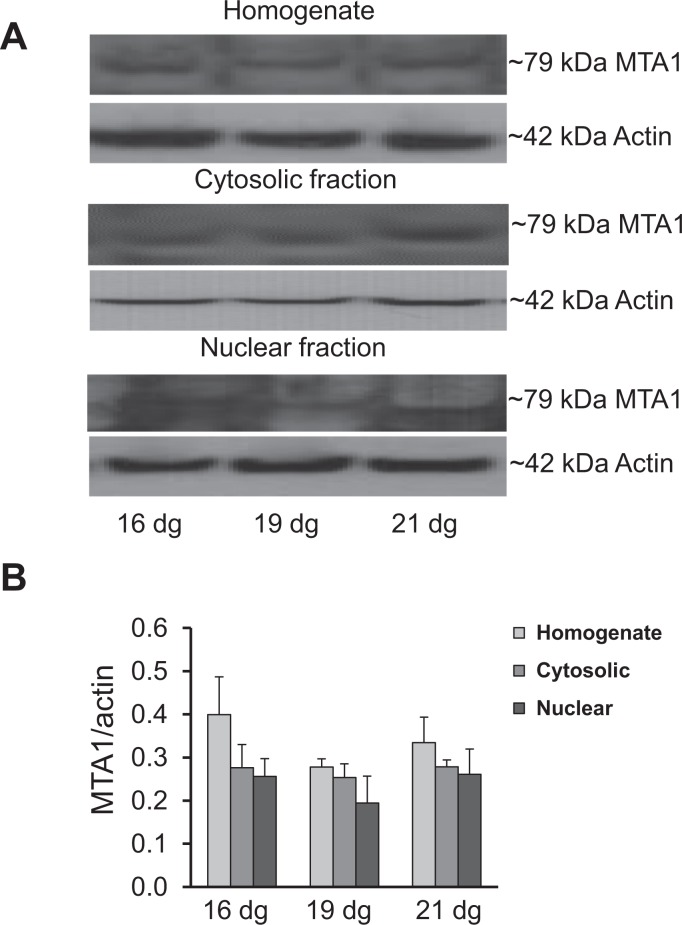
The protein expression of the ∼67 kDa ERα, ∼54 kDa ERβ, and ∼79 kDa MTA1 bands in total homogenate, nuclear fraction, and cytosolic fractions is shown in Figures 3 to 5. All proteins were expressed in all fractions from 16 to 21 dg (Figures 3A, 4A, and 5A). When normalized to actin, the expression of ERα protein did not differ among the groups (Figure 3B). The ERβ protein showed an increased expression (P < .05) in the nuclear fraction on 21 dg when compared to that on 19 dg (Figure 4B). No significant differences were detected among the groups in MTA1 expression in the homogenate, cytosolic, and nuclear fractions (Figure 5B).
Figure 3.
Protein expression of estrogen receptor α (ERα) in the homogenate, cytosolic, and nuclear fractions of placentas. A, Representative Western blots for ERα and β actin. B, No significant change was detected among different groups on different dg; however, there was a decreasing trend in the homogenate and cytosolic fractions and an increasing trend in the nuclear fractions at 21 dg. Samples were run in duplicates; data are mean ± standard error of the mean (n = 4/group).
Figure 4.
Protein expression of estrogen receptor β (ERβ) in the homogenate, cytosolic, and nuclear fractions of placentas. A, Representative Western blots for ERβ and β actin. B, No significant change was detected in expression of ERβ in the homogenate and cytosolic fractions on all dg; however, there was an increase in the expression in the nuclear fraction on 21 dg compared to that on 19 dg (*P < .05). Samples were run in duplicates; data are mean ± standard error of the mean (n = 4/group).
Figure 5.
Expression of metastasis-associated protein 1 (MTA1) in the homogenate, cytosolic, and nuclear fractions of placentas. A, Representative Western blots for MTA1 and β actin. B, No significant change was detected in the homogenate, cytosolic, and nuclear fractions among different groups on all dg. Samples were run in duplicates; data are mean ± standard error of the mean (n = 4/group).
Colocalization of ERα, ERβ, and MTA1 Proteins
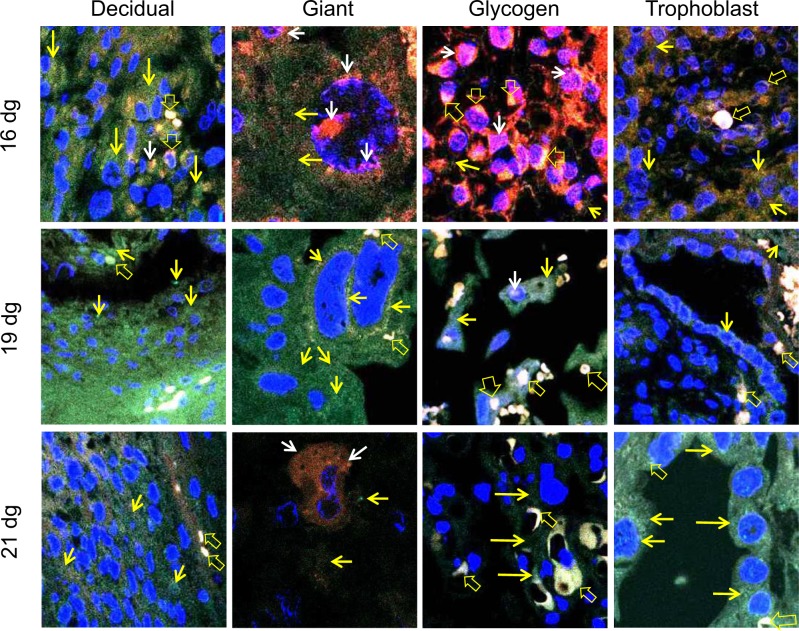
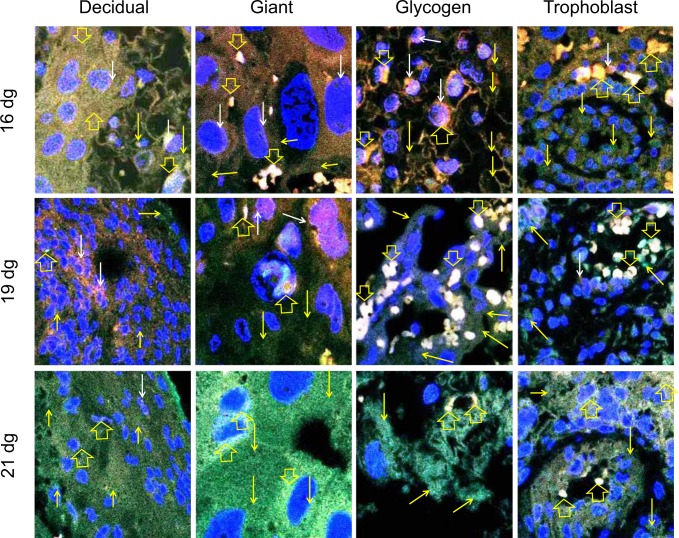
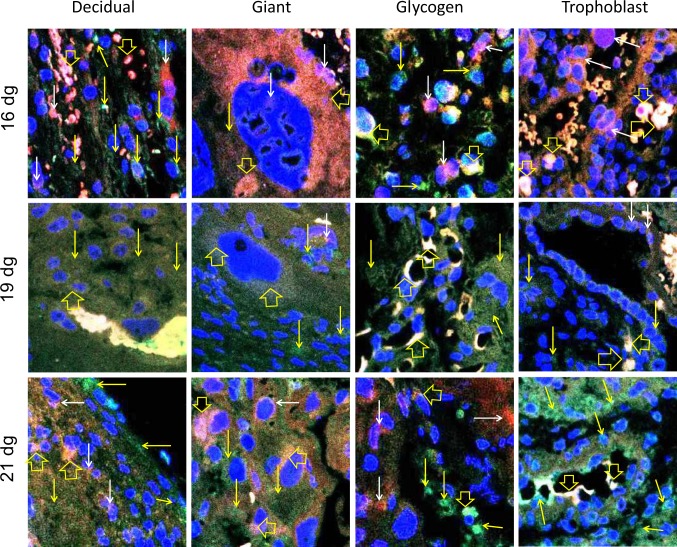
The different regions and cell types of a rat placenta are shown in Figure 6A. The negative control (placenta without any primary antibody) did not show any immunostaining (Figure 6B). The ERs are very well known to be expressed in placentas of all species; therefore, we did not use any other positive controls for the antibodies used in the study. The normal rat testis has been used as a positive control for MTA1 (Figure 6C). The ERα and ERβ proteins are colocalized in all placental cells on all gestation days (Figure 7). The colocalization is most prominent in glycogen cells and its intensity tends to reduce in decidual, giant, and trophoblast cells on 21 dg. Colocalization of ERα and MTA1 proteins was observed in the nucleus and cytoplasm of all placental cell types (Figure 8). The colocalization is strong mainly in glycogen and trophoblast cells and tends to reduce in intensity by 21 dg with predominance of MTA1 expression. At 21 dg, the staining of MTA1 was stronger than ERα when compared to the pattern seen on 16 and 19 dg. Both MTA1 and ERβ are colocalized in the nucleus and cytoplasm of all cells on all dg. The most prominent colocalization is seen in trophoblast cells (Figure 9).
Figure 6.
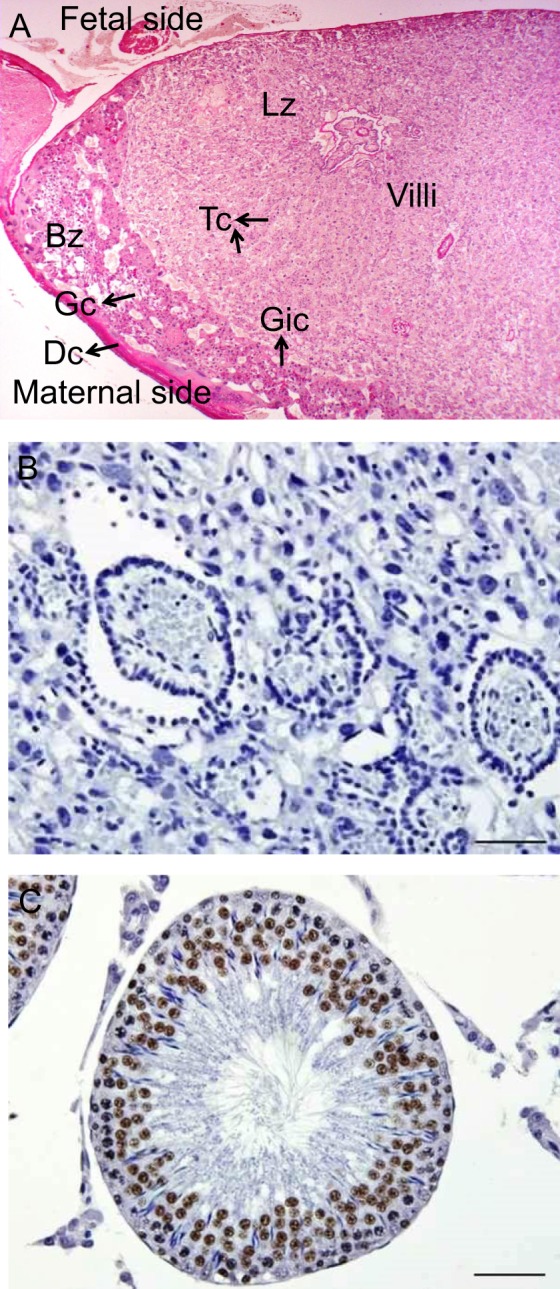
Structural organization of a rat placenta and negative and positive controls. A, A low-magnification photomicrograph of the placenta stained with Periodic acid-Schiff reaction showing basal (Bz) and labyrinth (Lz) zones. The location of decidual (Dc), glycogen (Gc), giant (Gic), and trophoblast (Tc) cells and villi are indicated, 40×. B, A negative control (without primary antibody) used simultaneously with confocal microscopy but stained for light microscopy showing no background labeling, 400×. C, Rat testis was used as a positive control for MTA1 showing labeled germ cells, 400×. Both negative and positive controls were counterstained with Mayer hematoxylin.
Figure 7.
Colocalization of estrogen receptor (ER) α (TRITC) and ERβ (FITC) in placental cells. Confocal images showing expression of the ERs in different cells of the placenta. The nuclei are labeled with 4′,6-diamidino-2-phenylindole (DAPI; blue). Expression of ERα (red staining indicated by white arrows) and ERβ (green staining indicated by yellow arrows) is shown. Yellow to white labeling observed is due to colocalization of the proteins (mixture of green and red to variable degrees due to merging of images) and is indicated by open yellow arrows. These pictures show that ERα and ERβ are coexpressed in the cytoplasm and nucleus of decidual, glycogen, giant, and trophoblast cells on 16 dg, 19 dg, and 21 dg. Original magnification, 400×. (The color version of this article is available at http://rs.sagepub.com.)
Figure 8.
Merged confocal images indicating colocalization of estrogen receptor (ER) α (TRITC) and metastasis-associated protein 1 (MTA1; FITC) in placental cells. The nuclei are labeled with 4′,6-diamidino-2-phenylindole (DAPI; blue). Expression of ERα (red staining indicated by white arrows) and MTA1 (green staining indicated by yellow arrows) is shown. Yellow to white labeling is due to colocalization of the proteins (mixture of green and red to variable degrees due to merging of images) and is indicated by open yellow arrows. These photomicrographs show that ERα and MTA1 are coexpressed in the cytoplasm and nucleus of decidual, glycogen, giant, and trophoblast cells on 16 dg, 19 dg, and 21 dg. Original magnification, 400×. (The color version of this article is available at http://rs.sagepub.com.)
Figure 9.
Merged confocal images indicating colocalization of estrogen receptor (ER) β (red, TRITC) and metastasis-associated protein 1 (MTA1; green, FITC) in placental cells. The nuclei are labeled with 4′,6-diamidino-2-phenylindole (DAPI; blue). Expression of ERβ (red staining indicated by white arrows) and MTA1 (green staining indicated by yellow arrows) is shown. Yellow to white labeling is due to colocalization of the proteins (mixture of green and red to variable degrees due to merging of images) and is indicated by open yellow arrows. These photomicrographs show that ERβ and MTA1 are coexpressed in the cytoplasm and nucleus of decidual, glycogen, giant, and trophoblast cells on 16 dg, 19 dg, and 21 dg. Original magnification, 400×. (The color version of this article is available at http://rs.sagepub.com.)
Discussion
Placental growth and development are of great significance for normal fetal growth and development. Indeed, abnormal placental growth is associated with adverse fetal development and poor pregnancy outcome. An increase in E2 levels seen in our study may be a contributing factor for placental growth restriction, which was detected from 19 dg onward. Despite the high E2 levels, placental efficiency20 was not affected, in fact it increased with progressing gestation allowing fetal growth.
Both ERα and ERβ are expressed in various tissues; however, the intensity of expression of ERα and ERβ varies during cellular proliferation and differentiation.21 The ERα is essential for development and proliferation of estrogen-sensitive tissues. The ERβ, on the other hand, is required for functional maturation and differentiation; nevertheless, it may also inhibit ERα-mediated proliferation of many cells.22–25 A decrease in expression of ERβ mRNA on 21 dg indicates that functional maturation and differentiation in the rat placentas were affected. It is known that giant and glycogen cells tend to degenerate and decrease in number toward the end of gestation.26 This phenomenon which we observed in our study could be the cause for a reduction in the level of ERβ mRNA on 21 dg as these cells highly expressed ERβ.
It is known that the ratio of nuclear to cytoplasmic ER expression depends on cell types and physiological conditions.21 Nuclear ERα protein expression was gradually upregulated in an inverse relation to its expression in the homogenate and cytosol. Although these changes were not significant, this finding indicates that the protein was translocated to nuclei of placental cells, suggesting a possibility of activation of the genomic pathways. It has been reported that the nuclear expression of ERα is characteristic of estrogen-sensitive cells, which might be stimulated by estrogens to proliferate and functionally differentiate.27 On the other hand, the significant increase in expression of ERβ protein in the nucleus on 21 dg may indicate an increased activity of ERβ and its involvement in cell differentiation, specifically toward the end of gestation.28,29
It has been reported that MTA1 is localized predominantly in the nucleus8,30 with possible cytoplasmic localization.30 In our study, we reported MTA1 protein localization in the nucleus and cytoplasm. The increase in MTA1 and MTA1s transcripts toward the end of gestation has also been reported in human placentas.12 Expression of MTA1 may contribute to placental growth via different mechanisms that may include the activation of β catenin and cyclin D1 through Wnt pathways.8 Moreover, MTA1 inhibits p53-induced apoptosis by deacetylation of p53, thus increasing the proliferation potential of cells.31 On the other hand, MTA1s, which is predominantly a cytoplasmic protein, binds with the AF2 domain of ERα, leading to its cytoplasmic sequestration, subsequent suppression of genomic functions, and augmentation of rapid cytoplasmic ER activities, such as mitogen-activated protein kinase activation. Therefore, an increased expression of both MTA1 and MTA1s seen in our study shifts the balance toward more cell proliferation, which correlates better with the growing placentas during pregnancy in rats.
By using confocal microscopy, we observed coexpression of ERα and ERβ in all placental cell types studied, supporting the fact that both ERs are needed for normal gestation.32 The expression of ERα and ERβ was seen in both nuclei and cytoplasm unlike that was observed in human placentas.23
Colocalization of MTA1 with the ERs was also seen in all placental cells at all gestation days indicating a close interaction between these proteins. Metastasis-associated protein 1 is an antiapoptotic protein that is involved in cell proliferation and migration.11 However, the protein also has a role to play in cell cycle arrest at G2-S phase transition in cells that have suffered DNA damage; this arrest gives enough time for the DNA damage repair machinery to repair DNA.33 In the present study, expression of MTA1 was observed in all placental cell types studied. Generally, on all days of gestation, the placental cells showed predominantly MTA1, when compared to ERs, indicating its role in cell survival. This difference may be the cause for the increase in the placental efficiency toward the end of pregnancy. Considering the repressive function of MTA1 on ERs,28 the high expression of MTA1 suggests a possibility that MTA1 suppresses estrogen-dependent signaling and reduces estrogen sensitivity in placental cells. Overexpression of MTA1 makes the cells insensitive to estrogens34; therefore, it may be that through this mechanism, the placental cells survive the detrimental effects of estrogens.
In conclusion, MTA1 is coexpressed with ERα and ERβ in the nuclei and cytoplasm of all placental cell types studied and its level increases at the end of pregnancy indicating a possible function in the development of rat placenta. High MTA1 mRNA expression, specifically toward the end of gestation, indicates that placental cells are less dependent on ERs and less sensitive to estrogens during that time, protecting the rat placentas from high estrogen levels at late gestation. High MTA1 levels toward the end of gestation also indicates a possible role for MTA1, unrelated to ERs, in regulating proliferation of placental cells.
Acknowledgments
The authors thank Dr. Sureikha Mohan, Ms. Lizamma Jacob, Ms. Susan Verghese, Ms. Jeena Prashanth, and Ms. Amina Abouzeid for their skillful technical assistance and the Animal Resources Center for maintaining the experimental animals.
Authors’ Note: This work was conducted at the Faculty of Medicine, Kuwait University, Kuwait.
Declaration of Conflicting Interests: The author(s) declared no potential conflicts of interest with respect to the research, authorship, and/or publication of this article.
Funding: The author(s) disclosed receipt of the following financial support for the research, authorship, and/or publication of this article: This work was supported by Kuwait University Research Grant #MY02/08, YM19/07, YM05/08 and General Facility Grant # GM01/01 and GM01/05.
References
- 1. Furukawa S, Hayashi S, Usuda K, Abe M, Hagio S, Ogawa I. Toxicological pathology in the rat placenta. J Toxicol Pathol. 2011;24 (2):95–111. [DOI] [PMC free article] [PubMed] [Google Scholar]
- 2. Fonseca BM, Correia-da-Silva G, Teixeira NA. The rat as an animal model for fetoplacental development: a reappraisal of the post-implantation period. Reprod Biol. 2012;12 (2):97–118. [DOI] [PubMed] [Google Scholar]
- 3. Bartholomeusz RK, Bruce NW, Lynch AM. Embryo survival, and fetal and placental growth following elevation of maternal estradiol blood concentrations in the rat. Biol Reprod. 1999;61 (1):46–50. [DOI] [PubMed] [Google Scholar]
- 4. Manavathi B, Kumar R. Steering estrogen signals from the plasma membrane to the nucleus: two sides of the coin. J Cell Physiol. 2006;207 (3):594–604. [DOI] [PubMed] [Google Scholar]
- 5. Al-Bader M. Estrogen receptors alpha and beta in rat placenta: detection by RT-PCR, real time PCR and Western blotting. Reprod Biol Endocrinol. 2006;4:13. [DOI] [PMC free article] [PubMed] [Google Scholar]
- 6. Gambino YP, Maymo JL, Perez Perez A, et al. Elsevier trophoblast research award lecture: molecular mechanisms underlying estrogen functions in trophoblastic cells--focus on leptin expression. Placenta. 2012;(33 suppl): S63–S70. [DOI] [PubMed] [Google Scholar]
- 7. Nilsson S, Gustafsson JA. Estrogen receptor action. Crit Rev Eukaryot Gene Expr. 2002;12 (4):237–257. [DOI] [PubMed] [Google Scholar]
- 8. Manavathi B, Kumar R. Metastasis tumor antigens, an emerging family of multifaceted master coregulators. J Biol Chem. 2007;282 (3):1529–1533. [DOI] [PubMed] [Google Scholar]
- 9. Kumar R, Wang RA, Bagheri-Yarmand R. Emerging roles of MTA family members in human cancers. Semin Oncol. 2003;30 (5 suppl 16):30–37. [DOI] [PubMed] [Google Scholar]
- 10. Li W, Bao W, Ma J, et al. Metastasis tumor antigen 1 is involved in the resistance to heat stress-induced testicular apoptosis. FEBS Lett. 2008;582 (6):869–873. [DOI] [PubMed] [Google Scholar]
- 11. Mao XY, Chen H, Wang H, et al. MTA1 expression correlates significantly with ER-alpha methylation in breast cancer. Tumour Biol. 2012;33 (5):1565–1572. [DOI] [PubMed] [Google Scholar]
- 12. Bruning A, Makovitzky J, Gingelmaier A, Friese K, Mylonas I. The metastasis-associated genes MTA1 and MTA3 are abundantly expressed in human placenta and chorionic carcinoma cells. Histochem Cell Biol. 2009;132 (1):33–38. [DOI] [PubMed] [Google Scholar]
- 13. Li DQ, Pakala SB, Nair SS, Eswaran J, Kumar R. Metastasis-associated protein 1/nucleosome remodeling and histone deacetylase complex in cancer. Cancer Res. 2012;72 (2):387–394. [DOI] [PMC free article] [PubMed] [Google Scholar]
- 14. Mishra SK, Yang Z, Mazumdar A, Talukder AH, Larose L, Kumar R. Metastatic tumor antigen 1 short form (MTA1 s) associates with casein kinase I-gamma2, an estrogen-responsive kinase. Oncogene. 2004;23 (25):4422–4429. [DOI] [PubMed] [Google Scholar]
- 15. Cheng G, Imamov O, Omoto Y, Warner M, Gustafsson JA. What is the value of measuring MTA-1 s in breast cancer? Mol Interv. 2002;2(6):360–362, 338. [DOI] [PubMed] [Google Scholar]
- 16. Al-Bader M, Al-Saji S, Ford CH, et al. Real-time PCR: detection of oestrogen receptor-alpha and -beta isoforms and variants in breast cancer. Anticancer Res. 2010;30 (10):4147–4156. [PubMed] [Google Scholar]
- 17. Young K, Huang C, Lin S, et al. Two-phased alteration and clinical relevance of MTA1 and MTA1 s gene expression: a quantitative PCR analysis in breast cancer patients. J Cancer Mol. 2006;(2):79–84. [Google Scholar]
- 18. Al-Bader MD, El-Abdallah AA, Redzic ZB. Ontogenic profile of estrogen receptor alpha and beta mRNA and protein expression in fetal rat brain. Neurosci Lett. 2008;440 (3):222–226. [DOI] [PubMed] [Google Scholar]
- 19. Livak KJ, Schmittgen TD. Analysis of relative gene expression data using real-time quantitative PCR and the 2(-Delta Delta C(T)) Method. Methods. 2001;25 (4):402–408. [DOI] [PubMed] [Google Scholar]
- 20. Wilson ME, Ford SP. Comparative aspects of placental efficiency. Reprod Suppl. 2001;58:223–232. [PubMed] [Google Scholar]
- 21. Bukovsky A, Caudle MR, Cekanova M, et al. Placental expression of estrogen receptor beta and its hormone binding variant--comparison with estrogen receptor alpha and a role for estrogen receptors in asymmetric division and differentiation of estrogen-dependent cells. Reprod Biol Endocrinol. 2003;1:36. [DOI] [PMC free article] [PubMed] [Google Scholar]
- 22. Forster C, Makela S, Warri A, et al. Involvement of estrogen receptor beta in terminal differentiation of mammary gland epithelium. Proc Natl Acad Sci U S A. 2002;99 (24):15578–15583. [DOI] [PMC free article] [PubMed] [Google Scholar]
- 23. Bukovsky A, Cekanova M, Caudle MR, et al. Expression and localization of estrogen receptor-alpha protein in normal and abnormal term placentae and stimulation of trophoblast differentiation by estradiol. Reprod Biol Endocrinol. 2003;1:13. [DOI] [PMC free article] [PubMed] [Google Scholar]
- 24. Hodges-Gallagher L, Valentine CD, El Bader S, et al. Estrogen receptor beta increases the efficacy of antiestrogens by effects on apoptosis and cell cycling in breast cancer cells. Breast Cancer Res Treat. 2008;109 (2):241–250. [DOI] [PubMed] [Google Scholar]
- 25. Treeck O, Lattrich C, Springwald A, Ortmann O. Estrogen receptor beta exerts growth-inhibitory effects on human mammary epithelial cells. Breast Cancer Res Treat. 2010;120 (3):557–565. [DOI] [PubMed] [Google Scholar]
- 26. Malassine A, Frendo JL, Evain-Brion D. A comparison of placental development and endocrine functions between the human and mouse model. Hum Reprod Update. 2003;9 (6):531–539. [DOI] [PubMed] [Google Scholar]
- 27. Marotti JD, Collins LC, Hu R, Tamimi RM. Estrogen receptor-beta expression in invasive breast cancer in relation to molecular phenotype: results from the Nurses’ Health Study. Mod Pathol. 2010;23 (2):197–204. [DOI] [PMC free article] [PubMed] [Google Scholar]
- 28. Matthews J, Gustafsson JA. Estrogen signaling: a subtle balance between ER alpha and ER beta. Mol Interv. 2003;3 (5):281–292. [DOI] [PubMed] [Google Scholar]
- 29. Hsiao WC, Cho WC, Lin PW, Lin SL, Lee WY, Young KC. Quantitative profile of estrogen receptor variants/isoforms in Taiwanese women with breast cancer. Eur J Surg Oncol. 2006;32 (5):492–497. [DOI] [PubMed] [Google Scholar]
- 30. Moon WS, Chang K, Tarnawski AS. Overexpression of metastatic tumor antigen 1 in hepatocellular carcinoma: Relationship to vascular invasion and estrogen receptor-alpha. Hum Pathol. 2004;35 (4):424–429. [DOI] [PubMed] [Google Scholar]
- 31. Moon HE, Cheon H, Lee MS. Metastasis-associated protein 1 inhibits p53-induced apoptosis. Oncol Rep. 2007;18 (5):1311–1314. [PubMed] [Google Scholar]
- 32. Couse JF, Korach KS. Contrasting phenotypes in reproductive tissues of female estrogen receptor null mice. Ann N Y Acad Sci. 2001;948:1–8. [DOI] [PubMed] [Google Scholar]
- 33. Li DQ, Ohshiro K, Khan MN, Kumar R. Requirement of MTA1 in ATR-mediated DNA damage checkpoint function. J Biol Chem. 2010;285 (25):19802–19812. [DOI] [PMC free article] [PubMed] [Google Scholar]
- 34. Cui Y, Niu A, Pestell R, et al. Metastasis-associated protein 2 is a repressor of estrogen receptor alpha whose overexpression leads to estrogen-independent growth of human breast cancer cells. Mol Endocrinol. 2006;20 (9):2020–2035. [DOI] [PMC free article] [PubMed] [Google Scholar]


