

Significance
Although T cells are the main players in autoimmune CNS inflammation, the role of B cells is being increasingly appreciated. We here investigated possible scenarios of how B cells could participate in the initiation of autoimmune CNS disease. We show that myelin-reactive autoantibodies accumulate in CNS-resident phagocytes, thereby concentrating myelin antigens in these cells and increasing the cells’ capacity to present the autoantigen to invading myelin-reactive T cells. Consequently, these T cells are stimulated and more easily reach the threshold for clinically relevant reactivation within the CNS tissue. This previously unidentified mechanism is of potential clinical relevance because it provides a scientific explanation for immune processes leading to disease initiation and induction of relapses in multiple sclerosis and other autoimmune CNS disorders.
Keywords: autoimmunity, EAE, autoantibodies, multiple sclerosis, B cells
Abstract
Multiple sclerosis (MS) is caused by T cells that are reactive for brain antigens. In experimental autoimmune encephalomyelitis, the animal model for MS, myelin-reactive T cells initiate the autoimmune process when entering the nervous tissue and become reactivated upon local encounter of their cognate CNS antigen. Thereby, the strength of the T-cellular reactivation process within the CNS tissue is crucial for the manifestation and the severity of the clinical disease. Recently, B cells were found to participate in the pathogenesis of CNS autoimmunity, with several diverse underlying mechanisms being under discussion. We here report that B cells play an important role in promoting the initiation process of CNS autoimmunity. Myelin-specific antibodies produced by autoreactive B cells after activation in the periphery diffused into the CNS together with the first invading pathogenic T cells. The antibodies accumulated in resident antigen-presenting phagocytes and significantly enhanced the activation of the incoming effector T cells. The ensuing strong blood–brain barrier disruption and immune cell recruitment resulted in rapid manifestation of clinical disease. Therefore, myelin oligodendrocyte glycoprotein (MOG)-specific autoantibodies can initiate disease bouts by cooperating with the autoreactive T cells in helping them to recognize their autoantigen and become efficiently reactivated within the immune-deprived nervous tissue.
T cell-driven autoimmune processes directed against CNS antigens underlie the pathogenesis of multiple sclerosis (MS) and its animal model experimental autoimmune encephalomyelitis (EAE) (1). Myelin-reactive T cells become activated and differentiate in the periphery and then enter the nervous tissue and are reactivated upon local encounter of their cognate CNS antigen (2, 3). This autoaggressive T-cell response eventually leads to the recruitment of other immune cells and tissue destruction. However, several findings also support the view that B cells contribute to the pathogenesis of this T cell-driven autoimmune process (4). This contribution is indicated by the presence of locally produced antibodies (oligoclonal bands) within the CNS tissues (5), by decorations of the nervous structures with antibodies and complement (6), by the presence of meningeal B-cell follicles in progressive MS (7, 8), and also by the therapeutic effects of plasmapheresis or anti-CD20 monoclonal antibody application: i.e., autoantibody- and B cell-directed therapies, respectively (9, 10). Disease-modifying effects of myelin-specific B cells were also found in EAE (11–13). Several potential mechanisms are currently under discussion to account for the disease-promoting effects of B cells. These mechanisms include their ability to present antigen to T cells (14, 15), to generate a general “bystander activation” via the production of proinflammatory cytokines, especially IL-6 (16) and/or GM-CSF (17), and to induce an antibody/complement-mediated attack of myelin that exacerbates structural damage in autoimmune CNS lesions (18, 19). Part of the puzzle is that B cells have also been observed to have a disease-dampening effect via their release of antiinflammatory cytokines, specifically IL-10 and/or IL-35 (20, 21).
Using an integrative approach of intravital imaging, genetics, and functional characterization, we here studied the interactions of T and B cells in the course of EAE. We found that the presence of autoantigen-specific B cells potently promotes the manifestation of the autoimmune disease. We show that these disease-inducing effects are mediated, not by B cells per se, but by their specific soluble products. Myelin-directed autoantibodies in the CNS tissue were found to trigger the disease-causing inflammatory process by concentrating myelin antigens in phagocytes, thus increasing their capacity to present the autoantigen. Consequently, the myelin-reactive T cells that scan the tissue for their cognate antigens are stimulated and more easily reach the threshold for clinically relevant reactivation within the CNS tissue.
Results
Myelin Oligodendrocyte Glycoprotein-Specific B Cells Positively Influence the Initiation and Manifestation of CNS Inflammation and Clinical Disease.
Myelin oligodendrocyte glycoprotein (MOG)-specific T cells (TMOG) (22) were transferred alone or together with MOG-specific B cells (BMOG) (13) into C57BL/6J mice. The animals were immunized 48 h later with MOG peptide or protein (amino acids 35–55 or amino acids 1–125, respectively). Independently of the antigenic stimulus, in the presence of BMOG cells, disease onset occurred earlier, and the incidence and severity of clinical deficits were increased (Table S1, Exps. 1 and 2). The disease-promoting effect of autoreactive B cells became even more evident when the animals were immunized under “suboptimal” activation conditions (Fig. 1A, and Table S1, Exp. 3). To exclude a potential contribution of endogenous MOG-reactive T or B cells in the WT mice, TMOG and BMOG cells were transferred into recipient mice with a restricted T-cell receptor (TCR) and B-cell receptor (BCR) repertoire unable to raise brain-specific immune responses: namely, OTII hosts harboring ovalbumin (OVA)-specific T cells or crossbreeds between OTII and B1.8 mice (23) additionally containing (4-hydroxy-3-nitrophenyl)acetyl (NP)-specific B cells (BNP). Both OTII and OTII/B1.8 mice developed a markedly accelerated and aggravated disease course after transfer of TMOG and BMOG cells (Fig. 1B, and Table S1, Exps. 4–6). Notably, nonspecific B-cell activation was not sufficient to promote clinical EAE: when OTII hosts that had received TMOG and BNP cells were immunized with MOG35–55 combined with NP-OVA or with a MOG-NP fusion peptide, a massive stimulation of the BNP cells was evoked, as indicated by a substantial rise in NP-reactive antibodies (Fig. S1A). However, despite this strong BNP-cell response, there was no significant influence on the clinical course of EAE (Table S1, Exps. 7 and 8).
Table S1.
BMOG cells trigger/aggravate clinical disease
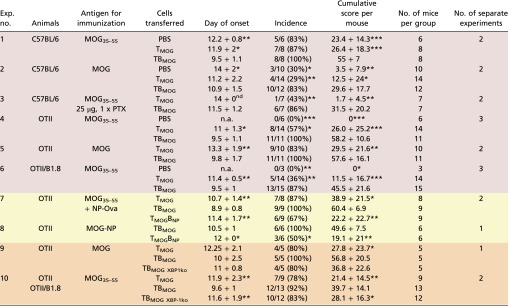 |
Data are presented as mean ± SD. For the day of onset and the cumulative score per mouse, the result of the statistical test (Mann–Whitney U test) is indicated against the group receiving B cells. Differences in the incidence are calculated using the χ2 test. *P < 0.05, **P < 0.01, ***P < 0.001. The cumulative score per mouse is calculated as the area between the clinical score curve and the x axis from every mouse in the group over the entire observation period, which was kept constant for all mice of all groups within the experiment. The color code is as follows: red, basic observation with transfer of TMOG and TBMOG cells into different hosts; yellow, experiments including B cells of different specificities (NP) to test the effects of unspecific activation; orange, experiments including BMOG cells deficient in XBP-1. MOG, rrMOG protein; MOG35–55, MOG peptide amino acids 35–55; n.a., not applicable; nd, not determined (a statistical evaluation could not be performed due to the fact that in one group only one mouse developed clinical disease).
Fig. 1.

MOG-specific B cells accelerate CNS inflammation and disease. (A) Accelerated manifestation of EAE in T-/B-MOG mice. Active EAE in T-/B-MOG (TBMOG) compared with T-MOG (TMOG) mice using a low pathogenic immunization protocol (Materials and Methods). Clinical score is shown. n = 7 from two independent experiments. (B) Acceleration of EAE in T-/B-MOG-OTII mice. Active EAE in OTII mice after transfer of TMOG ± BMOG cells. PBS injection was used as control. n = 6–14 from three independent experiments. (C) Accelerated T-cell CNS infiltrations in T-/B-MOG mice. 2-PM recordings of TMOG-GFP and BMOG-RFP cells in leptomeninges and the adjacent spinal cord parenchyma at the indicated time points p.i. The blood vessels were visualized by 2,000-kDa Texas Red dextran. (Scale bar: 50 µm.) Open arrow heads, intraluminal T cells; filled arrow heads, extravasated T cells; yellow circles, red phagocytes that ingested dextran leaking through the BBB. BMOG-RFP cells were not detectable in the CNS tissues.
Fig. S1.

BMOG cells accelerate TMOG cell infiltration into the nervous tissue but do not infiltrate the CNS compartment. (A) BNP cells secrete high amounts of antibodies. NP-specific IgG titers 9 d after coimmunization of OTII mice with NP-Ova and MOG. The mice had received TMOG and BNP cells 2 d before immunization (Materials and Methods). IgG antibodies against Ova (left bars), MOG (middle bars), or NP-Ova (right bars) were quantified by ELISA in the two indicated dilutions. Optical density values (OD 450 nm) are presented as mean ± SEM, n = 8. (B) Increased recruitment of T cells in the CNS of T-/B-MOG mice. TMOG cell numbers in spinal cords and brains of T-/B-MOG and T-MOG mice were quantified at day 9 p.i. by flow cytometry. Absolute numbers per gram of tissue are shown as mean ± SEM. n = 3–5. Note that, at the time of analysis, the mice did not yet show any clinical symptoms. (C) Confocal laser scanning microscopy analyses of spinal cord and inguinal LN tissues of T-/B-MOG mice at the peak of EAE (day 11 p.i., score 7). Arrows indicate RFP+ BMOG cells in the inguinal LN. [Scale bars: overview pictures (Left), 200 µm; higher magnification (Right), 50 µm.] (D) FACS analysis of the inguinal LN (Left) and spinal cord (Right) at the peak of EAE (score 7). Gates are set for GFP+ TMOG cells and RFP+ BMOG cells. Numbers indicate the percentage of positive cells. There were no RFP+ BMOG cells detectable in the spinal cord of T-/B-MOG mice by intravital 2-PM (Fig. 1C), histology (C), and FACS analysis (D) of the whole spinal cord. (E) BMOG cells present MOG to TMOG cells in vitro. In vitro proliferation of TMOG cells in the presence of BMOG cells. TMOG cells were cultured together with BMOG cells, BNP cells, or BMOG cells deficient in MHC II expression (BMOG MHC-II ko) in the presence of the indicated amounts of (Left) MOG peptide or (Right) protein. T-cell proliferation was assessed after 72 h by FACS analysis of CFSE dilution. One representative experiment of at least two is shown.
To find out more about the nature of the disease-promoting properties of BMOG cells, we used intravital two-photon laser scanning microscopy (2-PM) of the lower thoracic/lumbar spinal cord tissue: i.e., a preferentially affected CNS tissue during MOG-induced EAE in C57BL/6J mice (24). TMOG and BMOG cells expressing green or red fluorescent protein (GFP or RFP), respectively, were recorded from days 8–11 after immunization (p.i.): i.e., shortly before disease onset and during the development of the acute phase of EAE. The TMOG-GFP cells were clearly visible in the blood stream at days 8–9 p.i. in both groups: i.e., animals that had received TMOG-GFP cells alone (T-MOG mice) or TMOG-GFP cells together with BMOG-RFP cells (T-/B-MOG mice) (Movies S1 and S2). In T-/B-MOG mice, TMOG-GFP cells rapidly accumulated within the leptomeningeal milieu already at day 9, accompanied by a clear disruption of the blood–brain barrier (BBB) even before the animals showed any clinical symptoms (Fig. 1C, and Movie S2). In contrast, in T-MOG mice, only a few extravasated TMOG-GFP cells were detectable, and massive infiltration of TMOG-GFP cells and BBB leakage occurred significantly later, starting at day 11 p.i. (Fig. 1C and Movie S3). This BMOG cell-mediated acceleration in T-cell infiltration into the leptomeninges and the CNS parenchyma was confirmed and quantified by flow cytometry (Fig. S1B). Notably, BMOG cells were not found within the inflammatory CNS lesions (Fig. 1C and Fig. S1 C and D).
BMOG Cells Do Not Influence the Priming and Differentiation of TMOG Cells in Secondary Lymphoid Organs.
BMOG cells were able to present MOG antigen to TMOG cells in vitro (Fig. S1E), suggesting that the acceleration of TMOG cell entry into the CNS could be due to enhanced T-cell activation in the periphery. We therefore next recorded the activation of TMOG-GFP cells in the draining lymph nodes (LNs), 10–50 h after immunization. Our 2-PM studies revealed a significant reduction in the velocity of TMOG-GFP cells, with a minimum velocity being reached 30–40 h p.i (Fig. S2A, Left). This reduction in velocity was accompanied by a strong enlargement of T-cell size (Fig. S2 B and C). At 30 h p.i., TMOG-cell divisions became detectable (Fig. S2D and Movie S4). Stable contacts of TMOG-GFP cells with B cells were observed in the presence of BMOG but not BNP cells (Fig. S2E). These T-BMOG pairs were in constant motion, the BMOG cells seemingly dragging their T-cell partners behind them (Fig. S2E and Movie S5) (25). Activation of BMOG cells was indicated by an up-regulation of MHC II and CD86 (Fig. S2F). Surprisingly, despite these intense T-cell/B-cell interactions, we did not observe any significant differences in TMOG-cell deceleration and enlargement in T-/B-MOG vs. T-MOG or T-MOG/B-NP animals (Fig. S2 A, Right and B and C). Moreover, there was no significant change in their proliferation (Fig. 2A, Fig. S2D, and Fig. S3 A and B) or in the expression levels of activation markers (CD44, CD69, and CD62L) or proinflammatory cytokines (IFNγ, IL-17, and GM-CSF) tested at the peak of activation and immediately before the onset of CNS invasion: i.e., days 4 and 9 p.i., respectively (Fig. 2B and Fig. S3 C–E). There was also no difference in the expression levels of Bcl-6, CXCR5, ICOS, Il-21, and PD-1, indicating that the TFH differentiation of TMOG cells was not changed in the presence of BMOG cells (Fig. S3F). A quantitative deep sequencing analysis was performed on the transcriptomes of TMOG cells from T-MOG and T-/B-MOG mice in comparison with naive TMOG cells. TMOG cells from T-MOG and T-/B-MOG mice had virtually identical differentiation programs, chemokine and cytokine profiles, cell locomotion genes, and activation levels. As expected, the profiles of the activated effector TMOG cells were completely distinct from naive TMOG cells before transfer (Fig. 2C and Fig. S4). The data up to this point indicated that BMOG cells did not enter the CNS lesions nor did they change the initial TMOG-cell activation and differentiation.
Fig. S2.

Locomotion properties of TMOG cells in the presence of BMOG cells in draining LNs. (A) Intravital 2-PM recording of the mean 3D velocity of TMOG-GFP cells in the draining LN. (Left) Kinetics of the mean 3D velocity of TMOG-GFP cells at the indicated time points p.i. with MOG. naïve, before immunization. Individual data points representing trajectories from single cells were grouped in 10-h intervals and are presented as mean ± SEM. (Right) T-cell velocity during the priming phase in the presence/absence of BMOG cells. 2-PM recordings of the TMOG-GFP cells in draining LNs of T-/B-MOG mice before (naive) and 30–40 h p.i. with OVA or MOG and in T-MOG/B-NP mice immunized with MOG. Statistical analyses: one-way ANOVA nonparametric Kruskal–Wallis test, followed by Dunn’s multiple comparison test. ***P < 0.001. All data are presented as mean ± SEM. (B) T-cell enlargement during priming is independent of BMOG cells. Cell size of TMOG-GFP cells in the draining LNs of T-/B-MOG compared with T-MOG mice at the indicated time points p.i was analyzed by cytofluorometry. naive, no immunization. (C) Size increase of TMOG-GFP cells was analyzed in the draining popliteal LN 30 h p.i. in T-/B-MOG (Middle) and T-MOG/B-NP mice (Right) in comparison with naive mice (Left). Arrows heads point to TMOG-GFP cells. Arrows indicate BMOG-RFP or BNP-RFP cells. (Scale bar: 10 µm.) Red, BMOG or BNP cells; green, TMOG cells. (D) Proliferation of TMOG-GFP cells. Kinetic of representative TMOG-GFP cell mitosis at 30 h p.i. (arrow) in T-/B-MOG mice (Upper) and T-MOG/B-NP mice (Lower). (E) TMOG cells form motile conjugates with BMOG but not with BNP cells. A representative TMOG-BMOG-pair (Upper) is outlined at a time point 20–30 h p.i. The dashed line indicates the migration path, and the arrow the direction of the motile T-B conjugate. Interactions were not detected between TMOG and BNP cells (Lower). (Scale bar: 15 µm.) Green, TMOG cells; red, BMOG or BNP cells. (F) BMOG cell activation in the draining LN indicated by CD86 and MHC class II up-regulation. BMOG cells were compared with BNP cells at day 3d p.i. with MOG. Data are presented as mean ± SEM, n = 3.
Fig. 2.

TMOG cell priming is not changed in the presence of BMOG cells. TMOG cells in the draining LNs were analyzed (A and B) in the priming phase (day 2–4 p.i.) or (C) from the spleen briefly before disease onset at day 9 p.i. (A) TMOG cell proliferation in draining LNs of T-/B-MOG (TBMOG) and T-MOG (TMOG) mice. (Left) Percentage of dividing cells analyzed by flow cytometry of TMOG-RFP cells labeled by carboxyfluoresein succinimidyl ester (CFSE) as mean ± SEM. n = 6–10. (Right) Absolute numbers of TMOG-RFP cells at day 4 p.i. Mean ± SEM. n = 5–10. (B) Analysis of activation markers. TMOG-RFP cells analyzed at day 4 p.i. for the indicated membrane proteins by flow cytometry (% of positive TMOG-RFP cells). n = 4. (C) RNAseq transcriptome analyses. Transcriptomes of effector TMOG cells sorted from spleens of T-MOG and T-/B-MOG mice 9 d p.i. were compared with each other and also with nonprimed TMOG cells (n = 3). Gene expression levels of effector T cells from T-MOG mice plotted against those of T-/B-MOG mice (Right) or naive TMOG cells (Left) or T-/B-MOG mice-derived effector TMOG cells vs. naive TMOG cells (Center). Differentially expressed genes (red).
Fig. S3.

TMOG cell priming in the secondary lymphoid organs is not changed in the presence of BMOG cells. TMOG cell activation was analyzed during the priming phase (days 2–4 p.i.) or briefly before disease onset at day 9 p.i. (A and B) TMOG cell proliferation. (A) Proliferation of TMOG cells in the spleen of T-/B-MOG and T-MOG mice at the indicated time points. Data are presented as the percentage of dividing TMOG cells (CSFE dilution). Mean ± SEM, n = 6–10. (B) Numbers of TMOG-RFP cells at day 9 p.i. in the indicated organ per gram of tissue or per milliliter of blood. Data are presented as mean ± SEM. n = 4–5. (C and D) Expression of membrane activation markers in TMOG cells at days (C) 4 or (D) 9 p.i. analyzed by flow cytometry. The percentage of positive TMOG cells is depicted as mean ± SEM, n = 4. (E) Cytokine production evaluated by quantitative PCR in ex vivo-sorted TMOG-RFP cells (Left) or by ELISA stimulated in vitro with the indicated amounts of MOG35–55 (Right). Cytokine production was assessed at the indicated days p.i. from the draining lymph node (first and third rows) or the spleen (second and fourth rows). Data are presented as mean ± SEM and represent four to six animals per group. (F) Expression of genes of the TFH program. Expression levels of the genes coding for Bcl-6, PD-1, ICOS, CXCR5, and IL-21 were analyzed at day 4 p.i. Data for the spleen or draining lymph nodes are presented as mean ± SEM. n = 4.
Fig. S4.

RNAseq transcriptome analyses of TMOG cells from T-MOG and T-/B-MOG mice and of naive TMOG cells. Transcriptomes of effector TMOG cells sorted from spleens of T-MOG and T-/B-MOG mice 9 d p.i. were compared and set in comparison with nonprimed TMOG cells (n = 3). (A) Heat-map of the top 50 most differentially expressed genes between naive TMOG cells and effector TMOG cells from T-MOG and T-/B-MOG mice. Individual values of three different biological replicates from naive TMOG cells and those from T-MOG and T-/B-MOG mice are shown. (B) Heat-map of 50 exemplary genes associated with relevant T-cell functions: i.e., activation and differentiation, cytokines and cytokine receptors, chemokine receptors, and cell locomotion genes. TMOG cells from nonimmunized animals and those from T-MOG mice and T-/B-MOG mice were compared. (C) Gene expression levels of individual genes were normalized and are depicted as mean ± SEM. Genes are grouped according to function comprising genes involved in T-cell activation, cytokines, cytokine receptors, chemokine receptors, and adhesion molecules. The last group lists the four genes (out of more than 38,000 genes) that showed significantly differential expression in TMOG cells from T-MOG mice and T-/B-MOG mice. Note that the differentially expressed Il-21 gene is grouped among the cytokine genes.
MOG-Specific Antibodies Trigger the Initiation of Clinical EAE.
We next addressed the possibility that BMOG cells initiate and aggravate EAE by their ability to produce MOG-specific autoantibodies (MOG AAbs) that are indeed detectable by days 4–5 p.i. in T-/B-MOG mice (Fig. S5A). Interestingly, BMOG cells deficient for the transcription factor X-box binding protein 1 (XBP-1), which is required for the differentiation of B cells into antibody-producing plasma cells (26), lost the capacity to accelerate EAE (Table S1, Exps. 9 and 10). XBP-1–deficient BMOG cells retained their antigen presentation capacity (Fig. S5B) but failed to produce significant amounts of MOG AAbs (Fig. S5C) (26).
Fig. S5.

MOG-specific AAbs appear in vivo at day 4–5 p.i. but do not cause severe demyelination in preclinical CNS lesions independently of inflammation. (A) Antibody production capacity of BMOG cells in vivo. MOG AAb production (IgG) was tested at the indicated time points p.i. with MOG by ELISA. Sera were considered positive with an OD of >0.45 (mean ± 3 SD from control sera). Data are presented as positivity of different mice per day, with two to five mice analyzed per time point. Note that, to exclude production of MOG AAb by endogenous B cells, the BMOG cells were transferred in B-NP mice. (B) BMOG cells deficient in XBP-1 present antigen to TMOG cells but are incapable of producing MOG AAb. Proliferation of TMOG cells cocultured in vitro together with BMOG cells, BNP cells, or XBP-1–deficient BMOG cells (BMOG XBP-1 ko) in the presence of MOG35–55 (Left) or rrMOG (Right) assessed by CFSE dilution. One representative experiment of at least two is shown. (C) MOG AAb IgG titers in T-/B-MOG, T-/B-MOGXBP-1ko, or T-MOG mice at 2.5 wk p.i. in the indicated dilutions. Data are presented as optical density (mean ± SEM), n = 12. (D–F) MOG AAb in preclinical CNS lesions do not cause severe demyelination, and lesions are characterized by inflammation rather than demyelination. (D) Demyelination was quantified in the indicated spinal cord regions from mice that had received i.t. MOG AAb or NP Ab sera at day 8 p.i. Data are presented as demyelinated area as percentage of white matter (mean ± SEM) with mice grouped according to the clinical scores in the time frame of 24–48 h after antibody injection. n = 3–6. n.d., not detectable. Note that, 12 h p.i., no clinical signs and no demyelination could be detected. (E) MOG AAb-induced demyelinating lesions are characterized by inflammatory infiltrates. Histological analysis of a demyelinated lesion of the thoracic spinal cord from a MOG AAb-treated mouse (preclinical phase). The sections are stained with luxol fast blue (LFB), anti-macrophages (MAC3), and anti–T-cell (CD3) antibodies. (Magnification: Overview (Top), 4x; Bottom Insets, 20×.) Note that demyelinated regions are circumscribed and characterized by dense T-cell and macrophage infiltrates. (F) MOG mAAb treatment does not cause demyelination in rat EAE. The i.t treatment with MOG mAAb or isotype control Ab was performed in Lewis rats 3.5 d after TMOG cell transfer. Histological analysis of spinal cord (SC) at the indicated levels from a control or a MOG mAAb-treated animal 5 d p.t. The sections were stained with luxol fast blue. (Magnification: Overview (Top), 4×; Bottom Insets, 10×.) Note that no signs of demyelination were observed. (G and H) Occurrence of MOG AAbs in the CSF and binding of MOG mAAb to CNS macrophages/microglia. (G) MOG AAbs are present in the CSF during the preclinical phase. CSF was collected at day 9 p.i. from T-MOG mice, T-/B-MOG mice, and B-MOG mice. The presence of MOG AAb (IgG) was tested by ELISA (dilution 1:100). Data are presented as OD450 ± SEM, n = 2–4. (H) MOG AAb is localized in meningeal CD11bhighCD45high cells. SeTau-647–labeled MOG mAAb was injected i.v. into naive or MOG-immunized mice on day 7 p.i. Cells were isolated at day 8 p.i. from the meninges and analyzed by flow cytometry, gated successively for lymphocytes and CD11bhighCD45high cells. Histograms for SeTau-647 are shown; numbers indicate mean fluorescence intensity (MFI). Representative data of two independent experiments with n = 2 per experiment and per group.
To directly test the disease-promoting potential of MOG AAbs, we i.v. injected sera from preimmunized MOG-BCR or NP-BCR knock-in mice into immunized recipient animals. In fact, the serum containing MOG-antibody but not NP-antibody or serum obtained from T-/B-MOG-XBP-1deficient mice significantly accelerated disease onset (Table S2, Exps. 1–3). Very similar findings were obtained when a purified monoclonal anti-MOG antibody (MOG mAAb; 8.18-C5) (27) was transferred instead of the serum (Fig. 3A and Table S2, Exp. 4). Interestingly, a late infusion of the serum containing MOG AAb [i.e., after peripheral TMOG cell priming (day 8 p.i.)] exerted disease-triggering effects identical to those of early infusion (day 5 p.i.), suggesting that the AAbs acted in the CNS rather than in the periphery. Leading from these results, we injected serum or the purified MOG mAAb intrathecally (i.t.) 8 d p.i.: the AAb application fully reproduced the clinical findings (Table S2, Exps. 5 and 6). Similar disease-accelerating effects were seen when the MOG mAAb was transferred i.v. or i.t. during transfer EAE: i.e., in animals that had received fully primed and differentiated pathogenic TMOG effector cells for disease induction (Table S2, Exps. 7 and 8). Not surprisingly, transfer of effector T cells into MOG-BCR knock-in mice that constitutively display high MOG AAb titers also resulted in an earlier and aggravated disease course (Table S2, Exp. 9). Importantly, human anti-MOG AAb-containing immunoglobulins retrieved from a patient suffering from an acute autoimmune CNS attack fully reproduced the disease-accelerating effects whereas irrelevant human immunoglobulins did not show any influence on the disease course or severity (Fig. 3B and Table S2, Exp. 10).
Table S2.
MOG-specific AAbs trigger/aggravate clinical disease
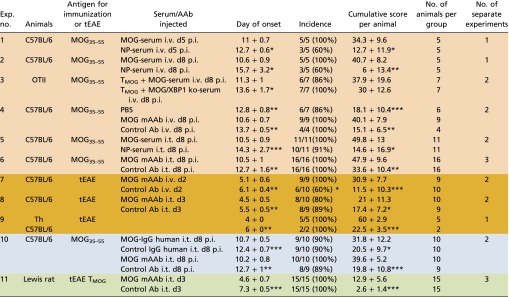 |
Data are presented as mean ± SD. For the day of onset and the cumulative score per animal, the result of the statistical test (Mann–Whitney U test) is indicated against the group receiving MOG AAbs. Differences in the incidence are calculated using the χ2 test. *P < 0.05, **P < 0.01, ***P < 0.001. The cumulative score per animal is calculated as the area between the clinical score curve and the x axis from every animal in the group over the entire observation period, which was kept constant for all animals of all groups within the experiment. The color code is as follows: orange, experiments including injection of serum or MOG mAAb; brown, transfer-EAE in mouse; blue, experiments including human IgG; green, transfer-EAE in Lewis rat. MOG35–55, MOG peptide amino acids 35–55; MOG mAAb, monoclonal MOG-specific antibody; tEAE, transfer EAE.
Fig. 3.

MOG AAbs mediate the disease-promoting effects of B cells. (A) Active EAE in C57BL/6J mice after i.v. injection of MOG mAAb or of an isotype control antibody (control Ab). (B) Active EAE in C57BL/6J mice after i.t. injection of human IgG containing MOG AAb or control human IgG. (C) Effects of i.t.-applied MOG mAAb in TMOG-GFP cell-induced transfer EAE of Lewis rats. Clinical scores are shown. Arrows, time of antibody injection. Data are presented as mean ± SEM. n = 4–16 pooled from two or three independent experiments.
The disease-promoting effects of MOG AAbs were not species-restricted. In Lewis rat transfer EAE induced by MOG-reactive T cells (TMOG cells) that are known to have a low pathogenic potential (28, 29), the i.t. infusion of MOG mAAbs resulted in a strong acceleration and aggravation of clinical EAE (Fig. 3C and Table S2, Exp. 11).
Enhancement of Antigen Presentation of CNS-Derived APC by MOG AAbs and Subsequent Activation of TMOG Cells.
What are the mechanisms by which the MOG AAbs trigger these clinical effects? In the acute phase of EAE, MOG AAbs were reported to mediate myelin destruction (18, 19). However, in our mouse or rat models, we did not find any indication of disease-relevant MOG-AAb–induced demyelination (Fig. S5 D–F). Our findings in EAE induced by transfer of T cells reacting against the astrocytic antigen S100β were in line with these observations. TS100β cells, similarly to TMOG cells, have a low pathogenicity in Lewis rats due to suboptimal reactivation within the CNS (28). The i.t. infusion of MOG mAAb did not influence the clinical course or severity of S100β-EAE whereas a boosting of local TS100β-cell reactivation by i.t. injection of S100β antigen clearly aggravated the disease (Table S3, Exp. 1). These data indicate that the disease-enhancing effect of the MOG mAAb depended on the matching of the CNS antigen between the respective antibody and disease-inducing effector T-cell specificity. Accordingly, Abs directed against a neuronal antigen (i.e., beta amyloid) did not impact on the clinic of MOG-EAE or S100β-EAE in mice or rats (Table S3, Exps. 1, 2, and 4).
Table S3.
Neither beta amyloid Abs and irrelevant immune complexes nor MOG AAbs in the context of S100β-specific T cells aggravate clinical disease
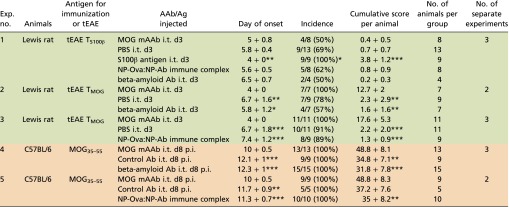 |
Data are presented as mean ± SD. For the day of onset and the cumulative score per animal, the result of the statistical test (Mann–Whitney U test) is indicated against the group receiving MOG AAbs. Differences in the incidence are calculated using the χ2 test. *P < 0.05, **P < 0.01, ***P < 0.001. The cumulative score per animal is calculated as the area between the clinical score curve and the x axis from every animal in the group over the entire observation period, which was kept constant for all animals of all groups within the experiment. The color code is as follows: green, transfer-EAE in Lewis rats including injection of immune complexes, mAAb, or Ag; orange, mouse experiments including injection of immune complexes or mAAb. MOG mAAb, monoclonal MOG-specific antibody; MOG35–55, MOG peptide amino acids 35–55; NP-Ova:NP-Ab immune complex, immune complex consisting of NP-ovalbumin complexed to NP-specific monoclonal antibodies; tEAE, transfer EAE.
MOG AAbs became detectable in the cerebrospinal fluid (CSF) with the first occurrence of T cells in the leptomeningeal milieu (Fig. S5G). When analyzing the distribution of a fluorescently labeled MOG-AAb, we found that, during this initial phase of CNS inflammation, the antibody did not bind at myelin structures but accumulated in leptomeningeal macrophages and adjacent parenchymal microglia (Fig. 4, Fig. S5H, and Movie S6). These cells were recently shown to be the first antigen-presenting cells (APCs) for myelin-reactive T cells during EAE (30–33). Therefore, we hypothesized that MOG-AAbs enhance TMOG-cell activation by virtue of their high affinity binding to cognate antigens, that concentrates even minute amounts of MOG to CNS APCs and thus facilitates MOG antigen presentation in the nervous tissues. We indeed found that in vitro cultured microglia presented myelin antigen to TMOG cells significantly more efficiently in the presence of MOG mAAb (Fig. 5A) and that ex vivo-isolated CNS-resident phagocytes from immunized MOG mAAb-treated mice stimulated effector TMOG cells more efficiently than their counterparts from control Ab-treated mice (Fig. 5B). Furthermore, effector T cells in early EAE CNS lesions of animals treated with MOG mAAbs produced higher levels of proinflammatory cytokines than in controls (Fig. 5C), which became particularly clear in TMOG-GFP cell-induced EAE of Lewis rats. The i.t. infusion of MOG mAAb induced a strong increase of the proinflammatory cytokine levels of the TMOG-GFP cells within the CNS (Fig. 5D and Fig. S6 A and B). Consecutively, the numbers of TMOG-GFP cells recruited into the CNS were massively increased (Fig. 5E and Fig. S6C), and the clinical disease was accelerated and aggravated (Fig. 3C and Table S2, Exp. 11). These clinical effects were accompanied by a strongly boosted inflammatory milieu in the nervous tissues, with a significant recruitment of immune cells, which resembled what was observed after EAE induction with highly pathogenic AAb-independent effector T cells (Fig. S6 D–F) (28). There is the possibility that immune complexes could unspecifically stimulate CNS-resident APCs to increase their antigen presentation capacity or enhance their release of proinflammatory factors, such as chemokines. However, i.t. application of a CNS-irrelevant immune complex consisting of NP-OVA complexed with anti-NP Abs could not reproduce the disease-enhancing effects of MOG AAb in mouse or rat EAE (Table S3, Exps. 1, 3, and 5). Furthermore, the antigen presentation capacity of microglial cells did not change in the presence or absence of NP-OVA–anti-NP Ab complexes (Fig. 5A).
Fig. 4.

Binding of MOG mAAb to CNS macrophages/microglia. (A) Confocal analysis of a spinal cord section of MOG-immunized CX3CR1-EGFP mice at day 8 p.i. SeTau-647–labeled MOG mAAb had been injected i.v. on day 7. Arrows indicate colocalization of CX3CR1-EGFP+ cells with MOG mAAb (colocalization appears in white). Note that the colocalization signal is more pronounced with meningeal macrophages than with microglia. Green, CX3CR1+ cells; red, TMOG cells; magenta, SeTau-647–labeled MOG antibody. [Scale bars: overview picture (Top), 200 µm; higher magnification (1), 50 µm; and Insets A and B, 20 µm. (B) Intravital 2-PM imaging of naive CX3CR1-EGFP mice 24 h after i.v. injection of MOG mAAb. (Scale bars: overview, 70 µm; scale bar zoom-ins, 15 µm.) Shown is 70-kDa Texas Red dextran (red) for visualization of blood vessels. Green, CX3CR1+ macrophages and microglia; magenta, SeTau-647–labeled MOG mAAb. Arrows indicate colocalization of the MOG mAAb with macrophages or microglia (white). (Bottom Right) A 3D reconstruction of the cell in region 2 using Imaris software.
Fig. 5.

Enhanced antigen presentation of CNS-derived APCs in the presence of MOG AAb. (A) MOG mAAbs enhance antigen presentation capacity of microglia. IL-17A release of effector TMOG cells cocultured with microglia in the absence or presence of MOG mAAb, isotype control antibody, or irrelevant NP-Ova:NP-Ab immune complex (IC) without exogenous antigen or with addition of myelin particles. Mean ± SEM of ELISA data. n = 4–6. (B) MOG mAAbs enhance antigen presentation of CNS APCs. IL-17A release of TH17 effector TMOG cells cocultured with leptomeningeal APCs isolated from immunized C57BL/6J mice treated i.t. with MOG mAAb or isotype control antibody (control Ab). Mean ± SEM of ELISA data. n = 12. No exogenous antigen was added to the tissue culture. (C) MOG mAAbs enhance T-cell activation in the CNS in mouse EAE. Cytokine production of TMOG cells after i.v. injection of MOG mAAb or control Ab during mouse transfer EAE. TMOG cells were sorted from the indicated compartments shortly before disease onset (weight loss or minimal score). Quantitative PCR data presented as mean ± SEM. House-keeping gene: HPRT. n = 5–13 from 4 different experiments. (D) MOG mAAbs enhance T-cell activation in the CNS in rat EAE. TMOG-GFP cells analyzed within EAE lesions after i.t. treatment (at day 3 p.t.) with MOG mAAb or isotype control Ab. Quantitative PCR data of TMOG-GFP cells sorted from the indicated compartments at day 4 p.t. Mean ± SEM of 3 animals per group from 2 independent experiments. House-keeping gene: β-actin. (E) TMOG-GFP cells invade the CNS of MOG mAAb treated animals more efficiently. Absolute numbers of TMOG-GFP cells at the indicated time points after transfer in blood and spinal cord parenchyma measured by flow cytometry. n = 4 per group from two independent experiments.
Fig. S6.

MOG mAAbs increase T-cell infiltration and CNS inflammation in Lewis rat EAE. (A and B) Proinflammatory cytokine production of Lewis rat. TMOG-GFP cells were analyzed within EAE lesions after i.t. treatment (at day 3 p.t.) with MOG mAAb or isotype control Ab. (A) Quantitative PCR data of TMOG-GFP cells sorted from blood, meninges (men), and spinal cord parenchyma (par) at the indicated time points p.t. Data are presented as mean ± SEM of three animals per group. Each sample was measured in duplicate. House-keeping gene: β-actin. Representative data of two independent experiments. (B) Protein production of IFNγ and IL-17A measured in T cells from blood and CNS 5 d p.t. Percentage of positive cells is indicated in the quadrants. i.c., isotype control. (C) TMOG-GFP cells invade the CNS of MOG mAAb-treated animals more efficiently. Lumbar spinal cord sections prepared at the indicated time points after transfer of TMOG-GFP cells. Fluorescence microscope data. Arrows point to representative TMOG-GFP cells. (Scale bars: overview pictures, 300 µm; Insets, 20 µm. (D) MOG mAAb treatment increases the inflammatory response in the CNS. mRNA expression of chemokines (Upper) and inflammatory molecules (Right) measured 4.5 d p.t. in the CNS by quantitative PCR. Mean ± SD of at least three animals per group. Each sample was measured in duplicate. House-keeping gene: β-actin. Representative data of two independent experiments. (E) MOG mAAb treatment induces recruitment of immune cells to the target organ. Absolute numbers of αβT cells, myeloid cells, and MHC II+ cells measured in the CNS of control or MOG mAAb-treated animals 5 d p.t. Flow cytometry data are presented as mean ± SD. n = 4. (F) MOG mAAb treatment induces recruitment of immune cells to the target organ. Lumbar spinal cord sections at day 5 p.t. (Upper) ED1 and Iba1 immunostaining. Arrows, ED1+ monocytes/macrophages; arrow heads, microglia. (Lower) W3/13 immunostaining. Arrows point to infiltrating T cells. All of the sections were counterstained with DAPI. (Scale bars: overview pictures, 300 µm; Insets, 20 µm.) Fluorescence microscopy data.
Discussion
Our data demonstrate that autoantigen-specific B cells have the potential to substantially contribute to the pathogenesis of CNS autoimmune disease. They not only accelerate disease onset and aggravate established clinical disease, but they also precipitate manifest disease in the situation of subclinical inflammation. These clinical effects could not be explained by any influence of MOG-specific B cells on T-cell proliferation, activation, or cytokine production during activation in the periphery as has been postulated earlier (14–16). However, it should be kept in mind that, in our model, limited numbers of MOG-reactive T and B cells were inserted in otherwise intact immune repertoires whereas most of the former studies were performed in MOG-TCR and -BCR expressing animals: i.e., where the majority of cells of the immune cell repertoires are directed against the myelin autoantigen. Despite the limited MOG-specific B-/T-cell numbers, the B-cell activation process in our model remained completely intact: i.e., BMOG cells interacted with MOG-specific T cells in the draining lymph nodes and efficiently produced autoantibodies. This AAb production was found to be necessary and sufficient for the observed disease-accelerating effects of the B cells, supporting previous findings about a relevant role for AAbs in EAE pathogenesis (34–36). According to the common view, during CNS autoimmunity, the adaptive immune system attacks the brain in two hits that are driven by independent T-cell and B-cell effector mechanisms (4, 18). Thereby autoreactive T cells breach the BBB and induce the recruitment of tissue-damaging immune cells and factors. Autoantibodies, via their binding and complement-attraction capacity, can compromise the function of oligodendrocytes (37) and target a cytotoxic attack to the myelin structures, leading to extensive structural damage (18, 19, 38). Our data do not contradict this concept in general. However, in our experimental setting, which is characterized by low amounts of the provided autoantibody in contrast to previous studies (18, 19, 39), we did not find evidence for increased demyelination after autoantibody application. Mechanisms different from demyelination, such as effector cell maturation or trafficking, were postulated in the past (34), but we did not find evidence for these proposed scenarios either. Instead, our data point to a rather different effector mechanism (Fig. 6). Antibodies can foster T-cell activation by efficiently targeting and concentrating antigen to presentation-competent cells (40, 41), which should be particularly relevant in situations where (i) access of immune cells to the target organ is limited, (ii) antigen is sparsely available for presentation to T cells due to the low turnover of myelin proteins (42), and (iii) the conditions for presentation are suboptimal: i.e., expression of MHC and costimulatory molecules is low and no or few professional APCs are present. This constellation is clearly present during the initiation phase of autoimmunity in the highly specialized immune-deprived CNS tissue (3, 32, 43). Therefore, myelin-specific AAbs that penetrate the CSF and the meninges with the arriving effector T cells can efficiently bind to myelin proteins and accumulate in local APCs (44), thus increasing the amount of presented myelin antigens and enhancing the myelin-antigen presentation capacity of the resident phagocytes. These processes will lower the threshold for disease-relevant T-cell reactivation (Fig. 6). In fact, we recently found that increasing the amounts of presentable antigen in the CNS (e.g., by an i.t. injection of myelin antigen) boosts T-cell reactivation and disease severity (28, 32, 43). A similar function of AAbs was recently postulated in a cancer model, where naturally occurring AAbs enhanced tumor antigen presentation by dendritic cells and subsequent T-cell activation (45). “Off-target” effects of autoantibodies were also observed in a model for systemic lupus erythematosus. There, immune complexes formed by AAbs derived from systemic lupus erythematosus patients were elegantly shown to promote the migration of dendritic cells into LNs and thereby enable efficient autoantigen-specific T-cell responses within the immune specialized LN environment (46). Our data, however, indicate that immune complexes unrelated to CNS-antigens are alone not sufficient to substantially accelerate or enhance CNS autoimmune disease. In our study, human anti-MOG AAbs fully reproduced the clinical effects of their murine counterparts. These findings indicate that elevated autoantibody titers might heighten the risk for developing clinically manifested autoimmune CNS disease or subsequent disease bouts.
Fig. 6.

Schematic depiction summarizing how MOG AAbs enhance autoimmune CNS disease. (Left) In the absence of AAbs, autoantigen-specific effector T cells scan the endothelial cells of the BBB. Few cells penetrate the BBB and are suboptimally reactivated by local APCs (microglia/meningeal macrophages). The reactivated T cells initiate a cascade of inflammatory events, which might eventually lead to autoimmune disease development. (Right) When AAbs are present in the blood circulation, they pass through the BBB along with the autoantigen-specific T cells and locally bind to their specific antigen. The antibody complexes are taken up by resident macrophages/microglia that then efficiently present the myelin antigen to the autoantigen-specific effector T cells. The enhanced reactivation of the effector T cells leads to strongly increased inflammation of the CNS parenchyma and accelerates and aggravates the clinical disease.
In summary, our data demonstrate that consecutive adaptive immune mechanisms dovetail into evoking CNS autoimmune disease. In addition to the T-/B-cell interaction in the periphery, crucial for B cells to form a sustained and high affinity antibody response, there is a second cooperative step in the early effector phase within the target organ: this time between T cells and the specific soluble products of B cells. The myelin-specific autoantibodies act indirectly by trimming resident APCs to efficiently present CNS autoantigen to the effector T cells and thereby help to initiate an efficient, though destructive, T-cell response.
Materials and Methods
For a more detailed discussion of the materials and methods, see SI Materials and Methods. All animal experiments were approved by the Lower Saxony state authority LAVES (Niedersächsisches Landesamt für Verbraucherschutz und Lebensmittelsicherheit). The use of the patient’s material was approved by the Ethic Committee of the Hospital Clinic of Barcelona, and written consent was obtained.
Immune sera.
For the generation of immune sera containing high-titer antibodies against MOG or NP, MOG- or NP-specific BCR knock-in mice were immunized with 25 µg of MOG or NP-Ova, respectively, in complete Freund's adjuvant (CFA), and 2× pertussis toxin (PTX) was given i.p. on day 0 (d0) and d2. Serum was collected 2 wk after immunization. For serum transfer experiments, 100 µL of serum was injected i.v. at either day 5 or day 8 p.i., or, alternatively, 10 µL of serum was injected i.t. into the cisterna magna using a stereotactic device (Narishege) at day 8 p.i.
mAAb.
MOG mAAb was purified from supernatant of the hybridoma cell line 8.18-C5 using HiTrap Protein G HP columns (GE Healthcare) following the manufacturer’s protocol. Afterward, the eluted antibody was desalted using PD-10 Desalting Columns (GE Healthcare) and collected in PBS. For experiments using active EAE in mice, MOG mAAb or IgG1 isotype control (clone MOPC-21; BioXcell) was injected into C57BL/6J hosts at day 8 p.i. either i.v. (50 µg) or i.t. (10 µg). For transfer EAE, MOG mAAb or control Ab was injected i.v. at d2 posttransfer (p.t.) or i.t. at d3 posttransfer. mAAb against beta amyloid (amino acids 1–40) was obtained from antibodies-online GmbH. In rats, 30 µg of each mAAb was injected i.t.
SI Materials and Methods
Animals.
C57BL/6J mice and rats on the LEW/Crl background (Rattus norvegicus), originally purchased from Charles River, were bred in the specific pathogen-free (SPF) animal facility of the University Medical Center Göttingen. The following mouse strains were all housed in the University Medical Center Göttingen animal facility: 2D2 MOG-specific TCR transgenic mice (22), MOG-specific BCR knock-in mice (Th mice) (13), Act-GFP mice (47), knock-in RFP mice (48), OTII mice (49), conditional XBP-1 knock-out mice (50), mb1-Cre mice (51), MHC II knock-out mice (52), CX3CR1-EGFP knock-in mice (53), and NP-specific BCR knock-in mice (23), which were additionally crossed to κ-knock-out mice (54) to enhance the frequency of NP-specific B cells.
EAE Models and Clinical Evaluation.
Active EAE in mice.
T and B cells with different specificities (i.e., TMOG, BMOG, and BNP cells) and genetic modification (i.e., carrying green or red fluorescent proteins or being deficient for XBP-1) were transferred into host mice (i.e., WT C57BL/6J, OTII, or OTII/B1.8 mice), and the animals were immunized 2 d later with 50 µg of MOG35–55 or 20 µg of MOG protein in CFA plus 2× PTX on day 0 and 2 as described (55). The following T- and B-cell numbers were i.v. injected: 8 × 10⁶ in C57BL/6J hosts and 3 × 10⁶ T cells in OTII or OTII/B1.8 mice, and 10 × 106 BMOG cells independently of the host. For the low pathogenic immunization protocol, C57BL/6J mice were transferred with 3 × 10⁶ T cells alone or together with 6 × 10⁶ B cells. Two days later, they were immunized with 25 µg of MOG35–55 peptide in CFA with one dose of PTX on day 0 instead of two doses used for conventional immunization.
Transfer EAE in mice.
For the induction of transfer EAE in mice, a protocol from Shetty et al. (56) was used with minor modifications. In brief, C57BL/6J mice were immunized with 75 µg of MOG35–55 in CFA followed by 200 ng of PTX at d0 and d2 p.i. Draining LNs were harvested at d12 p.i., and the cells were cultured for 3 d in the presence of 25 µg/mL MOG35–55, 25 ng/mL recombinant mouse IL-12 (R&D Systems), and 20 µg/mL anti-IFNγ-Ab (clone XMG1.2; BioXcell, Hölzel Diagnostics). Then, 2.5 × 10⁶ cells were transferred without subsequent PTX administration into naive C57BL/6J recipient mice or Th mice.
Transfer EAE in Lewis rats.
For induction of transfer EAE in Lewis rats, 5 × 10⁶ TMOG-GFP cells or TS100β cells were injected i.v. into healthy recipient rats. The induction of transfer EAE did not require application of PTX. The establishment of CD4+ T cells reactive against MOG protein or S100β protein and retrovirally engineered to express eGFP (TMOG-GFP cells and TS100β cells) was performed as previously reported (28). Animals were monitored daily by measuring their weight and scoring disease progression.
Clinical evaluation.
Scoring of mice followed a different scale than that for rats. The scale for mice was as follows: 0, normal; 1, reduced tone of tail; 2, limp tail, impaired righting; 3, absent righting; 4, gait ataxia; 5, mild paraparesis of hindlimbs; 6, moderate paraparesis; 7, severe paraparesis or paraplegia; 8, tetraparesis; 9, moribund; 10, death. The scale for rats was as follows: 0, no disease; 1, flaccid tail; 2, gait disturbance; 3, complete hind limb paralysis; 4, tetraparesis; 5, death.
Patient Characteristics and Human IgG Preparation.
The human MOG AAb was obtained from a 62-y-old Caucasian woman who presented with a bilateral optic neuritis in August 2010. Cerebral MRI showed T2-hyperintensity of both optic nerves and optic chiasm, and gadolinium enhancement of the left optic nerve. CSF oligoclonal bands were negative, and serum sample tested negative for aquaporin-4 antibodies, and positive for antinuclear antibody. The patient was treated with IV methylprednisolone (1 g/3 d) with full recovery. She experienced two further optic neuritis relapses in May and August 2013, with full improvement after corticosteroids, and was treated with low-dose oral steroids for 6 mo. A new serum sample was tested positive for anti-MOG AAbs by an optimized immunohistochemistry and a live recombinant cell-based assay as described previously (57). The positivity was also confirmed in the stored serum and CSF samples of the first relapse. In January 2015, the patient developed double vision, dysarthria left-sided facial paresis, and bilateral limb and gait ataxia. A brain MRI showed a fluid-attenuated inversion recovery (FLAIR) ponto-mesencephalic lesion with central mesencephalic gadolinium enhancement. After 2 courses of IV methylprednisolone, the patient was treated with rituximab and plasma exchange with progressive clinical improvement and full symptom resolution 3 mo later. IgG was purified from the plasma exchange material using Protein-G Sepharose 4 Fast Flow (GE Healthcare), and the MOG AAb titer of the purified human IgG antibodies was 1:5,120 (IgG1 subclass). As control antibody, human irrelevant IgG or serum from healthy individuals was used. The IgG preparation was reactive mouse MOG (titers 1:5,120).
Antigens.
MOG35–55 (MEVGWYRSPFSRVVHLYRNGK) was obtained from the Charité, Institute for Medical Immunology. 4-Hydroxy-3-nitrophenylacetyl hapten conjugated to OVA (ovalbumin) protein (NP-OVA) was purchased from Biosearch Technologies. MOG-NP fusion peptide was prepared by conjugation of 4-hydroxy-3-nitrophenylacetic acid active ester (NP-OSu) (Biosearch Technologies) to MOG35–55 according to the manufacturer’s recommendation. Rat MOG protein (MOG amino acids 1–125) was recombinantly produced. The plasmid encoding the extracellular domain of rat MOG protein was provided by C. Linington (University of Glasgow, Glasgow, UK). The protein was purified and refolded as described previously (58). The NP-Ova:NP-Ab immune complex was generated by incubating NP-Ovalbumin (LGC Biosearch Technologies) with NP-antibody (clone B1-8; Absolute Antibody) in a ratio of 1:5 at 37 °C for 1 h while shaking. S100β protein was purchased from Sigma-Aldrich.
Cell Isolation, Cytofluorometry, and Fluorescence-Activated Cell Sorting.
CD3+ T cells and CD19+ B cells were isolated from LNs and spleen using the EasySep Mouse T Cell Enrichment Kit (Stemcell Technologies) or the EasySep Mouse B Cell Isolation Kit, respectively, according to the manufacturer’s protocol. Cell purity was routinely determined by flow cytometry and always exceeded 90%. Lymphocytes from the blood were separated via density gradient centrifugation using lymphocyte separation medium. The isolation of lymphocytes from spinal cord and brain was performed as previously described (54). Meningeal APCs were isolated from brain and spinal cord meninges after extensive perfusion with cold 0.9% NaCl using OptiPrep density gradient centrifugation (Fresenius Kabi Norge AS).
FACS analysis was performed as described previously (55). The following anti-mouse antibodies were used: anti-CD3e (clone 145–2C11), anti-CD4 (clone RM4-5 or H129.19), anti-CD8 (clone 53–6.7), anti-CD25 (clone 3C7), anti-CD69 (clone H1.2F3), anti-CD44 (clone IM7), anti-CD62L (clone MEL-14), anti-CD11b (clone M1/70), anti-CD45.2 (clone 104), anti-B220 (clone RA3-6B2), anti-MHC II (clone AF6-120.1), anti-CD86 (clone GL-1), anti-IFNγ (clone XMG1.2), and anti-IL17A (clone TC11-18H10.1) (all from Biolegend) and anti–GM-CSF (clone MP1-22E9) (BD Bioscience). For surface staining of rat samples, the following antibodies were used: αβTCR (clone R73), CD11b (clone Ox-42), MHC II RT1-B (clone OX-6) (all from AbD Serotec). For intracellular staining, PE anti-mouse IL17A (BD Bioscience) and anti-rat IFNγ (clone DB-1; Biosource) were used. Mouse IgG1κ (MOPC 31 C; Sigma-Aldrich) served as isotype control. Allophycocyanin (APC)-labeled anti-mouse antibody (Dianova) was used as secondary antibody. Stained cells were analyzed either on a FACSCalibur or on a FACSAria II [Special Order Research Products (SORP); BD Bioscience]. Final analysis was performed using FlowJo V10 (Tree Star) software. The injected Ag-specific T and B cells could be tracked due to their expression of either RFP or GFP. Cell sorting was performed with the BD FACSAria II (SORP; BD Bioscience). Flow cytometric quantification of T cells was performed by relating the number of cells to a known absolute number of fluorescent beads (BD Bioscience). In some experiments, the cells were labeled with CFSE as previously described (50) with the modification that 0.25 µM CFSE was used.
Intravital Two-Photon Laser Scanning Microscopy: Preparation of Animals and Labeling of Phagocytic Cells and Blood Vessels.
Animals were anesthetized by 1 mg/kg dorbene and 100 mg/kg ketamine and placed on the custom-built heated stage. Body temperature was monitored with a rectal temperature probe (Telemeter Electronic GmbH) and was kept at 36–37 °C. Oxygen was delivered through a mask placed in front of the snout. Microsurgical preparation of the popliteal LN was adapted from Mempel et al. (59). The imaging of the spinal cord is described in detail elsewhere (60).
For the visualization of the T-/B-cell interaction in the draining popliteal LN, cohorts of mice were imaged every 10 h starting 10 h p.i. and ending 50 h p.i. in several separate experiments, including a total of 22 mice. For the visualization of T-cell entry into the spinal cord, cohorts of mice were imaged in several separate experiments (in total, 62 mice were imaged) starting at day 8 p.i. until day 11 p.i. with time intervals of 12 h to cover the entire relevant time span in which T-cell infiltration into the CNS starts and develops into manifested invasion and in which B cells also potentially could enter the CNS.
For visualization of antibody uptake by meningeal phagocytes, specific antibodies conjugated with SeTau-647-NHS (Seta Biomedicals) were injected either at a dosage of 10 µg per mouse via a stereotactic device into the cisterna magna of anesthetized animals or at a dosage of 50 µg per mouse i.v.. Blood vessel lumen was visualized by i.v. infusion of fluorescently labeled 70-kDa or 2,000-kDa dextran before or during intravital 2-PM recordings.
The 2-PM was performed using an LSM710/Axio Examiner Z1 microscope (Carl Zeiss Microimaging) combined with a >2.5-watt Ti:Sapphire Chameleon Vision II Laser device (Coherent GmbH). The excitation wavelength was tuned to 880 nm or 1,010 nm and routed through a 20× Plan-APOCHROMAT water immersion objective with N.A. 0.95 (Carl Zeiss Microimaging). Excited fluorescence was detected with nondescanned detectors equipped with 442/46, 483/32, 525/50, 550/49, 607/70, 624/40, and 680/26 nm band-pass filters (Semrock Inc.). Collagen was detected by two-photon–generated second-harmonic signals. The microscope was operated with Zen 2009 software (Carl Zeiss). A stack of images with 4 µm space apart on the z axis and scan size of 512 × 512 pixels was recorded at 32-s time intervals with line averaging of two scans for 60 cycles. Four-dimensional (x, y, z, and t) image stacks were analyzed with Imaris 7.1.1 software (Bitplane). Motility parameters were exported into Microsoft Excel and were plotted in GraphPad Prism 5.04.
RNA Isolation, cDNA Synthesis, and Quantitative PCR.
RNA isolation was performed using Qiagen RNeasy Kits (Qiagen) following the manufacturer’s protocol. cDNA synthesis was performed using a RevertAid First Strand cDNA Synthesis Kit (Thermo) with random hexamer primer as described in the manufacturer’s protocol.
Quantitative PCR was performed with the qPCR Master Mix on a StepOnePlus Real-Time PCR System. The 2[-Delta Delta C(T)] method was used to analyze the relative changes in gene expression. Quantitative PCR was performed with target-specific FAM- and TAMRA-labeled TaqMan probes. Analysis was performed using StepOnePlus Software v2.0. Expression was normalized to that of a house-keeping gene: i.e., HPRT in mice or beta actin in rats. The following primers and probes were used in mice: Hprt, Fw, TGCTCGAGATGTCATGAAGG; Rev, TATGTCCCCCGTTGACTGAT; Probe, [6FAM]ATCACATTGTGGCCCTCTGT[TAM]; Ifng, Fw, TCAAGTGGCATAGATGTGGAAGAA; Rev, TGGCTCTGCAGGATTTTCATG; Probe, [6FAM]TCACCATCCTTTTGCCAGTTCCTCCAG[TAM]; Csf2, Fw, GGGCGCCTTGAACATGAC; Rev, CGCATAGGTGGTAACTTGTGTTTC; Probe, [6FAM]CCCCCCAACTCCGGAAACGGA[TAM]; Il17a, Fw, ACTTTCAGGGTCGAGAAGATGCT; Rev, TTCTGAATCTGCCTCTGAATCCAC; Probe, [6FAM]TGGGTGTGGGCTGCACCTGC[TAM]; Ccl2, Fw, TGT CAT GCT TCT GGG CCT GC; Rev, CCT GCT GCT GGT GAT CCT CT; Probe, [6FAM]CTCACCTGCTGCTACTCATTCACC[TAM]; Ccl5, Fw, GGAGTATTTCTACACCAGCAGCAA; Rev, CACACACTTGGCGGTTCCTT; Probe, [6FAM]TGCTCCAATCTTGCAGTCGTGTTTGTCA[TAM]; Cxcl10, Fw, CATCCCTGCGAGCCTATCC; Rev, CATCTCTGCTCATCATTCTTTTTCA; Probe, [6FAM]CCCACGTGTTGAGATCATTGCCACG[TAM]; Cxcl12, Fw, CAAGCATCTGAAAATCCTCAACAC; Rev, GCACACTTGTCTGTTGTTGTTCTTC; Probe, [6FAM]AAACTGTGCCCTTCAGATTGTTGCACG[TAM]; Bcl6, Fw, GGCCTCCTTCCGCTACAAG; Rev, TGCGCTCCACAAATGTTACAG; Probe, [6FAM]CCACAAGACTGTCCACACGGGTGAGA[TAM]; PDCD1, Fw, TGGCTTCTAGAGGTCCCCAAT; Rev, TGCAGGTGAAGGTGGCATT; Probe, [6FAM]CCCTGGAGGTCCCTCACCTTCTACCC[TAM]; ICOS, Fw, CTTGCAGGTGTGACCTCATAAGC; Rev, AGAAGAATTTCTCCATTCAAGTTTCAG; Probe, [6FAM]ACACCCGGACCCACAGAGGAAACG[TAM]; Cxcr5, Fw, ACATCCTGGTGCTGGTAATCCT; Rev, GGCTACTGCGAGGTGGAACA; Probe, [6FAM]AGGCACCGGCACACTCGGAGC[TAM]; Il21, Fw, GCATGCAGCTTTTGCCTGTT; Rev, CACGAGGTCAATGATGAATGTCTT; Probe, [6FAM]AGAAGGCCAAACTCAAGCCATCAAACCC[TAM]. The following primers and probes were used in rats: Actb, Fw, GTACAACCTCCTTGCAGCTCCT; Rev, TTGTCGACGACGAGCGC; Probe, [6FAM]CGCCACCAGTTCGCCATGGAT[TAM]; Ifng, Fw, AACAGTAAAGCAAAAAAGGATGCATT; Rev, TTCATTGACAGCTTTGTGCTGG; Probe, [6FAM]CGCCAAGTTCGAGGTGAACAACCC[TAM]; Il17a, Fw, GAGTCCCCGGAGAATTCCAT; Rev, GAGTACCGCTGCCTTCACTGT; Probe, [6FAM]ATGTGCCTGATGCTGTT[TAM]; Ccl5, Fw, CAACCTTGCAGTCGTCTTTGTC; Rev, GATGTATTCTTGAACCCACTTCTTCTC; Probe, [6FAM]AGGAACCGCCAAGTGTGTGCCAAC[TAM]; Ccl9, Fw, TTGCCCCAAGCCCTAACTG; Rev, ACCCTTGCTGAATCTGGGTCTAG; Probe, [6FAM]CATCGCTACACTGAAGAACGGAGATC[TAM]; Cxcl10, Fw, CGTGCTGCTGAGTCTGAGT; Rev, GTCTCAGCGGCTGTTCAT; Probe, [6FAM]CTCAAGGGATCCCTCTCGGAAGAAC[TAM]; Cxcl11, Fw, GGTTCCAGGCTTCGTTATGTTC; Rev, AACTTCCTTGATTGCTGCCATT; Probe, [6FAM]CTGTCTTTGCATCGACCGCGGAGT[TAM]; Tnfa, Fw, TCGAGTGACAAGCCCGTAGC; Rev, CTCAGCCACTCCAGCTGCTC; Probe, [6FAM]CGTCGTAGCAAACCACCAAGCAGA[TAM]; Il2r, Fw, CACAGTCTGTGTACCAGGAGAACCT; Rev, CCACGAAGTGGTAGATTCTCTTGG; Probe, [6FAM]CAGGTCACTGCAGGGAGCCCCC[TAM]; Nos2, Fw, TTCCCATCGCTCCGCTG; Rev, CCGGAGCTGTAGCACTGCA; Probe, [6FAM]AACACAGTAATGGCCGACCTGATGTTGC[TAM].
RNA Sequencing.
Transcriptome analysis by RNAseq was performed either on TMOG cells isolated and purified ex vivo before transfer or sorted from the spleen of T-MOG or T-/B-MOG mice (generated by transfer of TMOG or TMOG and BMOG cells into OT II mice) at day 9 p.i. RNA samples (three independent biological replicates for each condition) were prepared with the TruSeq RNA Sample Prep Kit v2 according to the manufacturer’s protocol (Illumina). Single 50-bp-read sequencing was conducted using a HiSeq 2000 platform (Illumina). Data were preprocessed and analyzed in the R/Bioconductor environment using the DESeq2 package, including the statistical calculation of differentially expressed genes. Candidate genes were filtered to a minimum of twofold change and false discovery rate-corrected P value < 0.05. Gene expression levels of effector TMOG cells from T-MOG and T-/B-MOG mice were virtually identical (only four significant changes out of more than 38.000 genes) but differed significantly from naive TMOG cells (4,141 and 3,626 significant changes against TMOG cells from T-MOG and T-/B-MOG mice, respectively).
In Vitro Testing of the Antigen Presentation Capacity of Peripheral and CNS-Resident Cells.
For in vitro T- and B-cell coculture experiments, antigen-specific T and B cells were isolated from respective naive donor mice. Then, 1 × 10⁶ T cells and 2 × 10⁶ B cells were cocultured for 3 d with increasing concentrations of different antigens in a range from 0 to 1 μg/mL in a 24-well plate in RPMI. The T cells were CFSE-labeled before coculture, and their proliferation was then analyzed by flow cytometry.
For the assessment of the antigen-presenting capacity of meningeal APCs, MOG-immunized C57BL/6J mice were i.t. injected with either 10 µg of MOG mAAb or isotype control Ab 8 d p.i. One day later, the meningeal cells were isolated as described above. Then, 5 × 10⁴ meningeal cells were cocultured with 2.5 × 10⁵ resting TH17 differentiated cells. These TH17 differentiated cells were generated from draining LN cells of immunized 2D2 mice cultured in the presence of 10 µg/mL MOG35–55, 2.5 µg/mL anti-CD3 antibody (Biolegend), anti–IL-4 antibody (clone 11b11; BioXcell), 30 ng/mL IL-6 (Biolegend), 12 ng/mL hTGF-β (R&D), and 20 µg/mL anti-IFNγ antibody (clone XMG1.2; BioXcell) for 2 d and additionally restimulated with either irradiated thymocytes or splenocytes in the presence of 20 µg/mL MOG35–55 for 3 d. The differentiation into the TH17 phenotype was confirmed by intracellular staining. For the coculture experiments, the cell culture supernatant was collected after 72 h, and soluble IL-17A was determined via ELISA.
Primary microglia cells were isolated as previously described (61). For in vitro coculture, 5 × 10⁴ cells per well were seeded into a round-bottom 96-well plate. One day later, the medium was removed, and the microglia cells were cocultured with 2.5 × 10⁵ TH17 cells in the presence or absence of 5 µg/mL myelin particles (62) with or without 5 µg/mL MOG mAAb, isotype control, or NP-Ova:NP-Ab immune complex. Three days later, the supernatant was removed, and IL-17A was determined by ELISA.
Cytokine ELISA.
Soluble IFNγ, IL-17A, and GM-CSF were determined from supernatants of various in vitro cultures as previously described (63) using Mouse ELISA MAX Deluxe (Biolegend) for IFNγ and IL-17A or capture antibody, detection antibody and standard from R&D Systems for GM-CSF following the manufacturer’s protocol. The absorbance was measured at 450 nm, with correction wavelength of 620 nm using a Sunrise ELISA plate reader (Tecan).
Evaluation of Antibody Titers in Serum and CSF.
For determination of MOG AAbs, ELISA plates were coated either with 4 μg/mL rat MOG protein or with 10 μg/mL MOG35–55 in PBS overnight at 4 °C. For determination of NP-specific antibodies, plates were coated with 5 μg/mL NP-OVA or 5 µg/mL OVA as control. Sera samples were diluted with dilution buffer 1:100 and 1:1,000 and analyzed in triplicate; CSF samples were diluted 1:100. HRP-conjugated detection antibodies against mouse IgM and IgG (Sigma) or biotin-conjugated IgG1, IgG2a, IgG2b, and IgG3 and additional STR-HRP (all from Biolegend) were used in a 1:250 dilution. Of note, NP-specific BCR knock-in mice are unable to mount an antibody response specific for MOG.
Histology and Immunohistochemistry.
Histological analysis was performed as previously described (2, 32, 55).
Statistical Analysis.
Statistical analysis was performed using the nonparametric Mann–Whitney U test, with the exception of qPCR samples where the two-tailed t test was used. Differences in the incidence of EAE were calculated using the χ2 test. For the comparison of T-cell velocity during the priming phase in the presence/absence of BMOG cells, a one-way ANOVA nonparametric Kruskal–Wallis test, followed by Dunn’s multiple comparison test, was used. Differences were considered significant with ***P < 0.001, **P < 0.01, and *P < 0.05.
Supplementary Material
Acknowledgments
We thank S. Hamann, A. Stas, B. Curdt, M. Weig, and N. Meyer (University Medical Center Göttingen) and K. Schanda (Medical University of Innsbruck) for excellent technical assistance, and C. Ludwig for text editing. We thank M. Simons and L. Cantuti for providing us with myelin particles; C. Schläger for help with 3D reconstruction; and G. Salinas-Riester, T. Lingner, and the TAL team for help with RNA sequencing. We thank D. R. Johnson for critical reading of the manuscript and T. Ziemssen, K. Dittmann, A. Hutloff, V. Kuchroo, M. Reth, H. Wekerle, R. Dressel, K. Rajewski, H. Plough, and S. Jung for providing and transferring mice. A.F., F.L., and F.O. were supported by the Deutsche Forschungsgemeinschaft (TRR-SFB43, FOR1336, FL 377/2-1, and RK-Grant FL 377/3-1), the Niedersachsen-Research Network on Neuroinfectiology (N-RENNT) of the Ministry of Science and Culture of Lower Saxony, the Bundesministerium für Bildung und Forschung (“UNDERSTAND MS”), and the Hertie Foundation (Grants 1.01.1/11/004 and 1130072). M.R. was supported by Research Grant “BIG WIG MS” from the Austrian Federal Ministry of Science, Research, and Economy. A.S. was supported by Marató de TV3 (20141830).
Footnotes
The authors declare no conflict of interest.
This article is a PNAS Direct Submission.
This article contains supporting information online at www.pnas.org/lookup/suppl/doi:10.1073/pnas.1519608113/-/DCSupplemental.
References
- 1.Steinman L. Immunology of relapse and remission in multiple sclerosis. Annu Rev Immunol. 2014;32:257–281. doi: 10.1146/annurev-immunol-032713-120227. [DOI] [PubMed] [Google Scholar]
- 2.Flügel A, et al. Migratory activity and functional changes of green fluorescent effector cells before and during experimental autoimmune encephalomyelitis. Immunity. 2001;14(5):547–560. doi: 10.1016/s1074-7613(01)00143-1. [DOI] [PubMed] [Google Scholar]
- 3.Wekerle H, et al. Cellular immune reactivity within the CNS. Trends Neurosci. 1986;9:271–277. [Google Scholar]
- 4.Krumbholz M, Derfuss T, Hohlfeld R, Meinl E. B cells and antibodies in multiple sclerosis pathogenesis and therapy. Nat Rev Neurol. 2012;8(11):613–623. doi: 10.1038/nrneurol.2012.203. [DOI] [PubMed] [Google Scholar]
- 5.Obermeier B, et al. Matching of oligoclonal immunoglobulin transcriptomes and proteomes of cerebrospinal fluid in multiple sclerosis. Nat Med. 2008;14(6):688–693. doi: 10.1038/nm1714. [DOI] [PubMed] [Google Scholar]
- 6.Genain CP, Cannella B, Hauser SL, Raine CS. Identification of autoantibodies associated with myelin damage in multiple sclerosis. Nat Med. 1999;5(2):170–175. doi: 10.1038/5532. [DOI] [PubMed] [Google Scholar]
- 7.Magliozzi R, et al. Meningeal B-cell follicles in secondary progressive multiple sclerosis associate with early onset of disease and severe cortical pathology. Brain. 2007;130(Pt 4):1089–1104. doi: 10.1093/brain/awm038. [DOI] [PubMed] [Google Scholar]
- 8.Serafini B, Rosicarelli B, Magliozzi R, Stigliano E, Aloisi F. Detection of ectopic B-cell follicles with germinal centers in the meninges of patients with secondary progressive multiple sclerosis. Brain Pathol. 2004;14(2):164–174. doi: 10.1111/j.1750-3639.2004.tb00049.x. [DOI] [PMC free article] [PubMed] [Google Scholar]
- 9.Hauser SL, et al. HERMES Trial Group B-cell depletion with rituximab in relapsing-remitting multiple sclerosis. N Engl J Med. 2008;358(7):676–688. doi: 10.1056/NEJMoa0706383. [DOI] [PubMed] [Google Scholar]
- 10.Weinshenker BG, et al. A randomized trial of plasma exchange in acute central nervous system inflammatory demyelinating disease. Ann Neurol. 1999;46(6):878–886. doi: 10.1002/1531-8249(199912)46:6<878::aid-ana10>3.0.co;2-q. [DOI] [PubMed] [Google Scholar]
- 11.Bettelli E, Baeten D, Jäger A, Sobel RA, Kuchroo VK. Myelin oligodendrocyte glycoprotein-specific T and B cells cooperate to induce a Devic-like disease in mice. J Clin Invest. 2006;116(9):2393–2402. doi: 10.1172/JCI28334. [DOI] [PMC free article] [PubMed] [Google Scholar]
- 12.Krishnamoorthy G, Lassmann H, Wekerle H, Holz A. Spontaneous opticospinal encephalomyelitis in a double-transgenic mouse model of autoimmune T cell/B cell cooperation. J Clin Invest. 2006;116(9):2385–2392. doi: 10.1172/JCI28330. [DOI] [PMC free article] [PubMed] [Google Scholar]
- 13.Litzenburger T, et al. B lymphocytes producing demyelinating autoantibodies: Development and function in gene-targeted transgenic mice. J Exp Med. 1998;188(1):169–180. doi: 10.1084/jem.188.1.169. [DOI] [PMC free article] [PubMed] [Google Scholar]
- 14.Molnarfi N, et al. MHC class II-dependent B cell APC function is required for induction of CNS autoimmunity independent of myelin-specific antibodies. J Exp Med. 2013;210(13):2921–2937. doi: 10.1084/jem.20130699. [DOI] [PMC free article] [PubMed] [Google Scholar]
- 15.Parker Harp CR, et al. B cell antigen presentation is sufficient to drive neuroinflammation in an animal model of multiple sclerosis. J Immunol. 2015;194(11):5077–5084. doi: 10.4049/jimmunol.1402236. [DOI] [PMC free article] [PubMed] [Google Scholar]
- 16.Barr TA, et al. B cell depletion therapy ameliorates autoimmune disease through ablation of IL-6-producing B cells. J Exp Med. 2012;209(5):1001–1010. doi: 10.1084/jem.20111675. [DOI] [PMC free article] [PubMed] [Google Scholar]
- 17.Li R, et al. Canadian B cells in MS Team Proinflammatory GM-CSF-producing B cells in multiple sclerosis and B cell depletion therapy. Sci Transl Med. 2015;7(310):310ra166. doi: 10.1126/scitranslmed.aab4176. [DOI] [PubMed] [Google Scholar]
- 18.Linington C, Bradl M, Lassmann H, Brunner C, Vass K. Augmentation of demyelination in rat acute allergic encephalomyelitis by circulating mouse monoclonal antibodies directed against a myelin/oligodendrocyte glycoprotein. Am J Pathol. 1988;130(3):443–454. [PMC free article] [PubMed] [Google Scholar]
- 19.Schluesener HJ, Sobel RA, Linington C, Weiner HL. A monoclonal antibody against a myelin oligodendrocyte glycoprotein induces relapses and demyelination in central nervous system autoimmune disease. J Immunol. 1987;139(12):4016–4021. [PubMed] [Google Scholar]
- 20.Shen P, et al. IL-35-producing B cells are critical regulators of immunity during autoimmune and infectious diseases. Nature. 2014;507(7492):366–370. doi: 10.1038/nature12979. [DOI] [PMC free article] [PubMed] [Google Scholar]
- 21.Tedder TF. B10 cells: A functionally defined regulatory B cell subset. J Immunol. 2015;194(4):1395–1401. doi: 10.4049/jimmunol.1401329. [DOI] [PubMed] [Google Scholar]
- 22.Bettelli E, et al. Myelin oligodendrocyte glycoprotein-specific T cell receptor transgenic mice develop spontaneous autoimmune optic neuritis. J Exp Med. 2003;197(9):1073–1081. doi: 10.1084/jem.20021603. [DOI] [PMC free article] [PubMed] [Google Scholar]
- 23.Sonoda E, et al. B cell development under the condition of allelic inclusion. Immunity. 1997;6(3):225–233. doi: 10.1016/s1074-7613(00)80325-8. [DOI] [PubMed] [Google Scholar]
- 24.Gold R, Linington C, Lassmann H. Understanding pathogenesis and therapy of multiple sclerosis via animal models: 70 years of merits and culprits in experimental autoimmune encephalomyelitis research. Brain. 2006;129(Pt 8):1953–1971. doi: 10.1093/brain/awl075. [DOI] [PubMed] [Google Scholar]
- 25.Okada T, et al. Antigen-engaged B cells undergo chemotaxis toward the T zone and form motile conjugates with helper T cells. PLoS Biol. 2005;3(6):e150. doi: 10.1371/journal.pbio.0030150. [DOI] [PMC free article] [PubMed] [Google Scholar]
- 26.Hu CC, Dougan SK, McGehee AM, Love JC, Ploegh HL. XBP-1 regulates signal transduction, transcription factors and bone marrow colonization in B cells. EMBO J. 2009;28(11):1624–1636. doi: 10.1038/emboj.2009.117. [DOI] [PMC free article] [PubMed] [Google Scholar]
- 27.Linnington C, Webb M, Woodhams PL. A novel myelin-associated glycoprotein defined by a mouse monoclonal antibody. J Neuroimmunol. 1984;6(6):387–396. doi: 10.1016/0165-5728(84)90064-x. [DOI] [PubMed] [Google Scholar]
- 28.Kawakami N, et al. The activation status of neuroantigen-specific T cells in the target organ determines the clinical outcome of autoimmune encephalomyelitis. J Exp Med. 2004;199(2):185–197. doi: 10.1084/jem.20031064. [DOI] [PMC free article] [PubMed] [Google Scholar]
- 29.Linington C, et al. T cells specific for the myelin oligodendrocyte glycoprotein mediate an unusual autoimmune inflammatory response in the central nervous system. Eur J Immunol. 1993;23(6):1364–1372. doi: 10.1002/eji.1830230627. [DOI] [PubMed] [Google Scholar]
- 30.Bartholomäus I, et al. Effector T cell interactions with meningeal vascular structures in nascent autoimmune CNS lesions. Nature. 2009;462(7269):94–98. doi: 10.1038/nature08478. [DOI] [PubMed] [Google Scholar]
- 31.Kivisäkk P, et al. Localizing central nervous system immune surveillance: Meningeal antigen-presenting cells activate T cells during experimental autoimmune encephalomyelitis. Ann Neurol. 2009;65(4):457–469. doi: 10.1002/ana.21379. [DOI] [PMC free article] [PubMed] [Google Scholar]
- 32.Lodygin D, et al. A combination of fluorescent NFAT and H2B sensors uncovers dynamics of T cell activation in real time during CNS autoimmunity. Nat Med. 2013;19(6):784–790. doi: 10.1038/nm.3182. [DOI] [PubMed] [Google Scholar]
- 33.Mues M, et al. Real-time in vivo analysis of T cell activation in the central nervous system using a genetically encoded calcium indicator. Nat Med. 2013;19(6):778–783. doi: 10.1038/nm.3180. [DOI] [PubMed] [Google Scholar]
- 34.Lyons JA, Ramsbottom MJ, Cross AH. Critical role of antigen-specific antibody in experimental autoimmune encephalomyelitis induced by recombinant myelin oligodendrocyte glycoprotein. Eur J Immunol. 2002;32(7):1905–1913. doi: 10.1002/1521-4141(200207)32:7<1905::AID-IMMU1905>3.0.CO;2-L. [DOI] [PubMed] [Google Scholar]
- 35.Myers KJ, Sprent J, Dougherty JP, Ron Y. Synergy between encephalitogenic T cells and myelin basic protein-specific antibodies in the induction of experimental autoimmune encephalomyelitis. J Neuroimmunol. 1992;41(1):1–8. doi: 10.1016/0165-5728(92)90188-q. [DOI] [PubMed] [Google Scholar]
- 36.Willenborg DO, Sjollema P, Danta G. Immunoglobulin deficient rats as donors and recipients of effector cells of allergic encephalomyelitis. J Neuroimmunol. 1986;11(2):93–103. doi: 10.1016/0165-5728(86)90111-6. [DOI] [PubMed] [Google Scholar]
- 37.Marta CB, Oliver AR, Sweet RA, Pfeiffer SE, Ruddle NH. Pathogenic myelin oligodendrocyte glycoprotein antibodies recognize glycosylated epitopes and perturb oligodendrocyte physiology. Proc Natl Acad Sci USA. 2005;102(39):13992–13997. doi: 10.1073/pnas.0504979102. [DOI] [PMC free article] [PubMed] [Google Scholar]
- 38.Piddlesden SJ, Lassmann H, Zimprich F, Morgan BP, Linington C. The demyelinating potential of antibodies to myelin oligodendrocyte glycoprotein is related to their ability to fix complement. Am J Pathol. 1993;143(2):555–564. [PMC free article] [PubMed] [Google Scholar]
- 39.Morris-Downes MM, et al. Pathological and regulatory effects of anti-myelin antibodies in experimental allergic encephalomyelitis in mice. J Neuroimmunol. 2002;125(1-2):114–124. doi: 10.1016/s0165-5728(02)00040-1. [DOI] [PubMed] [Google Scholar]
- 40.Getahun A, Dahlström J, Wernersson S, Heyman B. IgG2a-mediated enhancement of antibody and T cell responses and its relation to inhibitory and activating Fc gamma receptors. J Immunol. 2004;172(9):5269–5276. doi: 10.4049/jimmunol.172.9.5269. [DOI] [PubMed] [Google Scholar]
- 41.Manca F, Fenoglio D, Li Pira G, Kunkl A, Celada F. Effect of antigen/antibody ratio on macrophage uptake, processing, and presentation to T cells of antigen complexed with polyclonal antibodies. J Exp Med. 1991;173(1):37–48. doi: 10.1084/jem.173.1.37. [DOI] [PMC free article] [PubMed] [Google Scholar]
- 42.Toyama BH, et al. Identification of long-lived proteins reveals exceptional stability of essential cellular structures. Cell. 2013;154(5):971–982. doi: 10.1016/j.cell.2013.07.037. [DOI] [PMC free article] [PubMed] [Google Scholar]
- 43.Odoardi F, Kawakami N, Klinkert WE, Wekerle H, Flügel A. Blood-borne soluble protein antigen intensifies T cell activation in autoimmune CNS lesions and exacerbates clinical disease. Proc Natl Acad Sci USA. 2007;104(47):18625–18630. doi: 10.1073/pnas.0705033104. [DOI] [PMC free article] [PubMed] [Google Scholar]
- 44.Trotter J, DeJong LJ, Smith ME. Opsonization with antimyelin antibody increases the uptake and intracellular metabolism of myelin in inflammatory macrophages. J Neurochem. 1986;47(3):779–789. doi: 10.1111/j.1471-4159.1986.tb00679.x. [DOI] [PubMed] [Google Scholar]
- 45.Carmi Y, et al. Allogeneic IgG combined with dendritic cell stimuli induce antitumour T-cell immunity. Nature. 2015;521(7550):99–104. doi: 10.1038/nature14424. [DOI] [PMC free article] [PubMed] [Google Scholar]
- 46.Clatworthy MR, et al. Immune complexes stimulate CCR7-dependent dendritic cell migration to lymph nodes. Nat Med. 2014;20(12):1458–1463. doi: 10.1038/nm.3709. [DOI] [PMC free article] [PubMed] [Google Scholar]
- 47.Okabe M, Ikawa M, Kominami K, Nakanishi T, Nishimune Y. ‘Green mice’ as a source of ubiquitous green cells. FEBS Lett. 1997;407(3):313–319. doi: 10.1016/s0014-5793(97)00313-x. [DOI] [PubMed] [Google Scholar]
- 48.Luche H, Weber O, Nageswara Rao T, Blum C, Fehling HJ. Faithful activation of an extra-bright red fluorescent protein in “knock-in” Cre-reporter mice ideally suited for lineage tracing studies. Eur J Immunol. 2007;37(1):43–53. doi: 10.1002/eji.200636745. [DOI] [PubMed] [Google Scholar]
- 49.Barnden MJ, Allison J, Heath WR, Carbone FR. Defective TCR expression in transgenic mice constructed using cDNA-based alpha- and beta-chain genes under the control of heterologous regulatory elements. Immunol Cell Biol. 1998;76(1):34–40. doi: 10.1046/j.1440-1711.1998.00709.x. [DOI] [PubMed] [Google Scholar]
- 50.Hetz C, et al. Unfolded protein response transcription factor XBP-1 does not influence prion replication or pathogenesis. Proc Natl Acad Sci USA. 2008;105(2):757–762. doi: 10.1073/pnas.0711094105. [DOI] [PMC free article] [PubMed] [Google Scholar]
- 51.Hobeika E, et al. Testing gene function early in the B cell lineage in mb1-cre mice. Proc Natl Acad Sci USA. 2006;103(37):13789–13794. doi: 10.1073/pnas.0605944103. [DOI] [PMC free article] [PubMed] [Google Scholar]
- 52.Madsen L, et al. Mice lacking all conventional MHC class II genes. Proc Natl Acad Sci USA. 1999;96(18):10338–10343. doi: 10.1073/pnas.96.18.10338. [DOI] [PMC free article] [PubMed] [Google Scholar]
- 53.Jung S, et al. Analysis of fractalkine receptor CX(3)CR1 function by targeted deletion and green fluorescent protein reporter gene insertion. Mol Cell Biol. 2000;20(11):4106–4114. doi: 10.1128/mcb.20.11.4106-4114.2000. [DOI] [PMC free article] [PubMed] [Google Scholar]
- 54.Zou YR, Takeda S, Rajewsky K. Gene targeting in the Ig kappa locus: Efficient generation of lambda chain-expressing B cells, independent of gene rearrangements in Ig kappa. EMBO J. 1993;12(3):811–820. doi: 10.1002/j.1460-2075.1993.tb05721.x. [DOI] [PMC free article] [PubMed] [Google Scholar]
- 55.Wüst S, et al. Peripheral T cells are the therapeutic targets of glucocorticoids in experimental autoimmune encephalomyelitis. J Immunol. 2008;180(12):8434–8443. doi: 10.4049/jimmunol.180.12.8434. [DOI] [PubMed] [Google Scholar]
- 56.Shetty A, et al. Immunodominant T-cell epitopes of MOG reside in its transmembrane and cytoplasmic domains in EAE. Neurol Neuroimmunol Neuroinflamm. 2014;1(2):e22. doi: 10.1212/NXI.0000000000000022. [DOI] [PMC free article] [PubMed] [Google Scholar]
- 57.Mader S, et al. Complement activating antibodies to myelin oligodendrocyte glycoprotein in neuromyelitis optica and related disorders. J Neuroinflammation. 2011;8:184. doi: 10.1186/1742-2094-8-184. [DOI] [PMC free article] [PubMed] [Google Scholar]
- 58.Adelmann M, et al. The N-terminal domain of the myelin oligodendrocyte glycoprotein (MOG) induces acute demyelinating experimental autoimmune encephalomyelitis in the Lewis rat. J Neuroimmunol. 1995;63(1):17–27. doi: 10.1016/0165-5728(95)00124-7. [DOI] [PubMed] [Google Scholar]
- 59.Mempel TR, Henrickson SE, Von Andrian UH. T-cell priming by dendritic cells in lymph nodes occurs in three distinct phases. Nature. 2004;427(6970):154–159. doi: 10.1038/nature02238. [DOI] [PubMed] [Google Scholar]
- 60.Schläger C, Litke T, Flügel A, Odoardi F. In vivo visualization of (auto)immune processes in the central nervous system of rodents. Methods Mol Biol. 2016;1304:117–129. doi: 10.1007/7651_2014_150. [DOI] [PubMed] [Google Scholar]
- 61.Regen T, et al. CD14 and TRIF govern distinct responsiveness and responses in mouse microglial TLR4 challenges by structural variants of LPS. Brain Behav Immun. 2011;25(5):957–970. doi: 10.1016/j.bbi.2010.10.009. [DOI] [PubMed] [Google Scholar]
- 62.Larocca JN, Norton WT. 2007. Isolation of myelin. Curr Protoc Cell Biol, Chap 3, Unit 3.25.
- 63.Schweingruber N, et al. Chemokine-mediated redirection of T cells constitutes a critical mechanism of glucocorticoid therapy in autoimmune CNS responses. Acta Neuropathol. 2014;127(5):713–729. doi: 10.1007/s00401-014-1248-4. [DOI] [PMC free article] [PubMed] [Google Scholar]
Associated Data
This section collects any data citations, data availability statements, or supplementary materials included in this article.