Significance
The cardiac thin filament (CTF) is a complex and highly dynamic multiprotein complex that regulates heart function at the molecular level. Mutations in proteins that comprise the thin filament cause cardiomyopathic remodeling that is due, in part, to dysregulation of Ca2+ binding. Many of the known mutations in multiple thin filament proteins occur at a significant physical distance from the Ca2+ binding domain; thus, the elucidation of molecular mechanisms has been challenging. We have developed and now apply an atomistic model of the CTF to this question and have obtained molecular insight that both provides disease mechanisms and facilitates future rational drug design. Finding the molecular cause of disease is the first step in designing molecular interventions.
Keywords: cardiac thin filament, hypertrophic cardiomyopathy, calcium homeostasis, molecular modeling, steered molecular dynamics
Abstract
Calcium binding and dissociation within the cardiac thin filament (CTF) is a fundamental regulator of normal contraction and relaxation. Although the disruption of this complex, allosterically mediated process has long been implicated in human disease, the precise atomic-level mechanisms remain opaque, greatly hampering the development of novel targeted therapies. To address this question, we used a fully atomistic CTF model to test both Ca2+ binding strength and the energy required to remove Ca2+ from the N-lobe binding site in WT and mutant troponin complexes that have been linked to genetic cardiomyopathies. This computational approach is combined with measurements of in vitro Ca2+ dissociation rates in fully reconstituted WT and cardiac troponin T R92L and R92W thin filaments. These human disease mutations represent known substitutions at the same residue, reside at a significant distance from the calcium binding site in cardiac troponin C, and do not affect either the binding pocket affinity or EF-hand structure of the binding domain. Both have been shown to have significantly different effects on cardiac function in vivo. We now show that these mutations independently alter the interaction between the Ca2+ ion and cardiac troponin I subunit. This interaction is a previously unidentified mechanism, in which mutations in one protein of a complex indirectly affect a third via structural and dynamic changes in a second to yield a pathogenic change in thin filament function that results in mutation-specific disease states. We can now provide atom-level insight that is potentially highly actionable in drug design.
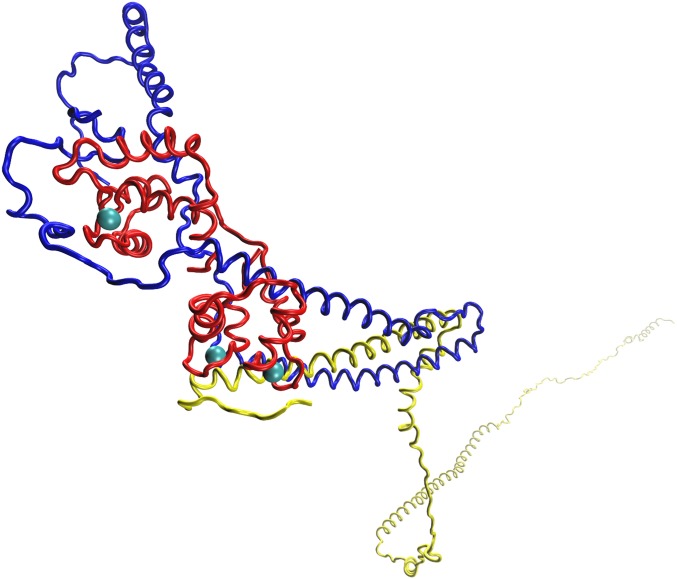
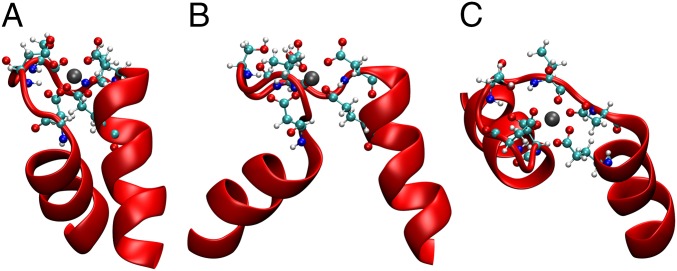
Cardiac contraction is regulated by the binding of Ca2+ to cardiac troponin C (cTnC) (1, 2) (Fig. 1). The Ca2+ binds in an EF-hand motif, consisting of two α-helices separated by a loop region containing seven coordinating oxygens that interact with the Ca2+, as seen in Fig. 2. Once Ca2+ is bound, interactions between cTnC and the switch peptide domain of cardiac troponin I (cTnI) cause conformational changes that reduce the ability of cTnI to bind to actin (3). When bound to actin, cTnI shifts the equilibrium location of cardiac tropomyosin (cTM) to a position that prevents the interaction of actin with myosin, thereby inhibiting the power stroke that drives contraction of cardiac muscle (4, 5). Thus, Ca2+ binding can be viewed as the initial step in a process that results in the eventual hydrolysis of ATP, with the sliding of the thin filament over the thick filament and the generation of mechanical work (5, 6). In disease states, changes in the ability of the cardiac muscle to be properly regulated by and to regulate Ca2+ are often observed and play a central role in pathogenic remodeling and sudden cardiac death (SCD) (7). What is not well understood is the proximal biophysical cause by which mutation affects function at the molecular level.
Fig. 1.
Troponin complex. The cTnT is represented in yellow, the cTnI is represented in blue, and the cTnC is represented in red. The Ca2+ is represented as the cyan spheres.
Fig. 2.
EF-hand Ca2+ binding pocket. (A) Ca2+ N-lobe binding pocket showing the EF-hand structure. The cTnC is represented in red. The Ca2+ is represented as a silver sphere. Coordinating residues are represented in a ball and stick design: Oxygens are represented as red spheres, nitrogens are represented as blue spheres, carbons are represented as cyan spheres, and hydrogens are represented as white spheres. (B) Rotation of previous 90°. (C) View of the binding pocket from directly above.
Due to both the size (over 300,000 atoms with a length greater than 80 nm) and the inherent flexibility of some portions of the cardiac thin filament (CTF), there is not a single experimental tool that is able to reveal the full structure. X-ray crystallography and NMR spectroscopy have been unable to resolve the more mobile regions on the atomistic scales (8–10). Fig. 3 illustrates our full atomistic CTF model that was constructed and implemented to allow us, for the first time to our knowledge, to follow these atomistic-level changes. Using computational methods, we will describe how these changes can be followed even when they occur on a time scale far longer than standard computational times.
Fig. 3.
Full atomistic CTF model. Actin is represented in gray and silver. Tropomyosin is represented in green and orange. The cTnT is represented in yellow, the cTnI is represented in blue, and the cTnC is represented in red. The Ca2+ is represented as the cyan spheres. The cTnT R92 mutation site and Ca2+ binding pocket are identified for location comparison.
Hypertrophic cardiomyopathy (HCM) is caused by mutations in sarcomere proteins and is the most common cardiac genetic disorder, affecting at least 1 in 500 individuals (11). It is a leading cause of SCD in young people (12). Many of the known mutations in proteins that comprise the regulatory thin filament disrupt intracellular Ca2+ homeostasis, having an impact on both cardiac function and SCD risk, forming the basis for current therapeutic interventions (13, 14). Independent gene mutations, even at a great distance from the Ca2+ binding domain in cTnC, can result in dramatically different phenotypes. These differences extend to the single-residue level; for example, substitutions at the same amino acid residue of cardiac troponin T (cTnT), Arg92Leu (R92L) and Arg92Trp (R92W), are phenotypically distinct in both patients and animal models (15). Despite extensive study, the biophysical mechanisms that underlie genotype-specific, clinically relevant distinction remain unclear, and limit the development of targeted therapies for this most common genetic cardiomyopathy.
Here, we report the application of our computational model to mutations that are predicted to affect Ca2+ dissociation. The N-terminus of cTnI can be found near the N-lobe binding site of cTnC. In particular, the cTnI Glu32 (E32) side chain is above the Ca2+ binding pocket. cTnI E32 contributes another coordinating oxygen site because the Glu has a negatively charged carboxylate that is able to interact with the positively charged Ca2+. As Ca2+ exits the binding pocket, the E32 can help to stabilize the ion in the pocket, therefore influencing the rate at which the Ca2+ is released. Our computations show that the R92L mutation causes an increased frequency of interaction between the Ca2+ and the cTnI E32, whereas the R92W mutation leads to limited interactions between the cTnI E32 and the Ca2+. Furthermore, there are almost no changes in the geometry of the EF-hand binding pocket, and so the differential binding strength of the Ca2+ to cTnC is not responsible for the changes observed experimentally in WT cTnT, R92L, and R92W complexes. The current results demonstrate the complexity of the “action at a distance” effect of mutations in a large, highly regulated multiprotein complex. Here, mutation in the cTnT protein alters the function of the cTnC protein via the indirect mediation of cTnI. This alteration occurs at a distance over 100 Å from the site of mutation and could not be discerned without an all-atom model. Such high-resolution mechanistic insight can be harnessed in the design of novel small-molecule therapeutics, an active subject of current efforts to move the treatment of this disorder from the merely palliative to cure (16).
Results
Construction of the Atomistic CTF Model.
The motivation for development of the model has been the work from our group and others showing that mutations cause complex effects, often at a significant distance from the site of amino acid replacement (17–20). The function of the thin filament as a regulatory agent relies on the ability of the individual protein components to interact dynamically in response to physiological demands. We thus created a full atomistic CTF model (Fig. 3) to study both structural and dynamic changes as a result of mutation. As has been shown in previous studies, mutations cause changes to both local and long-range interactions (17, 18, 20, 21). The long-range effects are difficult to discern when such complex systems are not studied in atomistic detail. This difficulty is especially true when fragments of the complex are used. Alterations in the Ca2+ dissociation rate from the cTnC binding pocket have been previously linked to HCM mutations (22). As such, we measured this parameter for the WT, R92L, and R92W substitutions in the fully reconstituted systems. Details of the model building are given in SI Materials and Methods.
Mutations Alter the Ca2+ Dissociation Rates.
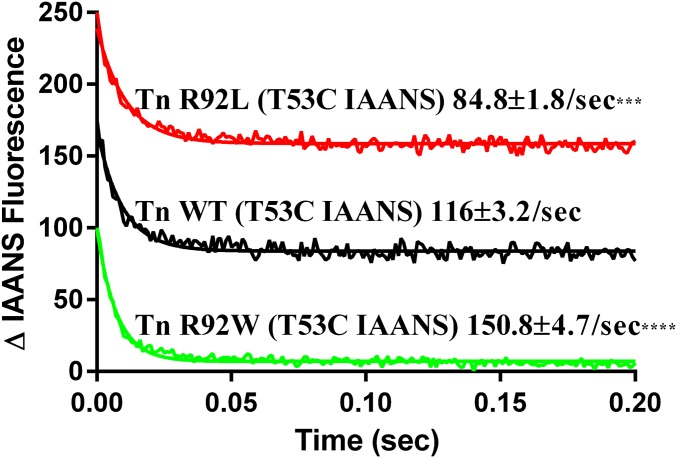
In vitro Ca2+ dissociation rates were measured for WT and mutant reconstituted CTFs using stopped-flow kinetics. The R92L and R92W mutations were introduced into human cTnT (hcTnT), and the E32A mutation was introduced into human cTnI (hcTnI), after which all were bacterially expressed and purified. Human cTnC (hcTnC) was mutated at site T53C, as shown in Fig. 1A; it was then bacterially expressed and purified, and then labeled with a thiol-reactive, environmentally sensitive fluorescent probe, 2-(4′(iodoacetamido)anilino)naphthalene-6-sulfonic acid (IAANS), at site T53C (hcTnC T53CIAANS). This probe on hcTnC allows for monitoring of conformational changes within the site II Ca2+ binding pocket of hcTnC in the presence and absence of Ca2+. Bacterially expressed human Ala-Ser cTM and hcTnI WT were purified, and skeletal muscle actin was harvested from rabbit muscle and further purified. The full thin filament was reconstituted (0.8 hcTn complexIAANS/1 cTM/7.5 filamentous actin) and dialyzed against working buffer containing 200 μM Ca2+. The Ca2+-bound thin filaments were rapidly mixed with a buffer containing EGTA, and the resulting change in fluorescence was detected. The data were fit with a single-exponential decay, and a dissociation rate (koff) was calculated.
In agreement with literature values (22), WT thin filaments (Tn WTT53C IAANS) resulted in a Ca2+ dissociation rate of 116 ± 3.3 s−1 (Fig. 4). Thin filaments containing the R92L mutation (Tn R92LT53C IAANS) resulted in a decrease in the Ca2+ dissociation rate, 84.8 ± 1.8 s−1 (Fig. 4), suggesting that Ca2+ release from the thin filament is more inhibited compared with WT thin filaments. In contrast, thin filaments containing the R92W mutation (Tn R92WT53C IAANS) resulted in an increase in the Ca2+ dissociation rate, 150.8 ± 4.7 s−1 (Fig. 4), compared with both WT and R92L. This increase in dissociation rate suggests that there is a decrease in inhibition of Ca2+ release at the level of the thin filament.
Fig. 4.
In vitro Ca2+ dissociation kinetics for reconstituted CTFs. The decrease in IAANS fluorescence was measured upon removal of Ca2+ from the thin filament via EGTA. Dissociation rates were calculated by fitting the decay curves with a single exponential decay. Decay curves were an average of three to five individual traces collected at least five times each. ***P < 0.001; ****P < 0.0001.
Ca2+ Coordination Strength Is Not Affected by Mutations.
Given the variation in the WT and two mutations in the Ca2+ off rate, we used our atomistic model to illuminate the molecular-level mechanism influencing Ca2+ dissociation. An initial reasonable hypothesis was that the mutation in cTnT creates the transmission of a structural effect to the N-lobe binding pocket of cTnC. Such effects at a distance have been noted before in simpler studies from our group and others (17, 18, 20, 21). To investigate this hypothesis, ensembles of 1-ns molecular dynamics (MD) simulations were produced, starting from the individual equilibrated structures. The seven coordinating oxygen-to-Ca2+ mean distances were calculated from 5-ps intervals. The ensemble mean distances were compared between the mutants and the WT. In the WT, a water molecule is intercalated into the space between the cTnC S69 and the Ca2+ during the equilibrium process. The water forms a hydrogen bond with the coordinating oxygen side chain, allowing the oxygen of the water to become the new coordination atom. In previous computational work (23, 24), similar effects were found, and there is a small change in coordinating distance; however, overall, none of these effects can be the cause of the variation in measured dissociation rates. Inspection of the trajectories showed that the N-lobe of the cTnC did have some overall movement, whereas the structure of the Ca2+ binding pocket remained stable. One MD simulation of each ensemble was allowed to continue to evolve in time for 5 ns to observe how the distances changed over a longer period.
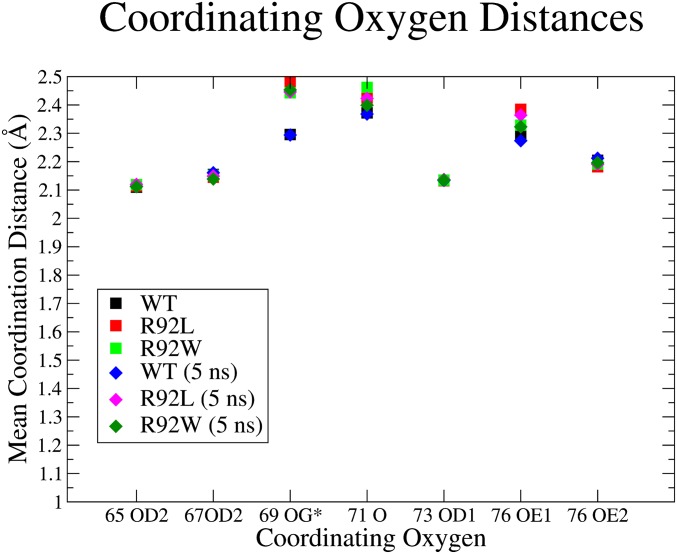
When comparing the ensemble averaged 1-ns trajectories with the 5-ns simulation of the individual models, the mean coordinating oxygen distances were almost identical. The largest change in the mean distance was for the cTnT 71 carboxyl oxygen of the R92W, which changed 0.063 Å (Table S1). When comparing the ensemble averaged coordinating oxygen distances of the WT and mutants, 75% of the mean values changed by less than 0.01 Å between WT and all of the mutants, as can be seen in Fig. 5.
Table S1.
Coordinating oxygen distances
| Model | Simulation | 65 OD2, Å | 67 OD2, Å | 69 OG,* Å | 71 O, Å | 73 OD1, Å | 76 OE1, Å | 76 OE2, Å |
| WT | Ensemble | 2.110 | 2.155 | 2.296 | 2.372 | 2.133 | 2.293 | 2.205 |
| 5 ns | 2.113 | 2.161 | 2.294 | 2.368 | 2.134 | 2.274 | 2.212 | |
| R92L | Ensemble | 2.114 | 2.145 | 2.480 | 2.425 | 2.133 | 2.385 | 2.182 |
| 5 ns | 2.120 | 2.149 | 2.446 | 2.423 | 2.137 | 2.364 | 2.192 | |
| R92W | Ensemble | 2.119 | 2.152 | 2.443 | 2.462 | 2.135 | 2.329 | 2.191 |
| 5 ns | 2.112 | 2.139 | 2.453 | 2.399 | 2.135 | 2.323 | 2.196 |
The mean coordinating oxygen distances for the N-lobe binding pocket. Delta oxygen 2 (OD2), gamma oxygen (OG), carbonyl oxygen (O), delta oxygen 1 (OD1), epsilon oxygen 1 (OE1), and epsilon oxygen 2 (OE2) refer to the position of the oxygen of the amino acid.
The 69 OG coordination for the WT and 5-ns WT is the distance of the TIP3P water oxygen.
Fig. 5.
Coordinating oxygen distances. The mean coordinating oxygen distances for the N-lobe binding pocket. The square points represent the ensemble average distance, and the diamond points represent the mean distance for the 5-ns simulations. Delta oxygen 2 (OD2), gamma oxygen (OG), carbonyl oxygen (O), delta oxygen 1 (OD1), epsilon oxygen 1 (OE1), and epsilon oxygen 2 (OE2) refer to the position of the oxygen of the amino acid. The 69 OG coordination for the WT and 5-ns WT is the distance of the transferable intermolecular potential 3 point model (TIP3P) water oxygen.
When comparing the individual mean coordinating oxygen distances results for the WT and R92 mutations, the ensemble mean distances varied by 0.2 Å at most (Fig. 5). The oxygen from the water molecule in the WT binding pocket was less than 0.2 Å closer to the Ca2+ than the cTnC S69 side chains of the R92 mutations, which can be explained by the hydrogen bond created by the bisecting water molecule decreasing the distance. All of the coordination oxygen distances were within the oxygen distances expected of such a complex, that is, a mean Ca2+-to-oxygen distance of 2.44 Å (25).
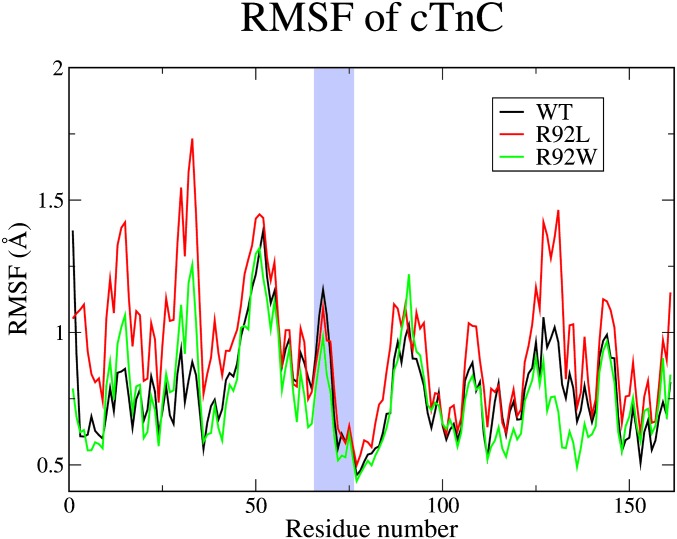
As shown in both Fig. 5 and Fig. S1, the coordinating oxygen-to-Ca2+ distances did not change significantly upon mutation; therefore, it is reasonable to assume that the effect on the rate of Ca2+ release is not due to the coordinating oxygens of the cTnC binding pocket and the strength to which they bind Ca2+. This result is complementary to similar work comparing the WT with the cTnI S23D/S24D double mutation (23) and the WT with the cTnI R145G mutation (24). However, with the full CTF model, we are able to investigate the effects of mutations that are not within the core region of cTn. The R92L and R92W cTnT mutations are over 100 Å away from the binding pocket, yet they are still able to cause differential Ca2+ release rates. Given the similarity of these structures, the physiological alterations caused by the R92L and R92W mutations would have to be caused by another physical/chemical feature of the CTF.
Fig. S1.
RMSF of cTnC for the 1-ns ensemble. The average RMSF of the cTnC during the coordinating oxygen distance calculation is shown. The black line represents the average RMSF for the WT, the red line represents the average RMSF for the R92L, and the green line represents the average RMSF for the R92W. The light blue region of the graph represents the loop section, where the residues of the coordinating oxygens are located in the N-lobe Ca2+ binding pocket.
Key Role of cTnI E32 in Ca2+ Dissociation.
To elucidate the mechanism for changes in the Ca2+ dissociation rate, we studied energetic barriers to removal of Ca2+ from the binding pocket. This event is rare, and so potentials of mean force calculations were implemented using steered molecular dynamics (SMD) (26, 27). We wished to eliminate the effects of water friction from this calculation, and so a previously described, bidirectional algorithm was used (28). The water molecules and ions in the solution add resistance and drag on the Ca2+, in the form of dissipative work in both the forward and reverse directions (28). The dissipative work could then be removed from the calculated work to isolate the barrier to removal of Ca2+.
The concept behind SMD is that a rare event at equilibrium may be simulated by applying an external force to the system such that a desired event occurs on computationally accessible time scales. In our case, the force is created by pulling on a pseudoatom that is attached to the Ca2+ with a pseudospring (27). The force that the spring feels is converted into work. The ensemble average work can be equated to the free energy through the application of Jarzynski’s equality (29).
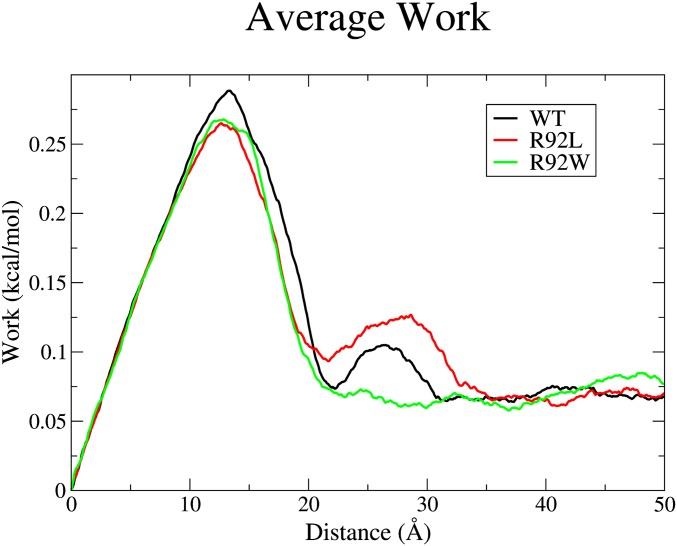
Table 1 shows that the calculated total free energy required to remove the Ca2+ completely from the binding pocket of the R92L mutation was larger than the calculated free energy of Ca2+ removal from the WT, whereas the R92W mutation had a smaller calculated free energy than the WT’s Ca2+ removal. However, the three systems had similar results for the work required to remove the Ca2+ only from the coordinating oxygens of the binding pocket, as shown in Fig. 6. The difference in the calculated work was due to the interaction of the Ca2+ and the E32 of cTnI. The negatively charged carboxylate side chain of the cTnI E32 was able to interact with the positively charged Ca2+ as it was pulled from the binding pocket. The R92 mutations altered the positioning of the N-terminus region of the cTnI. The E32 carboxylate of the R92L mutation was positioned closer to the direct center above the binding pocket, whereas the E32 carboxylate of the R92W mutation was positioned farther away from the direct center above the binding pocket (Fig. S2).
Table 1.
SMD calculated work: Total calculated forward and reverse work, free energy, and percentage of cTnI E32 interactions for the WT, R92L, and R92W from SMD
| Interaction parameters | WT, kcal/mol | cTnT R92L, kcal/mol | cTnT R92W, kcal/mol |
| 1,190.13 | 1,185.92 | 1,098.57 | |
| 1,047.07 | 1,025.77 | 983.27 | |
| 71.53 | 80.07 | 57.40 | |
| cTnI E32 interaction, % | 60 | 90 | 10 |
Fig. 6.
SMD calculated work. The calculated forward work at each step of the Ca2+ pulling is shown. The first peak is representative of the Ca2+ work to break free from the coordinating oxygens of the binding pocket, whereas the second peak is where the cTnI E32 oxygens interact with the Ca2+.
Fig. S2.
Binding pocket. A view of the N-lobe binding pocket perpendicular to the vector to which the Ca2+ was pulled out of the pocket during the SMD simulations is shown. The red represents the cTnC EF-hand motif of residues 54 through 86. The blue represents the cTnI residues 10 through 38. The silver sphere is the Ca2+. A view of the N-lobe binding pocket perpendicular to the vector to which the Ca2+ was pulled out of the pocket during the SMD simulations is shown. The red represents the cTnC EF-hand motif of residues 54 through 86. The blue represents the cTnI residues 10 through 38. The silver sphere is the Ca2+. The WT (A), the R92L (B), and the R92W (C) are shown.
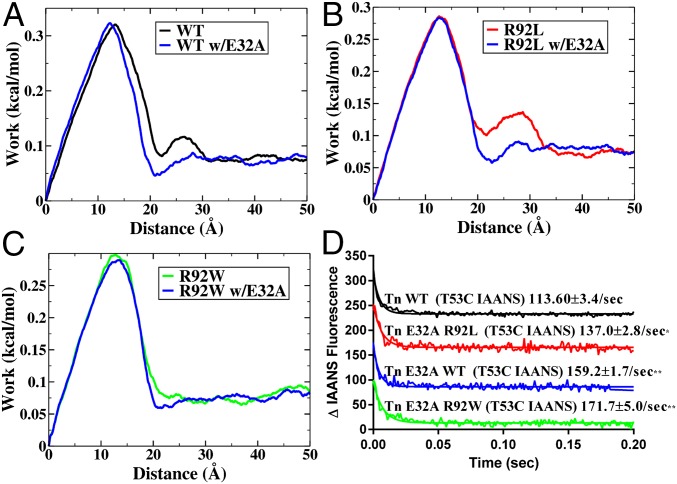
Our hypothesis that E32 of cTnI partially controls Ca2+ dissociation suggests an immediate test. Replacement of this residue with neutral Ala should increase the rate of dissociation for all species (mutant and WT), the overall rates should be more similar, and the rate of R92L with the E32A additional mutation should be roughly comparable to the dissociation in the single mutant R92W. Computations and experiments to test this hypothesis directly are shown in Fig. 7. Note that the substitution essentially abrogates the second Ca2+ interaction in the pulling computations. Any residual difference in rate is due to steric effects not sampled in the computation.
Fig. 7.
SMD (A–C) and dissociation kinetic (D) measurements for WT, R92L, and R92W cTnT with the further replacement of E32A. This mutation tests the hypothesis that E32 interaction with Ca2+ dominates the contribution to work in the 25-Å region of the SMD plots.
It should be noted that the free energy values obtained are not the exact free energy barriers to actual Ca2+ exit. Equality via the Jarzynski theorem only obtains in the limit of “slow” pulling of infinitely many realizations (27, 29). Using higher velocity “pulling” allows the generation of computational results in a finite time, but also leads to increased displacement of the spring. The method has been used before with similar results (30, 31). On the other hand, at a slower velocity, the force applied to the pseudoatom pulled the N-lobe of the cTnC along with the Ca2+. The pulling force would result in deformation of the N-lobe before the Ca2+ was released. We chose a velocity of the pulling force that was the slowest with which the deformation of the N-lobe was minimal.
Flexibility and Position of cTnI Relative to Ca2+ Binding.
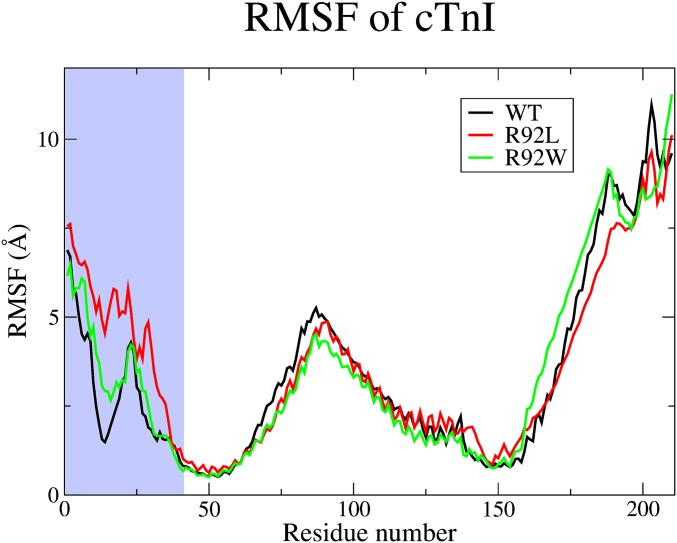
Given the empirical results obtained from the SMD calculations (i.e., that changes in apparent Ca2+ dissociation rates are caused by differential interactions with cTnI that, in turn, alter the free barrier to Ca2+ escape), we probed the atomic-level differences in this part of the complex to determine the root cause of this effect. First, we address the lower rate and higher free energy barrier found in the R92L mutation. We detected important changes in flexibility of the N-terminal region of cTnI induced by the cTnT mutation. The root mean square fluctuation (RMSF) of the cTnI (Fig. 8) and cTnC (Fig. S1) was calculated. The N-terminus end of the cTnI is largely unstructured until the start of an α-helix at residue 43, which leads to the region where α-helices from both the cTnI and cTnT interact (IT arm). Examination of the RMSF in the unstructured N-terminus region of cTnI shows significant differences for the R92L mutant compared with the WT and R92W complexes. The RMSF is both larger in magnitude and rising in the region around residues 10–25 for R92L compared with both WT and R92W. This change causes the N-terminal section of the protein to be more prone to follow the motion of the double-charged cation because of electrostatic forces, thus causing a greater probability of interaction.
Fig. 8.
RMSF of the cTnI for the 1-ns ensemble. The WT is shown in black, the R92L is shown in red, and the R92W is shown in green. The light blue region of the graph represents the N-terminus region. The N-terminus end contains the largest differing RMSF among the models.
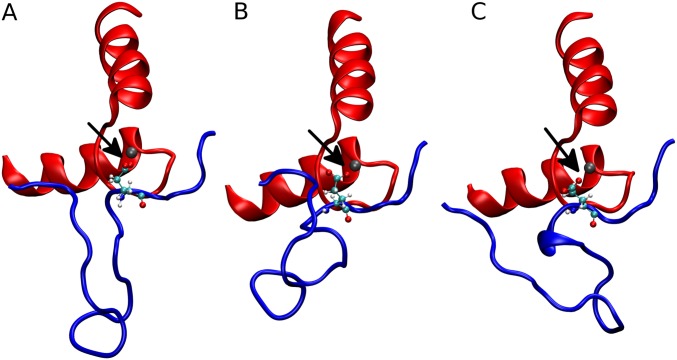
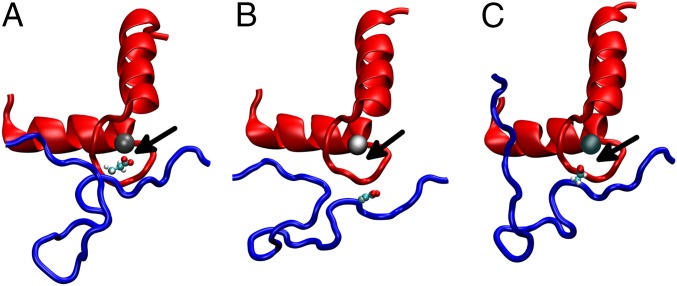
The R92W mutation has a slight increase in koff, and this increase is caused by a static structural mechanism. The N-terminus of the R92W mutation is slightly more mobile than the WT (Fig. 8), but the dominant effect shown in Fig. 9 is that the average position of the R92W compared with the WT is shown to shift, on average, away from the Ca2+ binding pocket. It does not have the flexibility of the R92L mutation, however, and so although the R92L mutant is shown in the static representation as being also located away from the binding pocket, due to the increased mobility, the region can sample more conformational space. One might ask what causes the static and dynamic structural changes. This answer is found in changes in the structure of the IT arm region of the complex. As shown in Fig. S3 and Table S2, both the angle between the helices and pseudodihedral angles of the same helices of cTnT change upon mutation of cTnT, and, in turn, this change is transmitted to the corresponding helices of cTnI. Fig. S4 shows representative results from SMD, demonstrating the differences in cTnI E32 Ca2+ association. This transmission of structural and dynamic information may be viewed as the converse of such information flow upon Ca2+ binding.
Fig. 9.
MD ensemble average structures of the 1-ns simulations. The view of the N-lobe binding pocket perpendicular to the vector from which the Ca2+ was pulled out of the pocket during the SMD simulations is shown. The red represents the cTnC EF-hand motif of residues 53 through 88. The blue represents the cTnI residues 12 through 38. The silver sphere is the Ca2+. The small red, cyan, and white spheres represent the oxygen, carbon, and hydrogen atoms of the cTnI E32 side chain, respectively. The black arrows point at the distance of the Ca2+ and the cTnI E32 side chain. WT (A), the R92L (B), and the R92W (C) are shown.
Fig. S3.
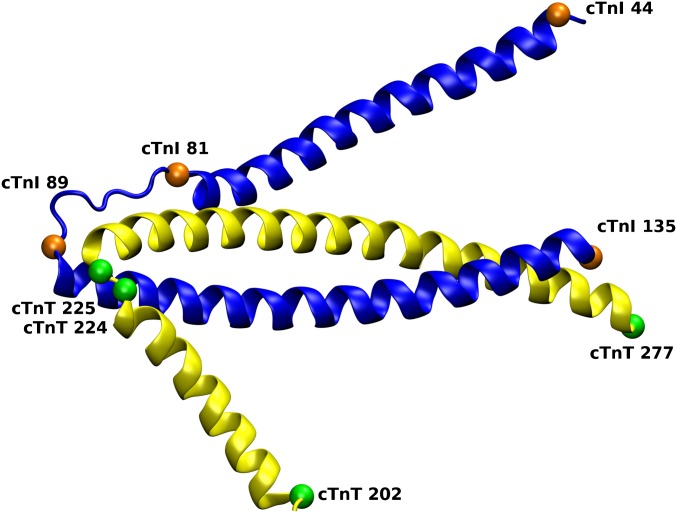
Region of the cTn complex of interest and the defined angle and pseudodihedral angle as described in Table S2. The gold balls represent the Cα of the listed residue for cTnI, and the green balls represent the Cα of the listed residue for cTnT. The coordinates of these atoms define the angles and pseudodihedral angles shown in Table S2.
Table S2.
Structural changes resulting from mutation in cTnT at position 92 as transmitted to the IT arm region of the complex
| Model | cTnI angle | cTnI dihedral angle | cTnT angle | cTnT dihedral angle |
| WT | 26.05° | −29.11° | 42.12° | −110.23° |
| R92L | 28.42° | 35.42° | 37.00° | −11.66° |
| R92W | 27.94° | −27.38° | 46.96° | −125.42° |
The angle created by the cTnT Cα values of residues 202, 225, and 277 and the dihedral angle created by residues 202, 224, 225, and 277 are shown.
Fig. S4.
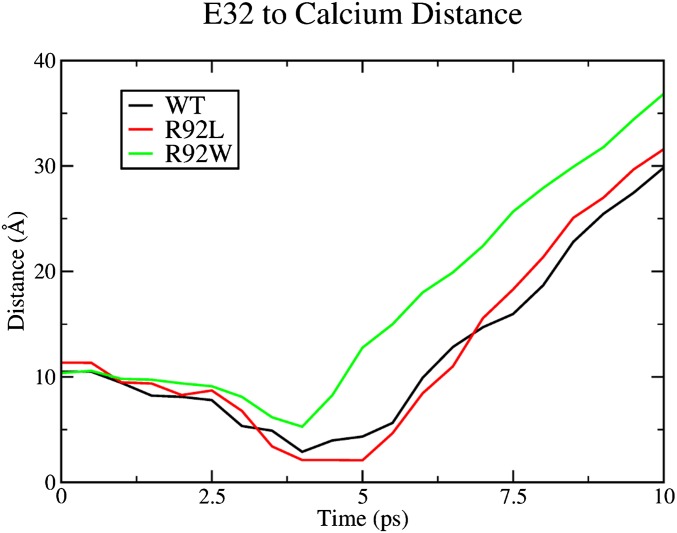
Representative results from SMD demonstrating the differences in cTnI E32 Ca2+ association.
SI Materials and Methods
CTF Model Building.
The full atomistic CTF model is an extension of our previously published model (39), now containing both atomistic actin and water. The model contains 29 F-actin subunits, two coiled-coil dimers of cTM, and the three-subunit cTn complex. The actin model is derived from a 16-subunit actin filament created from the F-actin structure of Oda et al. (9) by Lehman and coworkers (40). However, a 29-subunit filament is needed to wrap two sets of coiled-coils of cTM around actin without any overhang on the ends. To create the 29-unit actin and four chains of cTM of the model, a pair of cTM strands is first positioned in the closed position over a 15-unit actin filament (40). Copies of the cTM and actin files were made. Visual Molecular Dynamics 2.19 (VMD2.19) is used to align the first three actin units of the copy onto the last three actin units of the original file (41). The new coordinates of the copy were saved, and the 16th actin unit of the original file and the first and second actin units of newly aligned file are then deleted to create the 29-unit actin filament and four chains of cTM. In addition, we recognize that behavior in actual water is very different from behavior in gas-phase implicitly solvated water, and so atomistic water is added to the model. Due to the highly mobile nature of the overlap region, the structure has been difficult to obtain experimentally, and the structural understanding has evolved over time (42–46). Recent computational research has found a straighter overlap region with the same C- over N-terminus orientation but with an ∼90° rotation (45). This conformational change is not believed to affect our findings. The cTn complex is unchanged structurally from previous versions, but the crucial positioning of the core region on actin has been revised, given new experimental results (47). To move the cTn core domain and the overlap of the cTM, we used the PyMOL Molecular Graphics System (version 1.3r1). With PyMOL, the region that needs to be moved can be selected, and then moved by rotating around a central axis or translated as a whole. The core domain of the cTn was selected and moved closer to actin. The terminal ends of the cTM overlap were both moved and rotated to create the C-terminus splaying orientation.
The proteins were then docked using harmonic constraints (48). The harmonic force constraints are derived from the Protein Data Bank entries to predicted protein interfacial interactions (48). The constraints are NOE constraints with a harmonic force constant of the spring of 10.0 kcal/mol. The Cα values of actin are held in place with harmonic position constraints of 999 kcal/mol; these constraints allows the cTM to dock to the actin. The constraints are removed in stages until there are no constraints on the system to allow the proteins to simulate protein–protein interactions accurately. Chemistry at Harvard Macromolecular Mechanics (CHARMM) 33 with the CHARMM27 force-field parameters (49) were used to dock all of the proteins. The docking process uses the Generalized Born implicit solvation model with switching. The nonpolar surface tension coefficient is set to 0.005 kcal/(mol * Å2), the number of angular integration points is 50, the grid spacing is 1.5 Å, and the salt concentration is 0.15 M. The SHAKE algorithm is used to constrain the hydrogen atoms to the bond distances from the parameter files.
All models are then minimized to remove any steric clashes. Steepest decent minimization is run for 500 steps, and adopted basis Newton–Raphson minimization is then run for 4,500 steps. Both sets of minimization use the same settings of the initial step size of 0.005, the tolerance applied to the gradient of 0.0001, and the tolerance applied to the step size of 0.0001. Because minimization eliminates temperature in the system, the proteins then need to be heated to the low-temperature docking temperature of 70 K. The heating uses the velocity Verlet integrator. The heating process lasts 36 ps, during which the temperature is increased from 0 to 70 K by increasing the temperature 1 K every 500 fs, at 1-fs steps. The initial velocities are scaled to the temperature and are randomly selected.
Equilibration is implemented by running the MD simulation at 70 K with a stepwise decrease of the constraints. Step 1 used the harmonic force constraints set at 10 kcal/mol for 10,000 1-fs time steps. Steps 2 and 3 will also run for 10,000 1-fs time steps, but with the harmonic force constraints set to 5 kcal/mol and 2.0 kcal/mol, respectively. The final docking step is run for 50,000 1-fs time steps; however, the harmonic force constraints are turned off to allow the system to have freedom to move into position.
Mutations.
Once the low-temperature dock of the model is complete, the model can be mutated. The mutations are created with CHARMM33 in the same manner as we have previously reported (17). The three CTF models are then solvated using the Solvate feature of VMD1.92 (41). The boundary to which the water is not placed around the protein is set to 2.4 Å. The box size is set to be 15 Å away from the protein in all directions. The Autoionize feature of VMD1.92 is then used to place ions in the water box to neutralize and add solvent concentration. NaCl is used to create the 0.15 mol/L concentration. The resulting solvated CTF models number about 3.5 million atoms in total.
The three CTF models are then minimized for 5,000 steps using NAMD 2.9 with the CHARMM27 force-field parameters. Periodic boundary conditions were used with the cell size of the originally created box held fixed. The wrapAll feature was turned on. The particle mesh Ewald (PME) method of calculating long-range electrostatic interactions was used, whereas the Van der Waals interactions were cut off at 12 Å. The PME grid spacing was set to 1.0 Å, and the tolerance was set to 10−6. The SHAKE algorithm was used to constrain the hydrogen bond lengths with a tolerance of 1.0−8 Å. The CTF models were then heated to 300 K using NAMD 2.9 with the CHARMM27 force-field parameters. The heating was run for 310 ps because the temperature of the system was only 298 K when stopped at 300 ps. Once the heating process had reached 300 ps, the rescaling temperature was not increased beyond 300 K. The zeroMomentum function was used to remove the center-of-mass drift that the PME method can produce. The heated models were equilibrated in NAMD 2.9 along with the CHARMM27 force-field parameters for 690 ps in the canonical (NVT) ensemble. The time step of the simulation was set to 1 fs, and data were collected every 5 ps. The temperature was set to 300 K to scale the initial velocities created from the randomly generated number.
Coordinating Distances.
NAMD 2.9 was used along with the CHARMM27 force-field parameters to produce 1-ns MD simulations of the equilibrated structure of the full atomistic CTF model in the NVT ensemble. Three MD simulations were run for the WT, R92L, and R92W models. One of the simulations was continued for a total of 5 ns. The time step of the simulation was set to 1 fs, and data were collected every 5 ps.
VMD1.92 was used to visualize the trajectories created from the MD simulations. The N-lobe Ca2+ was located, along with all oxygen atoms within 3.5 Å throughout the MD simulations. The distances between the coordinating atoms were then plotted and averaged over each individual simulation. The SDs were also calculated. Each mean distance for the individual 1-ns ensembles for each of the models was then averaged together to produce an ensemble average coordinating distance.
RMSF.
Due to some translational motion of the cTnC, the trajectory was aligned to the equilibrium cTnC with the RMSD trajectory alignment function of VMD1.92. All nonhydrogen cTnC atoms were used for the alignment. Once aligned, the RMSF of the Cα for each residue was calculated using the RMSF calculation inside of the tkl council of VMD. The ensemble average was then calculated for the WT, R92L, and R92W for both the cTnI and cTnC.
SMD.
For the SMD simulations, the three full atomistic CTF models were reequilibrated from their 300-K heated structures in an isothermal-isobaric ensemble. The equilibration was done in a manner similar to the previous 300-K equilibration, except the Langevin piston was implemented to allow the volume of the water box to change to maintain a pressure of 1 atm. The wrapAll feature was turned on.
NAMD 2.9 was used along with the CHARMM27 force-field parameters to produce the 10-ps SMD simulations. Ten SMD simulations were run for each of the WT, R92L, and R92W models. The time step of the simulation was set to 1 fs, and data were collected every 500 fs. Periodic boundary positions were used with the Langevin piston, allowing the size of the box to change to maintain a pressure of 1 atm. The wrapAll feature was turned on. The SHAKE and PME settings were the same as in the Ca2+ binding distance MD simulation.
The SMD velocity of pulling was set to 0.005 Å⋅fs−1 and an SMD spring constant of 7.0 kcal/(mol * Å2). The vector direction along which we pull the Ca2+ out of the pocket was calculated for each of the models. The vector is perpendicular to two lines created when connecting the Cα values of coordinating residues of the binding pocket and centered at the crossing of the two. The two lines connect cTnC 67 to cTnC 71 and cTnC 69 to cTnC 73. The vector allows the Ca2+ to exit the binding pocket with consistent results.
Energy Calculation.
To calculate a potential of mean force, the work is calculated via the standard definition:
| [S1] |
where W is total work, k is the spring constant of the pseudospring, v is the velocity at which the pseudoatom is pulled, t is time, and F is the force that the spring feels. The ensemble average is calculated using the second cumulant expansion (26):
| [S2] |
where β is the inverse of the multiplication of the Boltzmann constant and temperature. Jarzynski’s equality can be used to equate the ensemble average of the calculated work to the free energy of Ca2+ release (26, 29):
| [S3] |
To calculate the reverse work, the Ca2+ was then pulled back into the binding pocket with SMD. The SMD was run in the same manner as previously, except that the vector of the pulling had to be recalculated. Because the beginning of the reverse work SMD simulation starts from the end of the forward work SMD simulation, all of the vectors for the individual simulations were different but calculated in the same manner as the vector to pull the Ca2+ out of the binding pocket. When the reverse work SMD simulations ran for 10 ps, the Ca2+ did not always reach the inside of the binding pocket. Because the reverse work needed to be calculated in which the Ca2+ returned into the binding pocket, the SMD simulations were run for 11 ps instead. VMD1.92 was then used to visualize when the Ca2+ entered the binding pocket, and the forces from the extra time steps that were not needed were not included in the reverse work calculation. The reverse work was then calculated with Eqs. S1 and S2. The dissipative work of the system was then eliminated with Eq. S4 (28):
| [S4] |
Eq. S4 gives the free energy of Ca2+ release without the dissipative work included.
In Vitro Thin Filament Reconstitution.
All chemicals were obtained from Sigma–Aldrich unless otherwise noted. Mutagenesis primers and IAANS were purchased from Invitrogen. The hcTnC, hcTnI, hcTnT, and cTM were encoded in individual pET-3D plasmids (Novagen). Site-directed mutagenesis (Agilent Quik-Change II XL) was used to introduce the TnC C35T, T53C, and C84T (denoted TnC T53C) and the hcTnT R92L and R92W into the vectors. Sequence alignment of the DNA was completed at a University of Arizona core facility to confirm incorporation of the mutations. hcTnC T53C, hcTnI WT, hcTnI E32A, and hcTM WT were transfected into Escherichia coli BL-21 cells (Novagen), whereas hcTnT WT, R92L, and R92W were transfected into Rosetta cells (Novagen). The proteins were expressed and purified as previously described (18). hcTnC T53C was labeled with fivefold excess thiol-reactive, environmentally sensitive probe IAANS as previously described (22), with slight modifications. The labeling reaction occurred for 3–5 h at room temperature before the reaction was stopped with 2 mM DTT and excess label was dialyzed out. A final label ratio between 80% and 90% was achieved. Troponin complexes were reconstituted in an 0.8:1.2:1.3 ratio (hcTnC T53CIAANS–hcTnI WT/E32A–hcTnT WT/R92L/R92W) through a series of stepwise buffer changes containing 30 mM 3-(N-morpholino)propanesulfonic acid (MOPS), 1.25 mM MgCl2, 1.25 mM CaCl2, and 1.5 mM DTT (pH 7.0) and the following: (i) 6 M urea plus 0.5 M KCl, (ii) 4 M urea plus 0.5 M KCl, (iii) 2 M urea plus 0.5 M KCl, (iv) 0 M urea plus 0.5 M KCl, and (v) 0 M urea plus 0.4 M KCl. cTM WT was purified through a series of acid/base cuts and ammonium sulfate cuts. Actin was purified from rabbit skeletal muscle as previously described (50), with slight modifications. After dialysis against 0.4% NaHCO3, the muscle was dialyzed against buffer containing 10 mM NaHCO3, 10 mM Na2CO3, and 0.1 mM Ca2+. The protocol was continued after this step. The purified actin acetone powder was converted into filamentous actin via a modified protocol (51). The actin acetone powder was extracted against buffer A containing 10 mM Tris, 0.2 mM CaCl2, 0.2 mM ATP, and 0.2 mM DTT (pH 8.0) for 20 min. After filtration and centrifugation, the supernatant was polymerized with 0.05 M KCL and 2 mM MgCl2 for 1 h at room temperature. Solid KCl was added to a final concentration of 0.6 M, and actin was kept at 4 °C with slow stirring for 1 h. The polymerized actin was then centrifuged at 19,800–27,000 × g for 7–8 h. After clarification, the actin was polymerized (F-actin) with 0.05 M KCL and 2 mM MgCl2 for 1 h at room temperature. Thin filaments were reconstituted in a ratio of 0.8:1.0:7.5 (Tn complex/Tm WT/F-actin) in buffer 4 above. The filaments were then dialyzed three times against a working buffer containing 10 mM MOPS, 0.15 M KCl, 1 mM DTT, 3 mM MgCl2, and 200 μM CaCl2 (pH 7.0) for 6–8 h.
Stopped Flow Experiments.
The thin filaments were diluted in working buffer to a final concentration of 0.15 µM. Each thin filament was loaded into a syringe on the Kintek Stopped Flow Rapid Mixing 2SD-1X instrument alongside a syringe containing working buffer solution plus 12 mM EGTA. Upon rapid mixing of the Ca2+-saturated thin filament and EGTA, a change in IAANS fluorescence was detected by the PTI Quanta-Master 40 and captured on a trace using FelixGX software. Mixing of the two solutions was first done every 10 s for six measurements to ensure no free TnC T53CIAANS contamination and then collected every 0.25 s. These steps were repeated for each thin filament. Data were analyzed and fit with a single exponential decay to obtain the resulting dissociation rate. One-way ANOVA was used to determine statistical significance, where a P value of <0.05 was considered significant.
Discussion
This paper reports the application of a newly developed atomistic model of the CTF to two cTnT mutations that exhibit differential effects on calcium homeostasis in vivo. The mutations are far from the site of calcium binding, and, in fact, our primary result is that complex allosteric interactions are responsible for the differences observed. The measured Ca2+ dissociation rates can be explained by the variation of the cTnI E32 interaction. If the WT results are used as the benchmark, the increased Ca2+ dissociation rate of the R92W can be explained by the weaker interaction of the Ca2+ and the cTnI, which is, in turn, explained by cTnI displacement to the outer edge of the binding pocket. The decreased Ca2+ dissociation rate of the R92L can be explained by the increased interaction of the Ca2+ and cTnI. The RMSF of the N-terminus region of the cTnI demonstrates the location and manner of how and where the mutations are altering interactions of the WT. This alteration is in a location that is relevant to the Ca2+ binding pocket and the release of Ca2+, even though the mutations occur over 100 Å away. Whereas the in vitro Ca2+ dissociation rate experiment gave numerical values to the effects of the mutations, the atomistic model illuminated the mechanism by which the mutations cause the observed effects on Ca2+ dynamics.
The computational results give insight into the function of cTnC. In simulation production runs, the Ca2+ distances from the coordinating oxygens remained constant throughout the dynamics. Similarly, the SMD experiment showed that the same work was needed to remove the Ca2+ from the binding pocket in the WT and the mutants. We and others have previously shown that mutations can have long-range effects on the CTF (17, 18, 20, 21, 32, 33). These results demonstrate both the challenge and promise of molecular intervention in such genetic alterations. The effect that causes dysfunction is found remote from the site of mutation. It is important to note that the development of targeted therapeutics is strongly advanced by the development and application of this model. In complex machines, such as the sarcomere, the strong binding of agents is not the only goal; one needs to have a target for the binding. Without the type of work presented in this paper, one would never know how a mutation in cTnT affects the function of cTnC, and the therapeutic options available would remain the same calcium-channel blocking agents used for 50 years. We now have the potential to begin to target the actual molecular-level insult to sarcomeric function.
It is important to note that one of the most confounding issues in the management of human genetic cardiomyopathies is the inability to use genotype to either inform or prognosticate clinical phenotype [recently reviewed by van der Velden et al. (16)]. This significant limitation persists despite 20 years of concerted efforts by many groups. It has been argued that HCM is the most “biophysical” of disorders, with mutations occurring in proteins with known physiological roles and extensive functional data. The thin filament, in particular, is an experimentally “tractable” system; thus, significant advances have been made regarding molecular mechanism (reviewed in 5). More recently, however, it has become clear that the widely used steady-state and biochemical approaches do not fully differentiate between the known clinical phenotypes, suggesting that further, high-resolution approaches are needed to provide mechanistic insight. The two human cTnT mutations studied here are representative of this issue. The R92W and R92L cTnT missense mutations cause dissimilar patterns of ventricular remodeling in mice and men (21, 34, 35). In animal models, they also exhibit marked mutation-specific effects on Ca2+ homeostasis and myocyte energetics despite near-identical effects on the Ca2+ sensitivity of force generation (36, 37). The results we describe here, for the first time to our knowledge, provide the level of molecular biophysical understanding required to develop a robust mechanistic paradigm for the differential phenotypes observed in the human disorder. Moreover, given that any thin filament mutation can be tested in a rigorous, high-throughput manner using these computational models, it is highly likely that they can eventually be incorporated into existing predictive HCM algorithms, and thus greatly extend the biophysical quality of these approaches.
Materials and Methods
Detailed materials and methods are provided in SI Materials and Methods, including the CTF model building methodology, mutation models, MD and SMD settings, coordinating oxygen distance calculation, RMSF calculations, energy calculations, in vitro CTF reconstruction, and stopped-flow kinetics techniques.
Neither our experimental model nor our computational model includes myosin. Thus, there is no chemical reaction of ATP hydrolysis, and this level of control is simply not present. Although the physiological role of myosin heads in cardiac relaxation is an important factor, the measurement of Ca2+ dissociation rates in the presence of S1 heads is challenging. Previous groups have measured the calcium dissociation rates in reconstituted thin filaments plus myosin S1 heads (23, 38) and reported rates that are similar to the rate of cardiac relaxation (∼15 s−1). However, each of these systems has notable limitations. For example, the binding of S1 heads to the reconstituted thin filament is not regulated due to the lack of an organized thick filament, and thus cannot account for specific binding sites. Additionally, within the I-band of the cardiac sarcomere, the thin and thick filaments do not overlap, and thus represent a region that is governed by the calcium release rate of the thin filament alone. Furthermore, there are only two possible states in these experiments: myosin-bound and myosin-unbound. Calcium cycling plays a role in the equilibrium between unbound and weakly bound myosin; thus, the effects of altered dissociation rates in this transition may be overlooked. Because we cannot directly account for these different possibilities in either the in vitro measurements or our computational model, we have chosen to focus on the thin filament alone.
Acknowledgments
We thank Mark McConnell (University of Arizona) for development of the analysis program for the stopped-flow kinetics. This research was financially supported by NIH Grant R01 HL107046 (to J.C.T. and S.D.S.). M.R.W. was supported via Training Grant GM084905 and S.J.L. received support from Grant T32 HL007249. J.C.T. acknowledges the support of the Steven M. Gootter Foundation.
Footnotes
The authors declare no conflict of interest.
This article is a PNAS Direct Submission.
This article contains supporting information online at www.pnas.org/lookup/suppl/doi:10.1073/pnas.1519541113/-/DCSupplemental.
References
- 1.Tobacman LS. Thin filament-mediated regulation of cardiac contraction. Annu Rev Physiol. 1996;58:447–481. doi: 10.1146/annurev.ph.58.030196.002311. [DOI] [PubMed] [Google Scholar]
- 2.Kobayashi T, Solaro RJ. Calcium, thin filaments, and the integrative biology of cardiac contractility. Annu Rev Physiol. 2005;67:39–67. doi: 10.1146/annurev.physiol.67.040403.114025. [DOI] [PubMed] [Google Scholar]
- 3.Galińska A, et al. The C terminus of cardiac troponin I stabilizes the Ca2+-activated state of tropomyosin on actin filaments. Circ Res. 2010;106(4):705–711. doi: 10.1161/CIRCRESAHA.109.210047. [DOI] [PMC free article] [PubMed] [Google Scholar]
- 4.Poole KJV, et al. A comparison of muscle thin filament models obtained from electron microscopy reconstructions and low-angle X-ray fibre diagrams from non-overlap muscle. J Struct Biol. 2006;155(2):273–284. doi: 10.1016/j.jsb.2006.02.020. [DOI] [PubMed] [Google Scholar]
- 5.McKillop DFA, Geeves MA. Regulation of the interaction between actin and myosin subfragment 1: Evidence for three states of the thin filament. Biophys J. 1993;65(2):693–701. doi: 10.1016/S0006-3495(93)81110-X. [DOI] [PMC free article] [PubMed] [Google Scholar]
- 6.Gordon AM, Regnier M, Homsher E. Skeletal and cardiac muscle contractile activation: Tropomyosin “rocks and rolls”. News Physiol Sci. 2001;16:49–55. [PubMed] [Google Scholar]
- 7.Fatkin D, Graham RM. Molecular mechanisms of inherited cardiomyopathies. Physiol Rev. 2002;82(4):945–980. doi: 10.1152/physrev.00012.2002. [DOI] [PubMed] [Google Scholar]
- 8.Takeda S, Yamashita A, Maeda K, Maéda Y. Structure of the core domain of human cardiac troponin in the Ca(2+)-saturated form. Nature. 2003;424(6944):35–41. doi: 10.1038/nature01780. [DOI] [PubMed] [Google Scholar]
- 9.Oda T, Iwasa M, Aihara T, Maéda Y, Narita A. The nature of the globular- to fibrous-actin transition. Nature. 2009;457(7228):441–445. doi: 10.1038/nature07685. [DOI] [PubMed] [Google Scholar]
- 10.Li XE, et al. Tropomyosin position on F-actin revealed by EM reconstruction and computational chemistry. Biophys J. 2011;100(4):1005–1013. doi: 10.1016/j.bpj.2010.12.3697. [DOI] [PMC free article] [PubMed] [Google Scholar]
- 11.Maron BJ, et al. Prevalence of hypertrophic cardiomyopathy in a general population of young adults. Echocardiographic analysis of 4111 subjects in the CARDIA Study. Coronary Artery Risk Development in (Young) Adults. Circulation. 1995;92(4):785–789. doi: 10.1161/01.cir.92.4.785. [DOI] [PubMed] [Google Scholar]
- 12.Maron BJ. Triggers for sudden cardiac death in the athlete. Cardiol Clin. 1996;14(2):195–210. doi: 10.1016/s0733-8651(05)70273-3. [DOI] [PubMed] [Google Scholar]
- 13.Ho CY, et al. Diltiazem treatment for pre-clinical hypertrophic cardiomyopathy sarcomere mutation carriers: A pilot randomized trial to modify disease expression. JACC Heart Fail. 2015;3(2):180–188. doi: 10.1016/j.jchf.2014.08.003. [DOI] [PMC free article] [PubMed] [Google Scholar]
- 14.Guinto PJ, Haim TE, Dowell-Martino CC, Sibinga N, Tardiff JC. Temporal and mutation-specific alterations in Ca2+ homeostasis differentially determine the progression of cTnT-related cardiomyopathies in murine models. Am J Physiol Heart Circ Physiol. 2009;297(2):H614–H626. doi: 10.1152/ajpheart.01143.2008. [DOI] [PMC free article] [PubMed] [Google Scholar]
- 15.Tardiff JC. Thin filament mutations: Developing an integrative approach to a complex disorder. Circ Res. 2011;108(6):765–782. doi: 10.1161/CIRCRESAHA.110.224170. [DOI] [PMC free article] [PubMed] [Google Scholar]
- 16.van der Velden J, et al. Research priorities in sarcomeric cardiomyopathies. Cardiovasc Res. 2015;105(4):449–456. doi: 10.1093/cvr/cvv019. [DOI] [PMC free article] [PubMed] [Google Scholar]
- 17.Manning EP, Tardiff JC, Schwartz SD. Molecular effects of familial hypertrophic cardiomyopathy-related mutations in the TNT1 domain of cTnT. J Mol Biol. 2012;421(1):54–66. doi: 10.1016/j.jmb.2012.05.008. [DOI] [PMC free article] [PubMed] [Google Scholar]
- 18.Manning EP, Guinto PJ, Tardiff JC. Correlation of molecular and functional effects of mutations in cardiac troponin T linked to familial hypertrophic cardiomyopathy: An integrative in silico/in vitro approach. J Biol Chem. 2012;287(18):14515–14523. doi: 10.1074/jbc.M111.257436. [DOI] [PMC free article] [PubMed] [Google Scholar]
- 19.Janco M, et al. Polymorphism in tropomyosin structure and function. J Muscle Res Cell Motil. 2013;34(3-4):177–187. doi: 10.1007/s10974-013-9353-x. [DOI] [PMC free article] [PubMed] [Google Scholar]
- 20.Guinto PJ, Manning EP, Schwartz SD, Tardiff JC. Computational characterization of mutations in cardiac troponin T known to cause familial hypertrophic cardiomyopathy. J Theor Comput Chem. 2007;6(3):413. doi: 10.1142/S0219633607003271. [DOI] [PMC free article] [PubMed] [Google Scholar]
- 21.Ertz-Berger BR, et al. Changes in the chemical and dynamic properties of cardiac troponin T cause discrete cardiomyopathies in transgenic mice. Proc Natl Acad Sci USA. 2005;102(50):18219–18224. doi: 10.1073/pnas.0509181102. [DOI] [PMC free article] [PubMed] [Google Scholar]
- 22.Davis JP, et al. Effects of thin and thick filament proteins on calcium binding and exchange with cardiac troponin C. Biophys J. 2007;92(9):3195–3206. doi: 10.1529/biophysj.106.095406. [DOI] [PMC free article] [PubMed] [Google Scholar]
- 23.Cheng Y, et al. Computational studies of the effect of the S23D/S24D troponin I mutation on cardiac troponin structural dynamics. Biophys J. 2014;107(7):1675–1685. doi: 10.1016/j.bpj.2014.08.008. [DOI] [PMC free article] [PubMed] [Google Scholar]
- 24.Lindert S, Cheng Y, Kekenes-Huskey P, Regnier M, McCammon JA. Effects of HCM cTnI mutation R145G on troponin structure and modulation by PKA phosphorylation elucidated by molecular dynamics simulations. Biophys J. 2015;108(2):395–407. doi: 10.1016/j.bpj.2014.11.3461. [DOI] [PMC free article] [PubMed] [Google Scholar]
- 25.Zheng H, Chruszcz M, Lasota P, Lebioda L, Minor W. Data mining of metal ion environments present in protein structures. J Inorg Biochem. 2008;102(9):1765–1776. doi: 10.1016/j.jinorgbio.2008.05.006. [DOI] [PMC free article] [PubMed] [Google Scholar]
- 26.Park S, Schulten K. Calculating potentials of mean force from steered molecular dynamics simulations. J Chem Phys. 2004;120(13):5946–5961. doi: 10.1063/1.1651473. [DOI] [PubMed] [Google Scholar]
- 27.Park S, Khalili-Araghi F, Tajkhorshid E, Schulten K. Free energy calculation from steered molecular dynamics simulations using Jarznski’s equality. J Chem Phys. 2003;119(6):3559–3566. [Google Scholar]
- 28.Nategholeslam M, Gray CG, Tomberli B. Implementation of the forward-reverse method for calculating the potential of mean force using a dynamic restraining protocol. J Phys Chem B. 2014;118(49):14203–14214. doi: 10.1021/jp504942t. [DOI] [PubMed] [Google Scholar]
- 29.Jarzynski C. Nonequilibrium equality for free energy differences. Phys Rev Lett. 1997;78(14):2690–2693. [Google Scholar]
- 30.Gao M, Wilmanns M, Schulten K. Steered molecular dynamics studies of titin I1 domain unfolding. Biophys J. 2002;83(6):3435–3445. doi: 10.1016/S0006-3495(02)75343-5. [DOI] [PMC free article] [PubMed] [Google Scholar]
- 31.Gao M, Lu H, Schulten K. Unfolding of titin domains studied by molecular dynamics simulations. J Muscle Res Cell Motil. 2002;23(5-6):513–521. doi: 10.1023/a:1023466608163. [DOI] [PubMed] [Google Scholar]
- 32.Jin JP, Root DD. Modulation of troponin T molecular conformation and flexibility by metal ion binding to the NH2-terminal variable region. Biochemistry. 2000;39(38):11702–11713. doi: 10.1021/bi9927437. [DOI] [PubMed] [Google Scholar]
- 33.Kowlessur D, Tobacman LS. Troponin regulatory function and dynamics revealed by H/D exchange-mass spectrometry. J Biol Chem. 2010;285(4):2686–2694. doi: 10.1074/jbc.M109.062349. [DOI] [PMC free article] [PubMed] [Google Scholar]
- 34.Forissier JF, et al. Codon 102 of the cardiac troponin T gene is a putative hot spot for mutations in familial hypertrophic cardiomyopathy. Circulation. 1996;94(12):3069–3073. doi: 10.1161/01.cir.94.12.3069. [DOI] [PubMed] [Google Scholar]
- 35.Heradien M, et al. Abnormal blood pressure response to exercise occurs more frequently in hypertrophic cardiomyopathy patients with the R92W troponin T mutation than in those with myosin mutations. Heart Rhythm. 2009;6(11) Suppl:S18–S24. doi: 10.1016/j.hrthm.2009.07.020. [DOI] [PMC free article] [PubMed] [Google Scholar]
- 36.Chandra M, Tschirgi ML, Tardiff JC. Increase in tension-dependent ATP consumption induced by cardiac troponin T mutation. Am J Physiol Heart Circ Physiol. 2005;289(5):H2112–H2119. doi: 10.1152/ajpheart.00571.2005. [DOI] [PubMed] [Google Scholar]
- 37.He H, Javadpour MM, Latif F, Tardiff JC, Ingwall JS. R-92L and R-92W mutations in cardiac troponin T lead to distinct energetic phenotypes in intact mouse hearts. Biophys J. 2007;93(5):1834–1844. doi: 10.1529/biophysj.107.107557. [DOI] [PMC free article] [PubMed] [Google Scholar]
- 38.Tikunova SB, et al. Effect of calcium-sensitizing mutations on calcium binding and exchange with troponin C in increasingly complex biochemical systems. Biochemistry. 2010;49(9):1975–1984. doi: 10.1021/bi901867s. [DOI] [PMC free article] [PubMed] [Google Scholar]
- 39.Manning EP, Tardiff JC, Schwartz SD. A model of calcium activation of the cardiac thin filament. Biochemistry. 2011;50(34):7405–7413. doi: 10.1021/bi200506k. [DOI] [PMC free article] [PubMed] [Google Scholar]
- 40.Li XE, Orzechowski M, Lehman W, Fischer S. Structure and flexibility of the tropomyosin overlap junction. Biochem Biophys Res Commun. 2014;446(1):304–308. doi: 10.1016/j.bbrc.2014.02.097. [DOI] [PMC free article] [PubMed] [Google Scholar]
- 41.Humphrey W, Dalke A, Schulten K. VMD: Visual molecular dynamics. J Mol Graph. 1996;14(1):33–38, 27–28. doi: 10.1016/0263-7855(96)00018-5. [DOI] [PubMed] [Google Scholar]
- 42.Palm T, Graboski S, Hitchcock-DeGregori SE, Greenfield NJ. Disease-causing mutations in cardiac troponin T: Identification of a critical tropomyosin-binding region. Biophys J. 2001;81(5):2827–2837. doi: 10.1016/S0006-3495(01)75924-3. [DOI] [PMC free article] [PubMed] [Google Scholar]
- 43.Murakami K, et al. Structural basis for tropomyosin overlap in thin (actin) filaments and the generation of a molecular swivel by troponin-T. Proc Natl Acad Sci USA. 2008;105(20):7200–7205. doi: 10.1073/pnas.0801950105. [DOI] [PMC free article] [PubMed] [Google Scholar]
- 44.Lehman W, Li XE, Orzechowski M, Fischer S. The structural dynamics of α-tropomyosin on F-actin shape the overlap complex between adjacent tropomyosin molecules. Arch Biochem Biophys. 2014;552-553:68–73. doi: 10.1016/j.abb.2013.09.011. [DOI] [PMC free article] [PubMed] [Google Scholar]
- 45.Orzechowski M, Li XE, Fischer S, Lehman W. An atomic model of the tropomyosin cable on F-actin. Biophys J. 2014;107(3):694–699. doi: 10.1016/j.bpj.2014.06.034. [DOI] [PMC free article] [PubMed] [Google Scholar]
- 46.Greenfield NJ, Kotlyanskaya L, Hitchcock-DeGregori SE. Structure of the N terminus of a nonmuscle alpha-tropomyosin in complex with the C terminus: Implications for actin binding. Biochemistry. 2009;48(6):1272–1283. doi: 10.1021/bi801861k. [DOI] [PMC free article] [PubMed] [Google Scholar]
- 47.Yang S, et al. Three-dimensional organization of troponin on cardiac muscle thin filaments in the relaxed state. Biophys J. 2014;106(4):855–864. doi: 10.1016/j.bpj.2014.01.007. [DOI] [PMC free article] [PubMed] [Google Scholar]
- 48.Laskowski RA. PDBsum new things. Nucleic Acids Res. 2009;37(Database issue):D355–D359. doi: 10.1093/nar/gkn860. [DOI] [PMC free article] [PubMed] [Google Scholar]
- 49.MacKerell AD, Jr, Banavali N, Foloppe N. Development and current status of the CHARMM force field for nucleic acids. Biopolymers. 2000-2001;56(4):257–265. doi: 10.1002/1097-0282(2000)56:4<257::AID-BIP10029>3.0.CO;2-W. [DOI] [PubMed] [Google Scholar]
- 50.Bíró EN, Venyaminov SY. Depolymerization of actin in concentrated solutions of divalent metal chlorides. Acta Biochim Biophys Acad Sci Hung. 1979;14(1-2):31–42. [PubMed] [Google Scholar]
- 51.Pardee JD, Spudich JA. Purification of muscle actin. Methods Cell Biol. 1982;24:271–289. doi: 10.1016/s0091-679x(08)60661-5. [DOI] [PubMed] [Google Scholar]


