Significance
In Escherichia coli, chemoreceptors, the histidine kinase CheA, and the adaptor protein CheW form a highly networked chemotaxis signaling array that clusters at the cell poles. Arrayed chemoreceptors control multiple CheA molecules in highly cooperative responses to chemoeffector ligands, but the molecular interactions responsible for this behavior are unknown. We found that lesions affecting the interface 2 interaction between CheW and the P5 domain of CheA caused severe array clustering defects and abolished response cooperativity, demonstrating that along with its critical structural role, interface 2 is the route for transmitting signaling-related conformational changes throughout the array. It should be possible to exploit interface 2 mutants to develop more incisive experimental approaches and theoretical models for investigating the signaling mechanisms of chemosensory arrays.
Keywords: chemotaxis, chemoreceptors, kinase activity, stimulus response
Abstract
The Escherichia coli chemosensory system consists of large arrays of transmembrane chemoreceptors associated with a dedicated histidine kinase, CheA, and a linker protein, CheW, that couples CheA activity to receptor control. The kinase activity responses to receptor ligand occupancy changes can be highly cooperative, reflecting allosteric coupling of multiple CheA and receptor molecules. Recent structural and functional studies have led to a working model in which receptor core complexes, the minimal units of signaling, are linked into hexagonal arrays through a unique interface 2 interaction between CheW and the P5 domain of CheA. To test this array model, we constructed and characterized CheA and CheW mutants with amino acid replacements at key interface 2 residues. The mutant proteins proved defective in interface 2-specific in vivo cross-linking assays, and formed signaling complexes that were dispersed around the cell membrane rather than clustered at the cell poles as in wild type chemosensory arrays. Interface 2 mutants down-regulated CheA activity in response to attractant stimuli in vivo, but with much less cooperativity than the wild type. Moreover, mutant cells containing fluorophore-tagged receptors exhibited greater basal anisotropy that changed rapidly in response to attractant stimuli, consistent with facile changes in loosely packed receptors. We conclude that interface 2 lesions disrupt important network connections between core complexes, preventing receptors from operating in large, allosteric teams. This work confirms the critical role of interface 2 in organizing the chemosensory array, in directing the clustered array to the cell poles, and in producing its highly cooperative signaling properties.
Escherichia coli detects and follows environmental gradients of attractant chemicals using a large assembly of transmembrane chemoreceptor proteins, the histidine autokinase CheA, and a small adaptor protein, CheW. These signaling proteins cluster, typically at the cell pole(s), in ordered, supramolecular arrays that amplify small chemoeffector concentration changes into large internal signals that govern rotation of the cell’s flagellar motors.
In response to changes in ligand occupancy, the chemosensors, also known as methyl-accepting chemotaxis proteins (MCPs), modulate CheA activity to control the flux of CheA-generated phosphoryl groups to the response regulator CheY, whose phosphorylated form triggers motor reversals and random changes in swimming direction. Attractant stimuli inhibit CheA autophosphorylation, thereby suppressing turns and promoting up-gradient travel. The CheZ phosphatase actively dephosphorylates P-CheY, ensuring rapid stimulus responses. A sensory adaptation system tunes the detection sensitivity of MCP molecules to ambient chemical conditions through reversible covalent modifications catalyzed by the CheR methyltransferase and the CheB methylesterase, enabling the cells to sense chemoeffector changes over a wide concentration range (1).
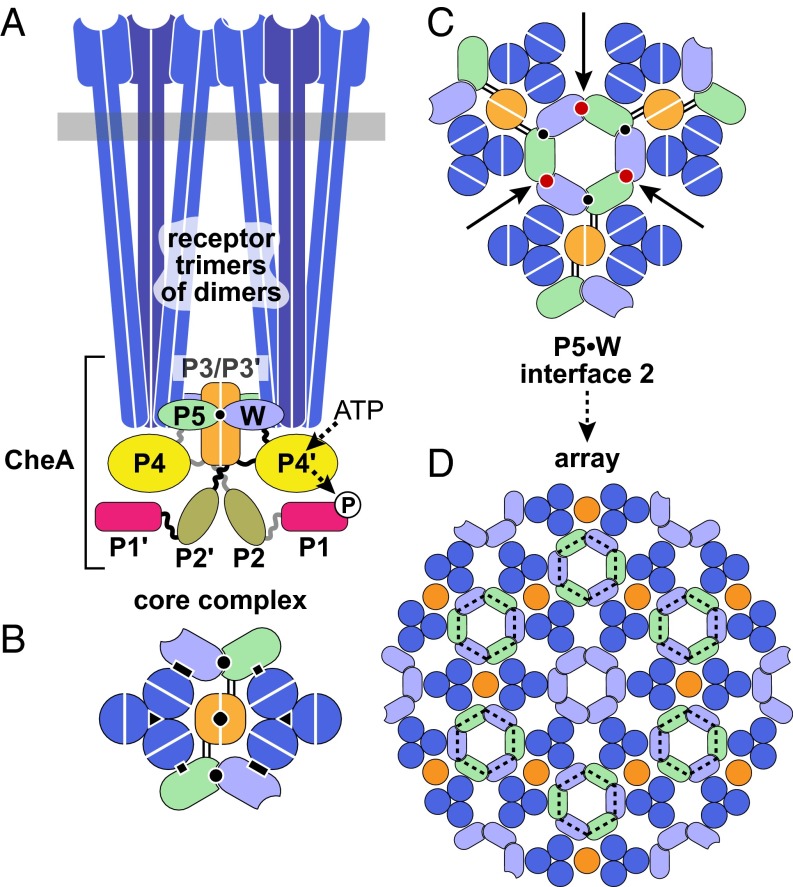
Core complexes, the smallest units of signaling function in receptor arrays, contain six homodimeric MCP molecules, organized as trimers of dimers (Fig. 1A) (2). Each receptor trimer binds to a CheW monomer and to one subunit of the dimeric CheA molecule through its P5 domains (Fig. 1B). The CheA dimerization domains (P3/P3′) lie between the cytoplasmic tips of the two receptor trimers and may play roles in transmitting receptor signals to the CheA autophosphorylation domains P4 (ATP binding) and P1 (phosphorylation site) (Fig. 1A). Core signaling complexes in membrane nanodiscs down-regulate CheA activity in response to attractant ligands, but with little positive cooperativity (Hill coefficients <2) (3). In contrast, kinase activity responses of intact cells to chemoeffector stimuli exhibit high positive cooperativity (e.g., Hill coefficients of 15–20 for the serine chemoreceptor Tsr) (4). These high Hill coefficients are consistent with allosteric coupling interactions between multiple core complexes in the receptor array. This cooperative behavior underlies the extraordinary signaling properties of the chemotaxis system, including signal amplification and enhanced detection sensitivity (5). Although quantitative signaling models can explain many of the experimental observations (6), the molecular mechanisms of cooperative signaling between receptor core complexes remain unknown.
Fig. 1.
Structural organization of chemoreceptor arrays. (A) The core signaling complex, the minimal functional unit of the array, consists of two receptor trimer-of-dimers, a CheA kinase dimer, and two CheW molecules (W). Trimers can contain receptor dimers with different detection specificities that associate through interactions of conserved residues at the receptor tip. Each CheA monomer comprises five distinct domains: P1 (phospho-accepting), P2 (CheY and CheB binding), P3 (dimerization), P4 (ATP binding), and P5 (receptor-mediated kinase activity control). P5 and CheW interact with the receptor tip and with each other. (B) Cross-section through the receptor tip and CheA/CheW baseplate, viewed from the cytoplasmic membrane. Critical protein–protein interfaces responsible for core complex assembly and function are indicated with black symbols: P5–receptor (squares), CheW–receptor (rectangles), trimer contacts (triangles), P3–P3′ (diamond), and P5 subdomain 2–CheW subdomain 1 (also known as interface 1; circle). Parallel lines between the P5 and the P3 domains indicate the linkers flanking the P4 domain, a likely route for transmission of signaling-induced conformational changes to other CheA domains. (C) A lattice unit of the receptor array. Interface 2 interactions (red circles) between P5 subdomain 2 and CheW subdomain 1 form hexagonal P5/CheW rings that interconnect three core complexes. (D) An extended array showing interconnected core complexes organized around P5/CheW rings, producing the hexagonal arrangement of receptor trimers seen in cryo-EM studies (7, 8, 10). In addition to P5/CheW rings (dashed black lines), six-member CheW rings interact with the receptor dimers that do not contact CheA or CheW in the component core complexes (7, 10).
The architecture of the chemosensory array has been elucidated at the molecular level by fitting the atomic coordinates of individual proteins into electron density maps obtained by cryoelectron tomography (7–10). These studies, in conjunction with targeted cross-linking to confirm protein–protein interfaces (11, 12), generated a structural model for the core signaling complex and its higher-order organization in the array (Fig. 1). Important interfaces in the core complex include the trimer contacts between receptor dimers, contacts between a receptor dimer and either CheW or the CheA-P5 domain, and a binding interaction (interface 1) between P5 and CheW (Fig. 1B). P5 and CheW have homologous structures composed of two similar subdomains. Interface 1 joins P5 subdomain 1 to CheW subdomain 2. In the array model, a second CheA-P5•CheW interaction (interface 2) joins CheW subdomain 1 to P5 subdomain 2, linking three core complexes and forming a hexagonal ring of receptor trimers (Fig. 1C). In the extended array, interface 2 interactions produce a lattice of hexagonally packed receptor trimers of dimers networked by P5/CheW rings (Fig. 1D). This hexagonal arrangement has been observed in all chemotactic species of Bacteria and Archaea imaged thus far in either membrane-bound or cytoplasmic arrays, suggesting that the basic operating features are conserved as well (13–15).
Another feature of the array model (7), recently confirmed (10), are six-membered CheW rings, structurally analogous to the P5/CheW rings, that link the receptor dimers that do not directly contact CheA or CheW in the core complexes (Fig. 1D). In the present array model, the P5/CheW rings, and perhaps the CheW rings as well, could provide the allosteric connections between core complexes responsible for high signal cooperativity. To test this proposition, we constructed mutant CheA and CheW proteins with amino acid replacements at putative interface 2 residues and characterized their effects on receptor clustering, array organization, and signal cooperativity.
Results
Mutational Survey of Array Interface 2 Residues.
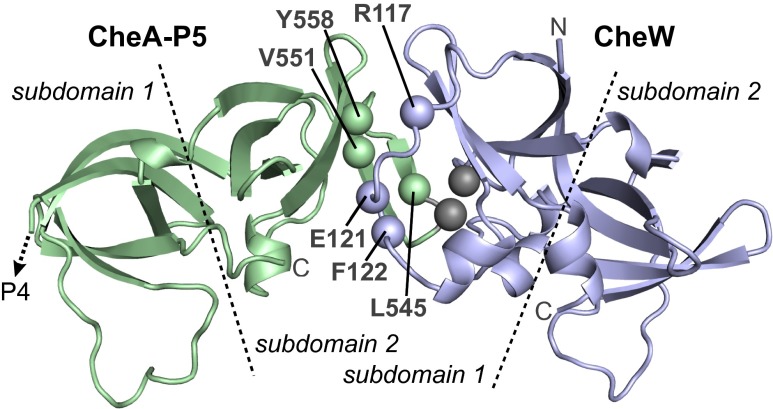
We constructed and characterized CheA and CheW mutants with amino acid replacements at interface 2 residues predicted by available crystal structures (9). Current array models suggest that this interaction may promote both assembly and operation of the chemosensory array, in which case amino acid replacements at critical interface 2 residues might impair both array integrity and chemotactic signaling. To identify such critical residues, we first surveyed CheA-P5 positions 543–560 (Fig. 2) by random mutagenesis of a plasmid expressing CheA and CheW under an inducible sodium salicylate control (pPM25; Table S1).
Fig. 2.
Structural features of array interface 2. This model of the E. coli CheA-P5•CheW interface 2 was based on crystal structures of T. maritima proteins (9). Labeled atoms show the α-carbon locations for CheA (L545, V551, and Y558) and CheW (R117, E121, and F122) residues studied in this work. Gray spheres indicate the β-carbons of cysteine residues (CheA-A546C and CheW-E27C) used as a cross-linking reporter pair for interface 2 formation in vivo. Dashed lines indicate approximate subdomain boundaries.
Table S1.
Plasmids used in this study
| Plasmid | Properties/genotype of expression insert | Reference |
| Group 1 | Derivatives of pBR322; confer ampicillin resistance; colE1 replication system; IPTG-inducible expression | 40 |
| pRR48 | Vector | 41 |
| pRR53 | tsr+ | 41 |
| pCS53 | tsr(S366C) | 41 |
| pPA803 | yfp-cheR | 42 |
| pPA90 | tsr[290-551] | 43 |
| Group 2 | Derivatives of pACYC184; confer chloramphenicol resistance; p15A replication system; sodium salicylate-inducible expression | 44, 45 |
| pKG116 | Vector | 46 |
| pPM25 | cheA+ cheW+ | This study |
| pGP55 |
cheA(M98L/C120S/C213S/C415S/A546C) cheA(S147ΩHAb/A241ΩHA) cheW(E27C) |
This study |
| pAV232 | cheA(Δ[161-226]Ωmyfp) cheW+ | This study |
| Group 3 | Derivatives of pTrc99A; confer ampicillin resistance; colE1 replication system; IPTG-inducible expression | 47 |
| pVS88 | cheY-yfp cheZ-cfp | 28 |
| pAV45 | tar([QQQQ] Δ[528-553])-myfp | 25 |
Mutant plasmids were tested for function in a ∆(cheAW) host, screening for changes that reduced chemotaxis on soft agar media to 50% or less of wild type performance. Approximately 1% of the mutant plasmids met this criterion; DNA sequencing yielded five different candidate residues. Subsequent all-codon mutagenesis of candidate positions identified three P5 residues (L545, V551, and Y558) at which various amino acid replacements impaired chemotactic performance (Table S2). These P5 residues impinge on CheW residues R117, E121, and F122 at interface 2 of the CheA-P5•CheW complex (Fig. 2). Accordingly, we constructed a CheW variant with amino acid replacements at three positions: CheW-R117D/E121R/F122S, designated CheW-X3. That triple-mutant CheW protein also impaired chemotaxis, as did a number of single amino acid replacements at CheW residues 117 and 122 (Table S2). Individually, the R117D and F122S proteins each reduced chemotaxis proficiency to approximately 50% of the wild type, whereas the E121R protein retained roughly 70% of function (Table S2).
Table S2.
Expression level and chemotaxis performance of interface 2 mutant proteins
| Mutant protein | Expression level of mutant protein (fraction of WT)* | Chemotaxis on tryptone soft agar (fraction of WT)† |
| CheA-P5 | ||
| L545A | 0.85 | 0.45 |
| L545K | 0.75 | 0.40 |
| L545N | 0.75 | 0.50 |
| L545P | 0.85 | 0.40 |
| L545Q | 0.75 | 0.45 |
| L545R | 0.80 | 0.50 |
| L545S | 0.95 | 0.35 |
| V551A | 1.2 | 0.65 |
| V551D | 0.80 | 0.35 |
| V551E | 0.85 | 0.35 |
| V551G | 0.70 | 0.50 |
| V551L | ND | 0.95 |
| V551N | 0.80 | 0.40 |
| V551P | 0.75 | 0.35 |
| V551R | 0.85 | 0.40 |
| V551S | 0.70 | 0.50 |
| Y558D | 0.85 | 0.30 |
| Y558E | 0.95 | 0.30 |
| Y558G | 0.80 | 0.50 |
| Y558K | 0.80 | 0.30 |
| Y558N | 0.95 | 0.30 |
| Y558Q | 0.85 | 0.30 |
| Y558R | 0.95 | 0.30 |
| CheW | ||
| R117D | 0.75 | 0.45 |
| R117G | 0.75 | 0.35 |
| R117L | 0.75 | 0.95 |
| R117Q | 0.75 | 0.80 |
| E121A | 0.80 | 1.1 |
| E121R | 0.80 | 0.70 |
| F122K | 0.80 | 0.40 |
| F122R | 1.2 | 0.35 |
| F122S | 0.75 | 0.55 |
| F122Y | 0.75 | 0.85 |
| R117D/E121R/F122S (=X3) | 0.75 | 0.45 |
| Cross-linking reporters | ||
| CheA-A546C/CheW-wt | 1.0/0.95 | 1.1 |
| CheA-wt/CheW-E27C | 1.1/1.0 | 0.60 |
| CheA-A546C/CheW-E27C | 1.2/1.1 | 0.65 |
ND, not determined.
Expression of mutant proteins from plasmid derivatives was measured in strain UU2784 as described previously (16). Values <1.0 were rounded to the nearest 0.05, and values >1.0 were rounded to the nearest 0.1.
Mutant plasmids were tested in strain UU2683 for chemotaxis performance on tryptone semisolid agar. Values <1.0 were rounded to the nearest 0.05, and values >1.0 were rounded to the nearest 0.1.
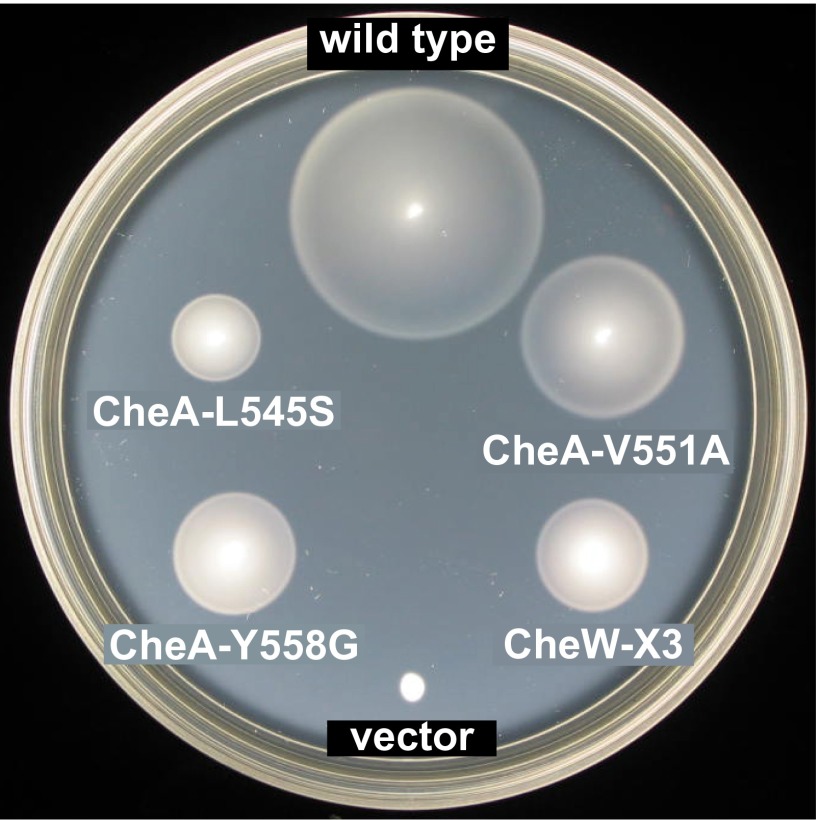
All mutant CheA and CheW proteins exhibited approximately wild type steady-state intracellular levels (Table S2), indicating that their functional defects were not due to altered gene product expression or stability. We chose CheA-L545S, CheA-V551A, CheA-Y558G, and CheW-X3 as prototype interface 2 mutants for detailed functional characterization. In soft agar assays, these proteins supported chemotaxis at ∼50% of the wild type rate (Fig. S1 and Table S2).
Fig. S1.
Chemotactic behaviors mediated by prototype interface 2 mutants. Strain UU2683 [Δ(cheAW) Δ(tar, tap, trg, aer)] carrying a wild type or mutant pPM25 plasmid was tested for chemotactic ability on tryptone soft agar. Plates were imaged after 7 h of incubation at 32.5 °C. The growth rings at the colony perimeters form through chemotactic responses to serine. (The serine receptor Tsr is the sole chemoreceptor in UU2683.) The vector control is UU2683 carrying plasmid pKG116.
Cross-Linking Evidence for in Vivo Formation of Array Interface 2.
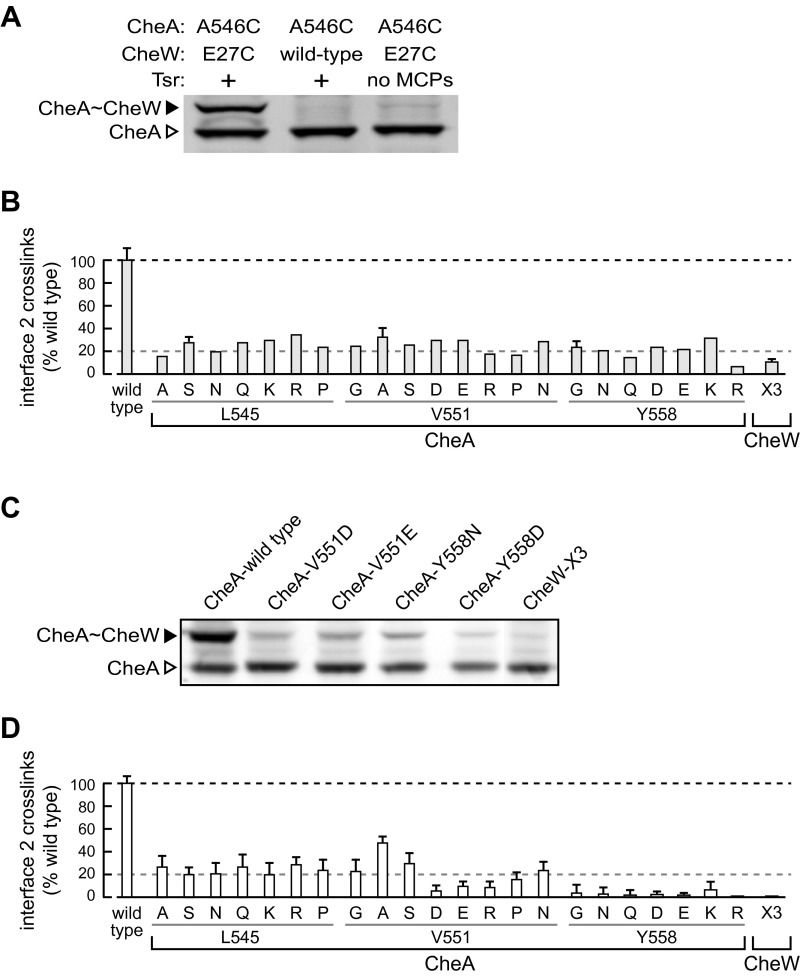
We developed a cysteine-directed cross-linking assay for interface 2 interactions in vivo. For this assay, our “wild type” CheA protein carried serine replacements at the three native, but nonessential, CheA cysteine residues (16), along with HA affinity tags in the P1-P2 and P2-P3 linkers (17, 18), to detect CheA cross-linking products in anti-HA immunoblots. The most efficient and specific interface 2 reporter pair proved to be CheA-A546C/CheW-E27C (gray atom positions in Fig. 2). These cysteine replacements, either singly or in combination, had modest effects on CheA/CheW function (Table S2) and approximately 50% of the CheA reporter molecules cross-linked to the CheW reporter in host cells containing chemoreceptors (Fig. S2). In accordance with the working model of array architecture (Fig. 1), cross-linking at interface 2 was strictly dependent on the presence of chemoreceptors (Fig. S2A).
Fig. S2.
Interface 2 cross-linking assay. (A) Specificity controls for in vivo detection of interface 2 cross-linking products. Cells of the Tsr+ strain UU2784 [Δ(cheA, cheW, tar, tap, cheR, cheB, cheY, cheZ) Δ(aer) Δ(trg)] were transformed with plasmid pGP55 (left lane), which expresses an HA-tagged CheA-A546C/CheW-E27C cross-linking reporter pair, or by a pGP55 derivative (middle lane) that expresses an HA-tagged CheA-A546C in combination with wild type CheW. The right lane shows the CheA product(s) produced by plasmid pGP55 in receptorless strain UU2806 [Δ(cheA, cheW, tap, tar, cheR, cheB, cheY, cheZ) Δ(tsr) Δ(aer) Δ(trg)]. Cell lysates were analyzed by SDS/PAGE; bands were detected with anti-HA Western blot analysis. (B) Cross-linking proficiencies of interface 2 mutants in cells expressing wild type receptors at 50% of the physiological level. Cells of strain UU2806 carried two compatible plasmids. The Tsr receptor was expressed from pRR53 induced with 10 µM IPTG, and the HA-tagged CheA-A546C/CheW-E27C cross-linking reporter pair in combination with interface 2 lesions was expressed from derivatives of pGP55 induced with 0.6 µM sodium salicylate. Cell lysates were separated by SDS/PAGE and probed with anti-HA antibody to detect cross-linked CheA∼CheW products. Band intensities were quantified by densitometry. Histogram columns with error bars show the mean and SE for between three and five independent experiments. (C) Representative cross-linking experiments on interface 2 mutants in cells expressing soluble receptor signaling fragments. Cells of strain UU2806 carried two compatible plasmids. Tsr [290-551] fragments were expressed from plasmid pPA90 induced with 50 µM IPTG, and the HA-tagged CheA-A546C/CheW-E27C cross-linking reporter pair in combination with interface 2 lesions was expressed from derivatives of pGP55 induced with 0.6 µM sodium salicylate. Cell lysates were separated by SDS/PAGE and probed with anti-HA antibody to detect cross-linked CheA∼CheW products. (D) Cross-linking proficiencies of interface 2 mutants in cells expressing soluble receptor signaling fragments. Cells of strain UU2806 carried two compatible plasmids. Tsr [290-551] fragments were expressed from plasmid pPA90 induced with 50 µM IPTG, and the HA-tagged CheA-A546C/CheW-E27C cross-linking reporter pair in combination with interface 2 lesions was expressed from derivatives of pGP55 induced with 0.6 µM sodium salicylate. Cell lysates were separated by SDS/PAGE and probed with anti-HA antibody to detect cross-linked CheA∼CheW products. Band intensities were quantified by densitometry. Histogram bars show the mean and SE for three independent experiments.
In cells expressing receptors at one-half the normal level, interface 2 lesions in either CheA or CheW reduced the extent of cross-link formation by 70–80% (Fig. 3 and Fig. S2B). Higher levels of receptors produced higher cross-linking signals, however (Fig. 3), suggesting that membrane-associated receptors might exert mass action effects that compensate for interface 2 cross-linking defects. Consistent with this idea, cytoplasmic receptor fragments also promoted interface 2 cross-linking (Fig. S2C), but mutant interface 2 proteins exhibited substantially reduced cross-linking even at high expression levels of soluble receptor fragments (Fig. S2D).
Fig. 3.
In vivo cross-linking properties of prototype interface 2 mutants. (A) Cells of strain UU2806 [∆(cheA-cheZ) ∆(tar, tap, tsr, trg, aer)] carried two compatible plasmids: pRR53 to express the Tsr receptor at different levels and a derivative of pPM25 expressing an HA-tagged CheA-A546C/CheW-E27C cross-linking reporter pair in combination with an interface 2 lesion (CheA-L545S, V551A, Y558G, and CheW-X3). Cells were grown and treated as detailed in Materials and Methods, and lysate proteins were separated by SDS/PAGE and probed with anti-HA antibody to detect cross-linked CheA∼CheW products. (B) The band profiles shown in A were quantified by densitometry, and the fraction of CheA cross-linked to CheW in each experiment was normalized to the cross-linking yield at each Tsr expression level for reporter proteins bearing no interface 2 lesions. Histogram bars show the mean and SE for between three and five independent experiments.
These cross-linking tests demonstrate that CheA-P5 and CheW interact in receptor-dependent fashion at interface 2 in vivo. Amino acid replacements at interface 2 residues impaired that interaction in all mutant proteins tested in the cross-linking assay (Fig. S2), including the prototype mutants (Fig. 3).
Spatial Organization of Receptor Complexes in Interface 2 Mutants.
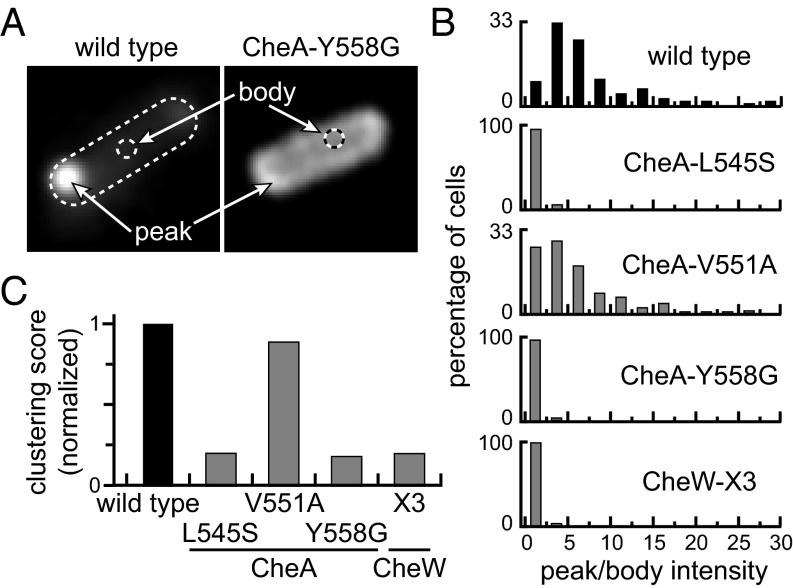
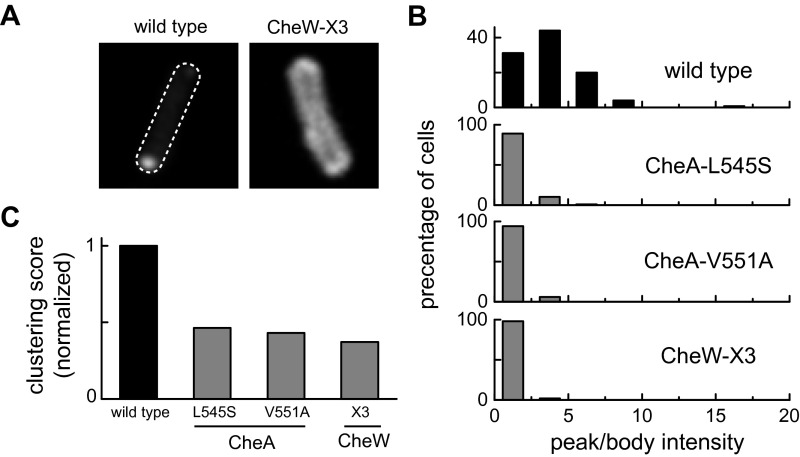
We investigated whether defective interface 2 interactions impaired the assembly or organization of receptor arrays by in vivo fluorescence microscopy, using two different fluorescence reporters. In one assay, the reporter was a CheA molecule in which mYFP replaced the P2 domain (CheA::mYFP). Although this CheA protein cannot support chemotactic behavior, it forms polar clusters in cells containing receptors and CheW, indicating efficient assembly into core complexes and arrays (Fig. 4A). In a second assay, the reporter was a YFP-tagged CheR protein, which binds directly to the C termini of Tsr and Tar receptors (Fig. S3) (19). With only one exception (CheA-V551A; see below), interface 2 mutants exhibited comparable clustering defects with both reporters in strain UU1607 [∆(cheAW)], which expresses the CheR and CheB adaptation enzymes and a full complement of chemoreceptors. The observed defects include a dispersed distribution of the reporters with substantially reduced polar clustering (Fig. 4 and Fig. S3). Because trimer-of-dimer formation alone allows receptor molecules to form diffuse polar clusters in cells lacking CheA or CheW (20, 21), the clustering defects evident with both the CheA::mYPF and YFP-CheR reporters indicate that interface 2 mutant proteins interact with receptor molecules, but that the resultant complexes cannot efficiently organize into larger clusters.
Fig. 4.
CheA clustering patterns in prototype interface 2 mutants. Plasmid pAV232 derivatives encoding CheA::mYFP/CheW in combination with an interface 2 lesion were induced at 0.3 µM sodium salicylate in strain UU1607 [∆(cheAW)], which contains a wild type complement of receptor proteins. Cells were imaged by fluorescence light microscopy. (A) Representative cell images showing the distribution of wild type and mutant CheA::mYFP proteins. Clustering contrast values were computed from the ratio of peak (highest) to body (mean of cells without the poles) intensities in each cell. (B) Distribution of clustering contrast scores for interface 2 mutants. Approximately 100 cells were analyzed for each mutant. (C) Normalized clustering scores for the interface 2 mutants in B. The averaged contrast values for each mutant were normalized to the wild type average.
Fig. S3.
Receptor clustering patterns in prototype interface 2 mutants. Cells of strain UU1607 [Δ(cheA, cheW)], which contains a wild type complement of receptor proteins, carried two compatible plasmids: pPM25 derivatives expressing CheA/CheW in combination with an interface 2 lesion (CheA-L545S, V551A, and CheW-X3, induced at 0.3 µM sodium salicylate) and pPA803 expressing YFP-tagged CheR, which binds to the C-terminal NWETF sequence on Tar and Tsr molecules. Cells were imaged by fluorescence light microscopy. (A) Representative images showing the distribution of the CheR reporter in a wild type cell and in a CheW-X3 mutant cell. Clustering contrast values were computed from the ratio of peak (highest) to body intensities in each cell. (B) Distribution of clustering contrast scores for interface 2 mutants. Approximately 100 cells were analyzed for each mutant. (C) Normalized clustering scores for the interface 2 mutants in B. The averaged contrast values for each mutant were normalized to the wild type average.
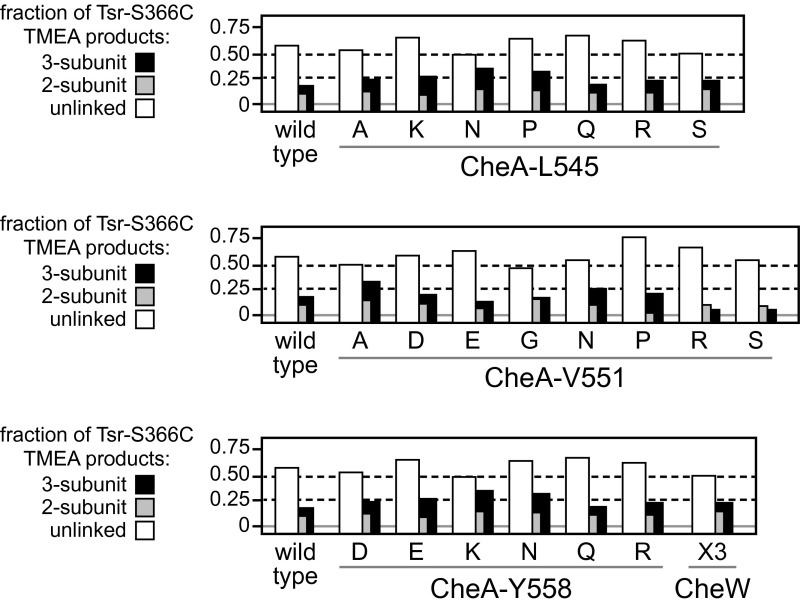
Mutant interface 2 proteins conceivably could diminish receptor clustering by impairing the ability of receptor molecules to form trimers of dimers, an assembly component of core signaling complexes (2, 22, 23). To explore that possibility, we coexpressed CheA/CheW and Tsr-S366C in a strain (UU2806) lacking the sensory adaptation enzymes and all other receptors, and examined the Tsr cross-linking products produced on treatment of the cells with the trifunctional thiol-reactive reagent Tris-(2-maleimidoethyl-amide (TMEA) (23, 24). The S366C reporter has no effect on Tsr function and, on the inner subunits of Tsr trimers of dimers, lies in a trigonal arrangement at the trimer axis. TMEA treatment links these inner reporter sites in two- and three-subunit cross-linking products whose proportions reflect the trimer-forming propensity of the receptor molecules. None of the interface 2 mutant proteins changed the TMEA cross-linking pattern of Tsr-S366C, indicating no substantive effects on the formation or stability of receptor trimers of dimers (Fig. S4).
Fig. S4.
TMEA cross-linking patterns of receptor molecules in interface 2 mutants. The effect of interface 2 mutants on Tsr trimer formation was assessed by an in vivo TMEA cross-linking assay (23). This assay exploits the trigonal symmetry of receptor trimer-of-dimers, using receptor molecules with a cysteine replacement at S366 and the trifunctional thiol-reactive TMEA cross-linking reagent. Cells of receptorless strain UU2806 carried two plasmids: pPM25 derivatives, induced with 0.6 µM sodium salicylate, to express CheA/CheW in combination with interface 2 lesions, and pCS53, induced with 150 µM IPTG, to express Tsr-S366C. The proportions of the various TMEA cross-linking products were determined by SDS/PAGE and quantitative immunoblotting.
The CheA-V551A mutant protein clustered poorly with the YFP-CheR reporter (Fig. S3), but the CheA::mYFP reporter carrying the V551A replacement displayed nearly wild type clustering ability (Fig. 4). The reporter-dependent clustering behavior of the CheA-V551A protein likely reflects some residual functionality, as also seen in chemotaxis assays (Table S2); however, in other function tests (see below), the V551A mutant exhibited defects comparable to those of other interface 2 mutants.
Packing and Stimulus-Induced Unpacking of Receptor Molecules in Interface 2 Mutants.
To assess the spatial organization of chemoreceptors in interface 2 mutants at higher resolution, we measured homo-FRET interactions between mYFP-tagged receptor molecules (25–27). On excitation with polarized light, the fluorophores on closely packed receptors can exchange energy (homo-FRET), resulting in reduced anisotropy of the emitted light. Receptors spaced further apart engage in fewer homo-FRET interactions and emit more anisotropic light. In the presence of optimal levels of wild type CheA and CheW, the tagged receptor molecules in this test (Tar [QQQQ]-mYFP) formed core complexes that reduced anisotropy below that of receptors in the absence of CheA and CheW (Fig. S5A). The mutant interface 2 proteins also showed reduced anisotropy, reflecting core complex formation, but to a lesser extent than wild type CheA/CheW (Fig. S5A), implying looser receptor organization.
Fig. S5.
Additional data for the anisotropy experiments shown in Fig. 5. (A) Baseline anisotropy (r) values. Data are averages of four measurements; error bars represent SD. The (AW)− data are for cells carrying uninduced pPM25. (B) Absolute anisotropy changes for the experiments shown in Fig. 5. The gray portion of the wild type histogram bar represents the slow phase of its response.
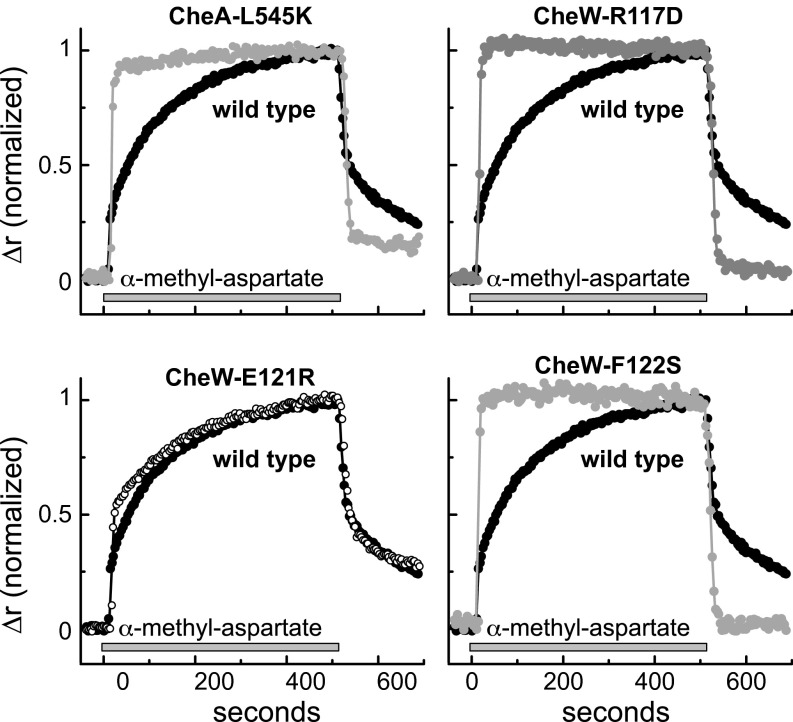
In response to an attractant stimulus, wild type core complexes exhibited a two-phase response: an initial rapid anisotropy increase, presumably due to expansion of receptor trimers (25), followed by a prolonged slow anisotropy increase consistent with gradual unpacking of receptor clusters (27) (Fig. 5). In contrast, the attractant responses of the interface 2 mutant complexes, which began at higher baseline values (Fig. S5A), reached maximal anisotropy values much more rapidly (Fig. 5). These kinetic differences also characterized the attractant removal responses of the wild type and interface 2 mutants (Fig. 5 and Fig. S6). Thus, the interface 2 defects resulted in higher baseline anisotropy (i.e., reduced homo-FRET) and eliminated the slow response to attractant seen with clustered receptor complexes (27). We conclude that these defects cause core units to form fewer or weaker connections, which results in more loosely packed receptor structures.
Fig. 5.
Receptor packing in prototype interface 2 mutants analyzed by fluorescence anisotropy. Cells of strain UU2806 [∆(cheA-cheZ) ∆(tar, tap, tsr, trg, aer)] carried two compatible plasmids: pAV45 to express the mYFP-tagged Tar [QQQQ] receptor, and derivatives of pPM25 expressing CheA/CheW in combination with an interface 2 lesion (CheA-L545S, V551A, Y558G, and CheW-X3). Cells were illuminated with polarized light at the YFP excitation wavelength, and the extent of polarization (anisotropy) in the emitted light was measured. Changes in anisotropy (∆r) elicited by α-methyl-aspartate, an attractant sensed by the Tar receptor, were normalized to the maximum ∆r value in each experiment. Baseline anisotropies and absolute anisotropy changes in these experiments are shown in Fig. S5. The gray horizontal bar indicates the times of addition and subsequent removal of 1 mM α-methyl-aspartate.
Fig. S6.
Anisotropy responses of additional interface 2 mutants. Cells of strain UU2806 carried two compatible plasmids: pAV45 to express the mYFP-tagged Tar [QQQQ] receptor; and derivatives of pPM25 expressing CheA/CheW in combination with an interface 2 lesion (CheA-L545K; CheW-R117D, E121R, and F122S). Cells were illuminated with polarized light at the YFP excitation wavelength, and the extent of polarization (anisotropy) in the emitted light was measured. Changes in anisotropy (Δr) elicited by α-methyl-aspartate, an attractant sensed by the Tar receptor, were normalized to the maximum Δr in each experiment. The gray horizontal bar indicates the time of addition and subsequent removal of 1 mM α-methyl-aspartate.
Signaling Behaviors of Interface 2 Mutants.
We measured the stimulus response properties of interface 2 mutants with an in vivo FRET-based CheA kinase assay (28, 29). This assay follows cellular phospho-CheY levels through the interaction of CheY and CheZ molecules tagged with FRET donor and acceptor fluorophores. Only phospho-CheY has high affinity for the CheZ phosphatase. The amount of [P-CheY•CheZ] complex, measured by FRET, is proportional to the rate of dephosphorylation and thus, in steady state, to the kinase activity.
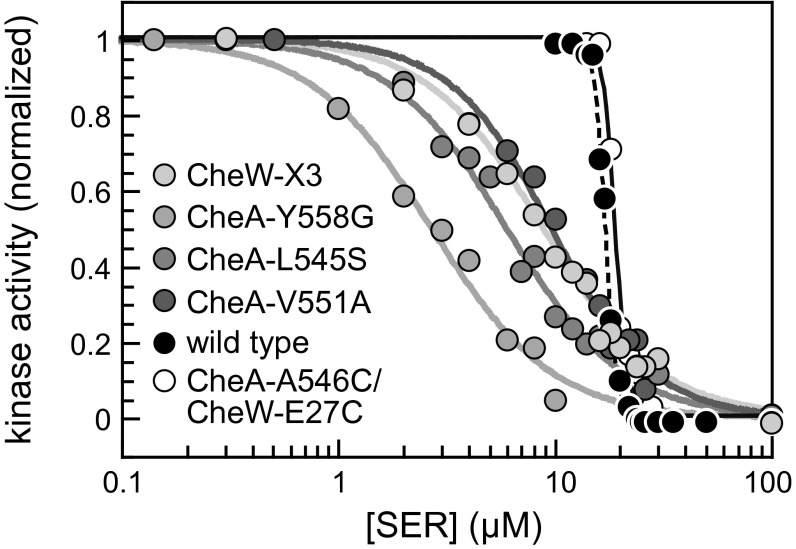
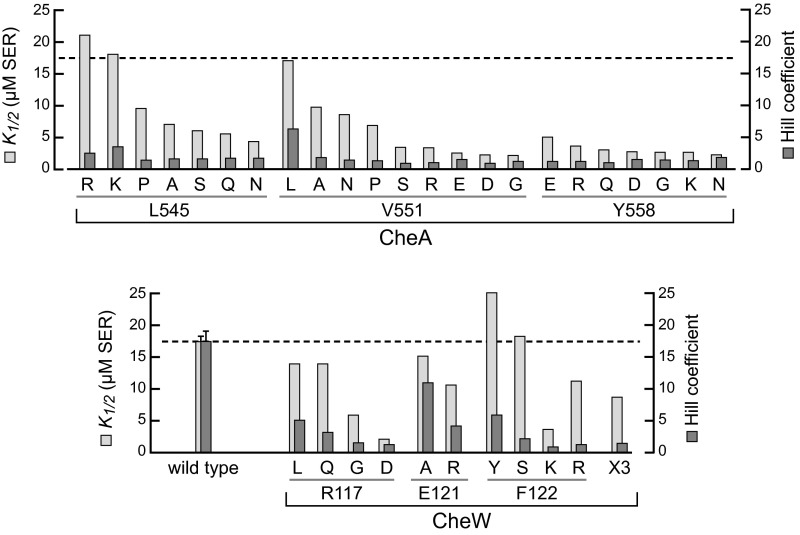
We tested the dose–response behaviors of mutant interface 2 plasmids in a host (UU2784) expressing Tsr as its only receptor type. This strain also lacked the CheR and CheB adaptation enzymes, ensuring a homogeneous population of receptor molecules with no posttranslational modifications. Under these conditions, wild type Tsr signaling complexes controlled CheA activity in a highly cooperative manner (Fig. 6: K1/2 = 17 µM; Hill coefficient = 19). The interface 2 cross-linking reporter proteins (CheA-A546C/CheW-E27C) exhibited wild type serine sensitivity and response cooperativity (Fig. 6: K1/2 = 17 µM; Hill coefficient = 15). In contrast, the interface 2 mutant prototypes produced much less cooperative responses, with Hill coefficients <2 (range, 1.6–1.9) (Fig. 6). The responses of most other interface 2 mutants had comparably low cooperativities (Fig. S7 and Table S2), implying that the receptor signaling complexes of interface 2 mutants are less tightly coupled or organized into smaller functional units compared with those in wild type receptor arrays.
Fig. 6.
Serine dose–response behaviors of prototype interface 2 mutants. In vivo FRET kinase assays were performed in strain UU2784 [∆(cheA-cheZ) ∆(tar, tap, trg, aer)], which lacks the sensory adaptation enzymes (CheR− CheB−) and expresses only the Tsr chemoreceptor. CheA and CheW proteins were expressed from plasmid pPM25 derivatives in combination with the FRET reporter pair (CheY-YFP/CheZ-CFP) from plasmid pVS88. Normalized kinase activities at each serine test concentration were fitted to a multisite Hill equation to obtain K1/2 and Hill coefficient values. The wild type CheA/CheW proteins and the CheA-A546C/CheW-E27C reporter pair produced K1/2 values of 17 µM and 19 µM, respectively with Hill coefficients of 17 and 15, respectively. Corresponding values for interface 2 mutants were as follows: CheW-X3, 8.9 µM and 1.6; CheA-L545S, 6.0 µM and 1.6; CheA-V551A, 9.7 µM and 1.9; CheA-Y558G, 2.7 µM and 1.6.
Fig. S7.
Dose–response parameter values of interface 2 mutants. Response parameters were derived from in vivo FRET kinase assays performed in strain UU2784, which lacks the sensory adaptation enzymes (CheR− CheB−) and expresses only the Tsr chemoreceptor. CheA and CheW proteins were expressed from plasmid pPM25 derivatives in combination with the FRET reporter pair (CheY-YFP/CheZ-CFP) from plasmid pVS88. Normalized kinase activities at each serine test concentration were fitted to a multisite Hill equation to obtain K1/2 and Hill coefficient values. The dashed line indicates average wild type values for K1/2 (17 µM) and the Hill coefficient (17).
The response thresholds were also lower in the interface 2 mutant prototypes compared with wild type (K1/2 = 2.7–8.9 µM vs. 17 µM) (Fig. 6). Most other interface 2 mutants also had lower serine response thresholds. A few had close to wild type K1/2 values, but still very low Hill coefficients (e.g., CheW-F122S: K1/2 = 18 µM; Hill coefficient = 1.8) (Fig. S7 and Table S2).
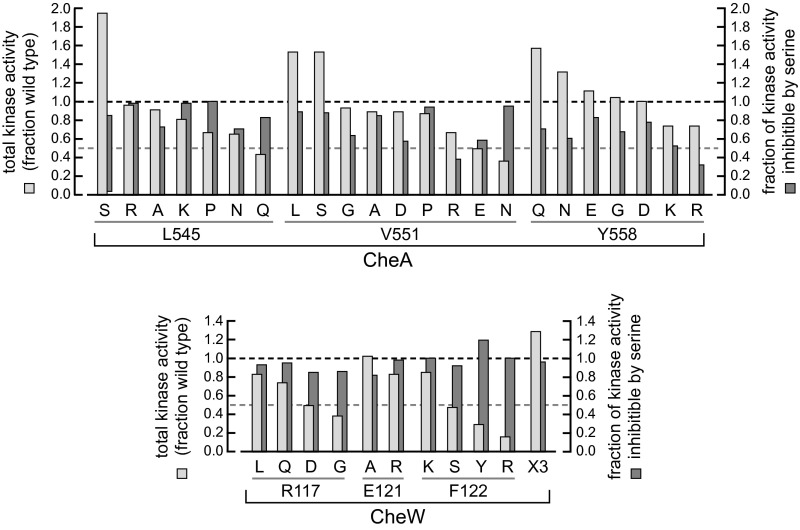
In these experiments, the overall level of kinase activity in wild type and interface 2 mutant signaling complexes was determined from the FRET change produced by treatment of cells with 3 mM KCN, which inhibits electron transport and exhausts cellular ATP, the phospho-donor for CheA autophosphorylation (4). Most interface 2 mutants exhibited at least 50% of the wild type kinase activity in this test, and most of that activity was inhibitable by a saturating serine stimulus (Fig. S8). These results show, consistent with working models of the receptor array, that interface 2 does not play a significant role in setting or controlling the kinase activities of individual core signaling complexes.
Fig. S8.
Kinase activities of receptor core complexes in interface 2 mutants. Kinase activity values were obtained from the in vivo FRET experiments summarized in Fig. S7. Total kinase activity (light-gray bars) was determined by the extent of FRET reduction elicited by exposing cells to 3 mM KCN, which depletes cellular ATP, the phosphor-donor for the CheA autophosphorylation reaction. The inhibitable fraction of that kinase activity (dark-gray bars) was determined from the FRET reduction produced by a saturating (100 µM) serine stimulus. Dashed horizontal lines indicate 50% and 100% of the wild type values for comparison purposes.
Discussion
Role of Interface 2 in Array Assembly and Signaling.
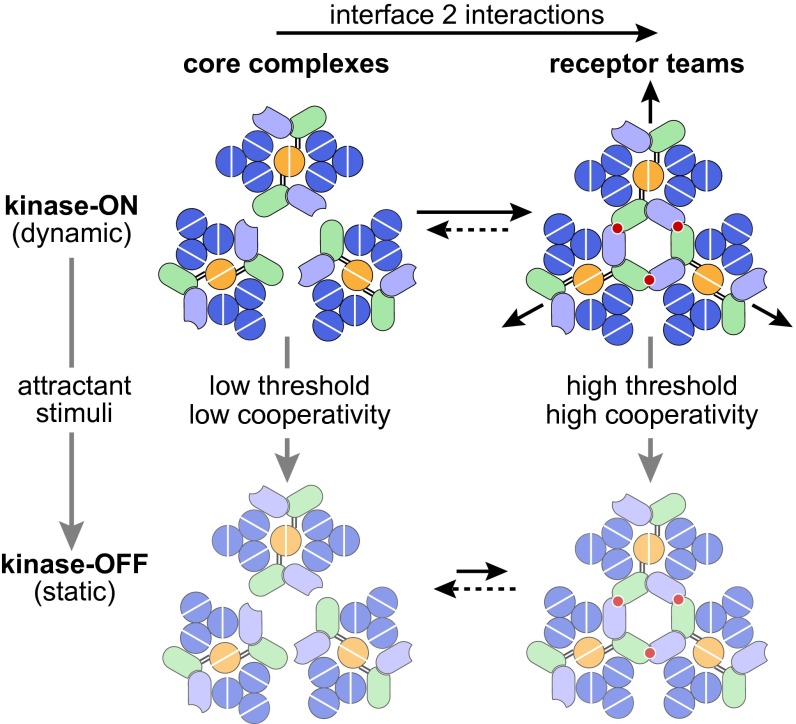
Fig. 7 summarizes our present findings in the context of other recent work on the E. coli chemosensory array. Our results demonstrate, as proposed in current array models, that interface 2 interactions between CheW and the P5 domain of CheA link individual receptor core complexes into larger structural and allosteric signaling units that have been designated receptor teams (30–33). Mutant CheA or CheW proteins with interface 2 defects assembled signaling complexes that both activated CheA autophosphorylation and inhibited that activity in response to attractant ligands; however, when coupled to receptors with uniform adaptational modification states, the kinase control responses of interface 2 mutants exhibited little or no cooperativity (Hill coefficients <2), in contrast to those of their wild type counterparts (Hill coefficients >15).
Fig. 7.
Signaling role of interface 2 in the bacterial chemosensory array. Color schemes for the cartoons match those in Fig. 1. Interface 2 interactions (red circles) between CheA-P5 and CheW assemble receptor core complexes into networked receptor teams that behave as a multi-subunit allosteric enzyme in response to binding of attractant ligands. Kinase-ON complexes (Upper) may have more dynamic structures compared with kinase-OFF complexes (Lower, pale cartoons). Static complexes may disfavor interface 2 interactions, leading to slow disassembly of kinase-OFF teams. See the text for additional discussion.
The signaling behaviors of interface 2 mutants closely resemble those of core signaling units in membrane nanodiscs (3), implying that the mutant cells may contain mainly isolated core signaling complexes. Those mutant receptor complexes were distributed uniformly around the cell membrane, with little tendency to cluster at the poles as wild type arrays do. In the absence of CheA and CheW, receptor molecules alone can form polar clusters through trimer-of-dimers interactions or through nonnative receptor–receptor interactions (21). In dispersed core signaling complexes, the mutant CheA and CheW proteins must shield those receptor clustering sites. Evidently, polar clustering of receptor arrays in E. coli requires higher-order interactions of core signaling complexes, presumably mediated by interface 2 connections. Six-membered CheW rings (Fig. 1D), which apparently form through subdomain 1 and subdomain 2 interactions between CheW molecules, also might contribute to array clustering. However, some CheA-P5 interface 2 lesions, which should not affect CheW–CheW interactions, caused clustering defects similar to those seen in the CheW-X3 mutant, indicating that CheW rings alone cannot promote clustering of receptor signaling complexes.
Signaling State Influences on Array Organization.
Several lines of evidence suggest that array signaling involves changes in the dynamic properties of the receptor hairpin tips, where CheA and CheW interact, and of CheA domains involved in the autophosphorylation reaction (1, 34) (Fig. 1A). In kinase-ON core complexes, receptor tips (35) and the CheA P1 and P2 domains (36) have dynamic properties. In contrast, the receptor tips (35) and CheA domains are more static in kinase-OFF signaling complexes (36). Thus, attractant stimuli may down-regulate CheA activity by shifting core complexes from a dynamic state to a more static structure (Fig. 7). In receptor signaling teams, such conformational changes must propagate through interface 2 connections. In this way, an attractant stimulus could down-regulate CheA activity by effectively “freezing” the structures of the signaling team components.
The chemosensory array comprises numerous receptor teams, whose sizes and network connections change in response to signal state transitions elicited by chemoeffector stimuli (25, 27) and by adaptational modifications (32, 33). The kinase-ON state promotes assembly of core complexes into receptor teams, whereas the kinase-OFF state promotes disassembly of receptor teams. Both changes likely reflect signal state effects on the strength of the interface 2 interaction. We suggest that dynamic signaling components forge interface 2 connections effectively, whereas static components form such connections less readily, resulting in a net loss of team members. These signaling-related influences on the directionality of interface 2 interactions could account for the slow in vivo dynamic changes observed in receptor homo-FRET interactions and in kinase control responses (27). Interface 2 mutants did not show a slow anisotropy response to either attractant presentation or removal, indicating that they lacked the connections between core signaling units responsible for the slow, signaling- related size changes seen in wild type receptor teams.
In summary, interface 2 defects in either CheA or CheW can effectively trap chemoreceptors in nonnetworked core signaling units that are not organized in clustered arrays. These findings not only confirm a key prediction of current array models, but also show that array cooperativity relies on coupling between core units through CheA•CheW interface 2. Interface 2 mutant proteins should prove useful for developing better-defined experimental systems for investigating chemoreceptor signaling both in vitro and in vivo.
Materials and Methods
Details of the experimental procedures are provided in SI Materials and Methods.
Bacterial Strains and Plasmids.
Strains used were derivatives of E. coli K-12 strain RP437 (37). Their relevant genotypes are as follows: UU1607 [∆(cheA-cheW)2167]; UU2683 [∆(cheA-cheW-tar-tap)4530 ∆aer-1 ∆trg-4543]; UU2784 [∆(cheA-cheW-tar-tap-cheR-cheB-cheY-cheZ)1214 ∆aer-1 ∆trg-4543]; UU2806 [∆(cheA-cheW-tar-tap-cheR-cheB-cheY-cheZ)1214 ∆tsr-5547 ∆aer-1 ∆trg-4543]. The plasmids used in this work are listed in Table S1.
Site-Directed Mutagenesis.
Mutations were generated in various plasmids carrying the cheA and/or cheW genes with the Agilent QuikChange II Site-Directed Mutagenesis Kit and confirmed by DNA sequencing the entire coding region of the targeted gene(s).
Chemotaxis Assays.
Chemotactic ability in tryptone soft agar plates was assessed in strain UU2683 bearing derivatives of plasmid pPM25, as described previously (16).
Cross-Linking Assays.
UU2806 cells cotransformed with pGP55 (or pGP55 derivatives carrying interface 2 mutations) and pRR53 were treated with 300 µM Cu2+ for 10 min at 35 °C to induce disulfide formation. Whole cell lysates were separated by SDS/PAGE, and CheA-containing species were detected by Western blot analysis using a polyclonal anti-HA antibody (Pierce).
Receptor Clustering Tests.
Strain UU1607 expressing CheA::mYFP or YFP-CheR in combination with interface 2 lesions was imaged by fluorescence microscopy as described elsewhere (27).
Fluorescence Anisotropy Measures of Receptor Packing.
Polarization experiments were performed in strain UU2806 expressing Tar [QQQQ]-mYFP as described previously (26, 38).
In Vivo FRET-Based Kinase Assays.
Kinase assays were done in strain UU2784 expressing the FRET protein pair (CheY-YFP and CheZ-CFP) from plasmid pVS88 and CheA/CheW variants from plasmid pPM25. Cell preparation, flow cell assembly, stimulus protocol, FRET instrumentation, and data analysis have been described previously (4, 28, 29). Data were fitted to a multisite Hill equation, 1 − [Ser]H/([Ser]H + K1/2H), where K1/2 is the concentration of attractant that inhibits 50% of the kinase activity and H, the Hill coefficient, reflects the cooperativity of the response. Total CheA kinase activity was calculated as the larger of the FRET changes elicited by a saturating serine stimulus or by 3 mM KCN (4).
Protein Modeling and Structural Display.
Atomic coordinates for the interface 2 complex of E. coli CheA-P5 and CheW were obtained by homology modeling using the Phyre2 server (39). The interface 2 model was based on atomic coordinates (Protein Data Bank ID code 4JPB) for a Thermotoga maritima ternary complex of receptor fragment, CheA (P3-P4-P5 domains) and CheW (9). Images were generated with MacPymol.
SI Materials and Methods
Chemotaxis Assays.
Chemotactic ability was assessed in strain UU2683 bearing derivatives of plasmid pPM25. Individual colonies were transferred with sterile toothpicks to tryptone soft agar plates (10 g/L tryptone, 5 g/l NaCl, 2.5 g/L agar) supplemented with 12.5 μg/mL chloramphenicol and 0.6 μM sodium salicylate. Plates were incubated at 32.5 °C for 7 h before imaging.
Cross-Linking Assays.
Overnight cultures of strain UU2806 cotransformed with pGP55 (or pGP55 derivatives carrying interface 2 mutations) and pRR53 were diluted 100-fold in fresh tryptone broth (10 g/L tryptone, 5 g/L NaCl) supplemented with 12.5 µg/mL chloramphenicol, 50 µg/mL ampicillin, and inducers, and grown at 30 °C with aeration. Expression of CheA-A546C and CheW-E27C was induced from pGP55 with 0.6 µM sodium salicylate to achieve wild type expression levels of these proteins. Tsr expression from pRR53 was induced with 10, 50, or 200 µM isopropyl β-D-1-thiogalactopyranoside (IPTG), yielding protein levels of 0.5-, 1-, or 2-fold the level in chromosomally encoded Tsr, respectively.
After growth of the culture to OD600 ∼0.5, a 1.5-mL aliquot was withdrawn, washed twice with 1 mL of PBS, and then resuspended in 1 mL of PBS. At each washing step, cells were centrifuged at 6,000 × g for 5 min at room temperature. Oxidation was started by the addition of 5 µL of a 60 mM Cu2+-phenanthroline solution (60 mM CuSO4, 200 mM 1,10-phenanthroline, 50 mM NaH2PO4, pH 7.4). Samples were incubated at 35 °C for 10 min, after which the reaction was stopped with 10 mM EDTA. Cells were collected by centrifugation at 21,000 × g for 3 min, and then lysed in 50 µL of 1× nonreducing loading buffer [5% (wt/vol) sucrose, 2.5 mM EDTA, 1 mg/mL N-ethylmaleimeide (NEM), 0.5 mg/mL bromophenol blue, 0.25% (wt/vol) SDS, 1.6 mM NaH2PO4, 20 mM Tris⋅HCl, pH 6.8].
CheA-containing species were detected by Western blot analysis using a polyclonal anti-HA antibody (Pierce) and a Cy5-labeled secondary antibody (Invitrogen). Western blots were imaged under fluorescence mode in a Typhoon 8600 scanner (GE Healthcare), and bands were quantified with ImageQuant software (GE Healthcare). Cross-linking proficiency of interface 2 mutant proteins was defined as the fraction of CheA in the CheA∼CheW cross-linked product normalized to the corresponding value for the wild type reporter proteins.
Receptor Clustering Tests.
Overnight cultures of strain UU1607 were diluted 100-fold in fresh tryptone broth supplemented with the appropriate inducers and antibiotics, and grown at 33.5 °C with agitation to OD600 ∼0.45. Cells were washed and resuspended in motility buffer (10 mM potassium phosphate, 0.1 mM EDTA, 10 mM lactic acid, pH 7) containing 1 μM l-methionine. For imaging, cells were immobilized between agarose gel (1.2%) and a coverslip in a titanium chamber. Fluorescence images were obtained, generally at room temperature, using a Nikon Ti inverted microscope equipped with a 100× Plan-Fluor objective (1.3 NA), a xenon lamp (Sutter Instrument), and a camera (Andor Technology). Clustering scores were computed as a weighted average of peak/body intensity scores normalized to the wild type weighted average.
Cross-Linking Assay for Receptor Trimers-of-Dimers.
Strain UU2806 bearing plasmids pCS53 and pPM25 (or pPM25 derivatives with interface 2 mutations) was diluted 100-fold from overnight cultures in fresh tryptone broth supplemented with 12.5 µg/mL chloramphenicol, 50 µg/mL ampicillin, 0.6 µM sodium salicylate, and 150 µM IPTG, and grown at 30 °C with agitation (250 rpm) to OD600 ∼0.5. Cells from a 1.5-mL aliquot of the culture were collected by centrifugation (5 min at 6,000 × g), washed twice with PBS, and finally resuspended in 1 mL of PBS. The Tsr cross-linking reaction was initiated with 50 µM TMEA and stopped with 10 mM NEM after 30 s of incubation at 30 °C. Cell samples were centrifuged at 21,000 × g for 3 min, and then lysed in 50 µL of 1× Laemmli loading buffer. Tsr-cross-linked species were detected by Western blot analysis using a polyclonal anti-Tsr antibody.
Fluorescence Anisotropy Measures of Receptor Packing.
The procedure for obtaining these measurements has been described in detail previously (26, 38). In brief, overnight cultures of strain UU2806 were diluted 100-fold in fresh tryptone broth supplemented with appropriate antibiotics and inducers and then grown at 33.5 °C with agitation to OD600 ∼0.45. Cells were washed and resuspended in motility buffer containing 1 µM l-methionine, immobilized on a coverslip, placed into a gold-plated flow chamber, and mounted on a Nikon FN1 microscope. The mYFP fluorophore was excited with linearly polarized light, and the emitted fluorescence was split, using a polarizing beam splitter cube, to its parallel (Ipar) and perpendicular (Iper) polarizations, which were monitored using two photon counters (H7422P, Hamamatsu). The steady-state polarization of the emitted fluorescence is represented here by the fluorescence anisotropy, r, defined as (Ipar − Iper)/(Ipar + 2Iper), where Iper is corrected for imperfections of the optical system. The absolute fluorescence anisotropy was validated using an aqueous solution of fluorescein and purified mYFP (yielding 0 and 0.32, respectively). The experiments were performed at room temperature.
In Vivo FRET-Based Kinase Assays.
Cell preparation, flow cell assembly, stimulus protocol, FRET instrumentation, and data analysis have been described previously (4, 28, 29). Liquid cultures of UU2784 cells expressing the FRET protein pair (CheY-YFP and CheZ-CFP) from plasmid pVS88 and CheA/CheW variants from plasmid pPM25 were diluted 100-fold in fresh tryptone broth supplemented with 12.5 µg/mL chloramphenicol, 50 µg/mL ampicillin, 50 µM IPTG, and 0.6 µM sodium salicylate and then incubated at 30 °C for 6 h to midexponential phase (OD600 ∼0.5). Cells were washed, attached to a round polylysine-coated coverslip, mounted in a flow cell, and subjected to sequential addition and removal of serine diluted in motility buffer containing 100 µM l-methionine. The attached cells and all solutions were kept at 30 °C throughout the experiment.
The cell sample was excited at CFP wavelength, and epifluorescent light emission from CFP (FRET donor) and YFP (FRET acceptor) was measured by photon-counting photomultipliers. The ratio of YFP to CFP photon counts reports in real time on CheA kinase activity and changes in response to serine stimuli. Dose–response curves were obtained by plotting the fractional changes in kinase activity versus applied serine concentrations. Data were fitted to a multisite Hill equation, 1 − [Ser]H/([Ser]H + K1/2H), where K1/2 is the concentration of attractant that inhibits 50% of the kinase activity and H, the Hill coefficient, reflects the cooperativity of the response. Total CheA kinase activity was calculated as the larger of the FRET changes elicited by a saturating serine stimulus or by 3 mM KCN (4).
Acknowledgments
We thank Dr. Claudia Studdert (Instituto de Agrobiotecnología del Litoral, Santa Fe, Argentina) for sharing plasmids containing CheW interface 2 mutations and for helpful comments on the manuscript. This work was supported by US Public Health Service Research Grant GM19559 from the National Institute of General Medical Sciences (to J.S.P.), by the Israeli Foundation of Sciences and Humanities (to A.V.), and US–Israel Binational Science Foundation Research Grant 2011463 (to A.V. and J.S.P.). The Protein-DNA Core Facility at the University of Utah receives support from National Cancer Institute Grant CA42014 to the Huntsman Cancer Institute.
Footnotes
The authors declare no conflict of interest.
This article is a PNAS Direct Submission.
This article contains supporting information online at www.pnas.org/lookup/suppl/doi:10.1073/pnas.1600216113/-/DCSupplemental.
References
- 1.Parkinson JS, Hazelbauer GL, Falke JJ. Signaling and sensory adaptation in Escherichia coli chemoreceptors: 2015 update. Trends Microbiol. 2015;23(5):257–266. doi: 10.1016/j.tim.2015.03.003. [DOI] [PMC free article] [PubMed] [Google Scholar]
- 2.Li M, Hazelbauer GL. Core unit of chemotaxis signaling complexes. Proc Natl Acad Sci USA. 2011;108(23):9390–9395. doi: 10.1073/pnas.1104824108. [DOI] [PMC free article] [PubMed] [Google Scholar]
- 3.Li M, Hazelbauer GL. Selective allosteric coupling in core chemotaxis signaling complexes. Proc Natl Acad Sci USA. 2014;111(45):15940–15945. doi: 10.1073/pnas.1415184111. [DOI] [PMC free article] [PubMed] [Google Scholar]
- 4.Lai RZ, Parkinson JS. Functional suppression of HAMP domain signaling defects in the E. coli serine chemoreceptor. J Mol Biol. 2014;426(21):3642–3655. doi: 10.1016/j.jmb.2014.08.003. [DOI] [PMC free article] [PubMed] [Google Scholar]
- 5.Bray D, Levin MD, Morton-Firth CJ. Receptor clustering as a cellular mechanism to control sensitivity. Nature. 1998;393(6680):85–88. doi: 10.1038/30018. [DOI] [PubMed] [Google Scholar]
- 6.Tu Y. Quantitative modeling of bacterial chemotaxis: signal amplification and accurate adaptation. Ann Rev Biophys. 2013;42:337–359. doi: 10.1146/annurev-biophys-083012-130358. [DOI] [PMC free article] [PubMed] [Google Scholar]
- 7.Liu J, et al. Molecular architecture of chemoreceptor arrays revealed by cryoelectron tomography of Escherichia coli minicells. Proc Natl Acad Sci USA. 2012;109(23):E1481–E1488. doi: 10.1073/pnas.1200781109. [DOI] [PMC free article] [PubMed] [Google Scholar]
- 8.Briegel A, et al. Bacterial chemoreceptor arrays are hexagonally packed trimers of receptor dimers networked by rings of kinase and coupling proteins. Proc Natl Acad Sci USA. 2012;109(10):3766–3771. doi: 10.1073/pnas.1115719109. [DOI] [PMC free article] [PubMed] [Google Scholar]
- 9.Li X, et al. The 3.2 Å resolution structure of a receptor: CheA:CheW signaling complex defines overlapping binding sites and key residue interactions within bacterial chemosensory arrays. Biochemistry. 2013;52(22):3852–3865. doi: 10.1021/bi400383e. [DOI] [PMC free article] [PubMed] [Google Scholar]
- 10.Cassidy CK, et al. CryoEM and computer simulations reveal a novel kinase conformational switch in bacterial chemotaxis signaling. eLife. 2015;4:e08419. doi: 10.7554/eLife.08419. [DOI] [PMC free article] [PubMed] [Google Scholar]
- 11.Natale AM, Duplantis JL, Piasta KN, Falke JJ. Structure, function, and on-off switching of a core unit contact between CheA kinase and CheW adaptor protein in the bacterial chemosensory array: A disulfide mapping and mutagenesis study. Biochemistry. 2013;52(44):7753–7765. doi: 10.1021/bi401159k. [DOI] [PMC free article] [PubMed] [Google Scholar]
- 12.Piasta KN, Ulliman CJ, Slivka PF, Crane BR, Falke JJ. Defining a key receptor-CheA kinase contact and elucidating its function in the membrane-bound bacterial chemosensory array: A disulfide mapping and TAM-IDS Study. Biochemistry. 2013;52(22):3866–3880. doi: 10.1021/bi400385c. [DOI] [PMC free article] [PubMed] [Google Scholar]
- 13.Briegel A, et al. Universal architecture of bacterial chemoreceptor arrays. Proc Natl Acad Sci USA. 2009;106(40):17181–17186. doi: 10.1073/pnas.0905181106. [DOI] [PMC free article] [PubMed] [Google Scholar]
- 14.Briegel A, et al. Structure of bacterial cytoplasmic chemoreceptor arrays and implications for chemotactic signaling. eLife. 2014;3:e02151. doi: 10.7554/eLife.02151. [DOI] [PMC free article] [PubMed] [Google Scholar]
- 15.Briegel A, et al. Structural conservation of chemotaxis machinery across Archaea and Bacteria. Environ Microbiol Rep. 2015;7(3):414–419. doi: 10.1111/1758-2229.12265. [DOI] [PMC free article] [PubMed] [Google Scholar]
- 16.Zhao J, Parkinson JS. Cysteine-scanning analysis of the chemoreceptor-coupling domain of the Escherichia coli chemotaxis signaling kinase CheA. J Bacteriol. 2006;188(12):4321–4330. doi: 10.1128/JB.00274-06. [DOI] [PMC free article] [PubMed] [Google Scholar]
- 17.Morrison TB, Parkinson JS. Liberation of an interaction domain from the phosphotransfer region of CheA, a signaling kinase of Escherichia coli. Proc Natl Acad Sci USA. 1994;91(12):5485–5489. doi: 10.1073/pnas.91.12.5485. [DOI] [PMC free article] [PubMed] [Google Scholar]
- 18.Jahreis K, Morrison TB, Garzón A, Parkinson JS. Chemotactic signaling by an Escherichia coli CheA mutant that lacks the binding domain for phosphoacceptor partners. J Bacteriol. 2004;186(9):2664–2672. doi: 10.1128/JB.186.9.2664-2672.2004. [DOI] [PMC free article] [PubMed] [Google Scholar]
- 19.Wu J, Li J, Li G, Long DG, Weis RM. The receptor binding site for the methyltransferase of bacterial chemotaxis is distinct from the sites of methylation. Biochemistry. 1996;35(15):4984–4993. doi: 10.1021/bi9530189. [DOI] [PubMed] [Google Scholar]
- 20.Kentner D, Thiem S, Hildenbeutel M, Sourjik V. Determinants of chemoreceptor cluster formation in Escherichia coli. Mol Microbiol. 2006;61(2):407–417. doi: 10.1111/j.1365-2958.2006.05250.x. [DOI] [PubMed] [Google Scholar]
- 21.Gosink KK, Zhao Y, Parkinson JS. Mutational analysis of N381, a key trimer contact residue in Tsr, the Escherichia coli serine chemoreceptor. J Bacteriol. 2011;193(23):6452–6460. doi: 10.1128/JB.05887-11. [DOI] [PMC free article] [PubMed] [Google Scholar]
- 22.Kim KK, Yokota H, Kim SH. Four-helical-bundle structure of the cytoplasmic domain of a serine chemotaxis receptor. Nature. 1999;400(6746):787–792. doi: 10.1038/23512. [DOI] [PubMed] [Google Scholar]
- 23.Studdert CA, Parkinson JS. Crosslinking snapshots of bacterial chemoreceptor squads. Proc Natl Acad Sci USA. 2004;101(7):2117–2122. doi: 10.1073/pnas.0308622100. [DOI] [PMC free article] [PubMed] [Google Scholar]
- 24.Studdert CA, Parkinson JS. In vivo crosslinking methods for analyzing the assembly and architecture of chemoreceptor arrays. Methods Enzymol. 2007;423:414–431. doi: 10.1016/S0076-6879(07)23019-8. [DOI] [PubMed] [Google Scholar]
- 25.Vaknin A, Berg HC. Physical responses of bacterial chemoreceptors. J Mol Biol. 2007;366(5):1416–1423. doi: 10.1016/j.jmb.2006.12.024. [DOI] [PMC free article] [PubMed] [Google Scholar]
- 26.Frank V, Koler M, Furst S, Vaknin A. The physical and functional thermal sensitivity of bacterial chemoreceptors. J Mol Biol. 2011;411(3):554–566. doi: 10.1016/j.jmb.2011.06.006. [DOI] [PubMed] [Google Scholar]
- 27.Frank V, Vaknin A. Prolonged stimuli alter the bacterial chemosensory clusters. Mol Microbiol. 2013;88(3):634–644. doi: 10.1111/mmi.12215. [DOI] [PubMed] [Google Scholar]
- 28.Sourjik V, Berg HC. Receptor sensitivity in bacterial chemotaxis. Proc Natl Acad Sci USA. 2002;99(1):123–127. doi: 10.1073/pnas.011589998. [DOI] [PMC free article] [PubMed] [Google Scholar]
- 29.Sourjik V, Vaknin A, Shimizu TS, Berg HC. In vivo measurement by FRET of pathway activity in bacterial chemotaxis. Methods Enzymol. 2007;423:365–391. doi: 10.1016/S0076-6879(07)23017-4. [DOI] [PubMed] [Google Scholar]
- 30.Ames P, Studdert CA, Reiser RH, Parkinson JS. Collaborative signaling by mixed chemoreceptor teams in Escherichia coli. Proc Natl Acad Sci USA. 2002;99(10):7060–7065. doi: 10.1073/pnas.092071899. [DOI] [PMC free article] [PubMed] [Google Scholar]
- 31.Albert R, Chiu YW, Othmer HG. Dynamic receptor team formation can explain the high signal transduction gain in Escherichia coli. Biophys J. 2004;86(5):2650–2659. doi: 10.1016/S0006-3495(04)74321-0. [DOI] [PMC free article] [PubMed] [Google Scholar]
- 32.Endres RG, et al. Variable sizes of Escherichia coli chemoreceptor signaling teams. Mol Syst Biol. 2008;4:211. doi: 10.1038/msb.2008.49. [DOI] [PMC free article] [PubMed] [Google Scholar]
- 33.Hansen CH, Sourjik V, Wingreen NS. A dynamic-signaling-team model for chemotaxis receptors in Escherichia coli. Proc Natl Acad Sci USA. 2010;107(40):17170–17175. doi: 10.1073/pnas.1005017107. [DOI] [PMC free article] [PubMed] [Google Scholar]
- 34.Falke JJ, Piasta KN. Architecture and signal transduction mechanism of the bacterial chemosensory array: Progress, controversies, and challenges. Curr Opin Struct Biol. 2014;29:85–94. doi: 10.1016/j.sbi.2014.10.001. [DOI] [PMC free article] [PubMed] [Google Scholar]
- 35.Swain KE, Gonzalez MA, Falke JJ. Engineered socket study of signaling through a four-helix bundle: Evidence for a yin-yang mechanism in the kinase control module of the aspartate receptor. Biochemistry. 2009;48(39):9266–9277. doi: 10.1021/bi901020d. [DOI] [PMC free article] [PubMed] [Google Scholar]
- 36.Briegel A, et al. The mobility of two kinase domains in the Escherichia coli chemoreceptor array varies with signalling state. Mol Microbiol. 2013;89(5):831–841. doi: 10.1111/mmi.12309. [DOI] [PMC free article] [PubMed] [Google Scholar]
- 37.Parkinson JS, Houts SE. Isolation and behavior of Escherichia coli deletion mutants lacking chemotaxis functions. J Bacteriol. 1982;151(1):106–113. doi: 10.1128/jb.151.1.106-113.1982. [DOI] [PMC free article] [PubMed] [Google Scholar]
- 38.Vaknin A, Berg HC. Osmotic stress mechanically perturbs chemoreceptors in Escherichia coli. Proc Natl Acad Sci USA. 2006;103(3):592–596. doi: 10.1073/pnas.0510047103. [DOI] [PMC free article] [PubMed] [Google Scholar]
- 39.Kelley LA, Mezulis S, Yates CM, Wass MN, Sternberg MJ. The Phyre2 web portal for protein modeling, prediction and analysis. Nat Protoc. 2015;10(6):845–858. doi: 10.1038/nprot.2015.053. [DOI] [PMC free article] [PubMed] [Google Scholar]
- 40.Bolivar F, et al. Construction and characterization of new cloning vehicles, II: A multipurpose cloning system. Gene. 1977;2(2):95–113. [PubMed] [Google Scholar]
- 41.Studdert CA, Parkinson JS. Insights into the organization and dynamics of bacterial chemoreceptor clusters through in vivo crosslinking studies. Proc Natl Acad Sci USA. 2005;102(43):15623–15628. doi: 10.1073/pnas.0506040102. [DOI] [PMC free article] [PubMed] [Google Scholar]
- 42.Zhou Q, Ames P, Parkinson JS. Biphasic control logic of HAMP domain signalling in the Escherichia coli serine chemoreceptor. Mol Microbiol. 2011;80(3):596–611. doi: 10.1111/j.1365-2958.2011.07577.x. [DOI] [PMC free article] [PubMed] [Google Scholar]
- 43.Ames P, Parkinson JS. Constitutively signaling fragments of Tsr, the Escherichia coli serine chemoreceptor. J Bacteriol. 1994;176(20):6340–6348. doi: 10.1128/jb.176.20.6340-6348.1994. [DOI] [PMC free article] [PubMed] [Google Scholar]
- 44.Chang ACY, Cohen SN. Construction and characterization of amplifiable multicopy DNA cloning vehicles derived from the P15A cryptic miniplasmid. J Bacteriol. 1978;134(3):1141–1156. doi: 10.1128/jb.134.3.1141-1156.1978. [DOI] [PMC free article] [PubMed] [Google Scholar]
- 45.Yen KM. Construction of cloning cartridges for development of expression vectors in gram-negative bacteria. J Bacteriol. 1991;173(17):5328–5335. doi: 10.1128/jb.173.17.5328-5335.1991. [DOI] [PMC free article] [PubMed] [Google Scholar]
- 46.Gosink KK, Burón-Barral MC, Parkinson JS. Signaling interactions between the aerotaxis transducer Aer and heterologous chemoreceptors in Escherichia coli. J Bacteriol. 2006;188(10):3487–3493. doi: 10.1128/JB.188.10.3487-3493.2006. [DOI] [PMC free article] [PubMed] [Google Scholar]
- 47.Amann E, Brosius J, Ptashne M. Vectors bearing a hybrid trp-lac promoter useful for regulated expression of cloned genes in Escherichia coli. Gene. 1983;25(2-3):167–178. doi: 10.1016/0378-1119(83)90222-6. [DOI] [PubMed] [Google Scholar]
- 48.Day RN, Davidson MW. The fluorescent protein palette: Tools for cellular imaging. Chem Soc Rev. 2009;38(10):2887–2921. doi: 10.1039/b901966a. [DOI] [PMC free article] [PubMed] [Google Scholar]


