

Abstract
Background
Recently, van Walraven developed a weighted summary score (VW) based on the 30 comorbidities from the Elixhauser comorbidity system. One of the 30 comorbidities, cardiac arrhythmia, is currently excluded as a comorbidity indicator in administrative datasets such as the Nationwide Inpatient Sample (NIS), prompting us to examine the validity of the VW score and its use in the NIS.
Methods
Using data from the 2009 Maryland State Inpatient Database, we derived weighted summary scores to predict in-hospital mortality based on the full (30) and reduced (29) set of comorbidities and compared model performance of these and other comorbidity summaries in 2009 NIS data.
Results
Weights of our derived scores were not sensitive to the exclusion of cardiac arrhythmia. When applied to NIS data, models containing derived summary scores performed nearly identically (c statistics for 30 and 29 variable-derived summary scores: 0.804 and 0.802, respectively) to the model using all 29 comorbidity indicators (c = 0.809), and slightly better than the VW score (c = 0.793). Each of these models performed substantially better than those based on a simple count of Elixhauser comorbidities (c = 0.745) or a categorized count (0, 1, 2, or ≥3 comorbidities; c = 0.737).
Conclusions
The VW score and our derived scores are valid in the NIS and are statistically superior to summaries using simple co-morbidity counts. Researchers wishing to summarize the Elixhauser comorbidities with a single value should use the VW score or those derived in this study.
Keywords: comorbidity adjustment, Elixhauser comorbidity system, comorbidity summary measures, Nationwide Inpatient Sample
Observational studies using administrative data require proper comorbidity adjustment to reduce bias.1 Two popular methods are the Elixhauser comorbidity system,2 a set of 30 comorbidity indicators, and the Charlson co-morbidity index—a composite score summarized by a weighted combination of 17 comorbidities.3 While interpreting 30 indicators and modeling numerous interactions can be difficult,4 Elixhauser et al2 recommended against a single score. Despite several studies demonstrating Elix-hauser's comorbidity system to be statistically superior for predicting various outcomes,5–8 the Charlson comorbidity index continues to be used.9–11 A composite score provides an attractive advantage over 30 indicators by reducing overfitting risk in small datasets and limiting computational requirements in large datasets. To avoid these issues, some researchers12–14 summarize the number of Elixhauser comorbidities—either as a comorbidity count, or categorized as 0, 1, 2, or ≥3 comorbidities—under the questionable13 assumption that each comorbidity equally affects outcome.
van Walraven et al4 developed a composite score (VW score) for the Elixhauser comorbidities by modeling in-hospital mortality with inpatient admission data (Ottawa Hospital, Ontario, Canada, 1996–2008). The VW score discriminated in-hospital mortality similarly to using 30 individual comorbidities,4 as well as long-term cancer survival in a subsequent study involving United States (US) Medicare beneficiaries.15
Researchers frequently use comorbidity adjustments in administrative datasets including the Nationwide Inpatient Sample (NIS) and State Inpatient Database (SID) from the Healthcare Cost and Utilization Project (HCUP) sponsored by the Agency for Healthcare Research and Quality.16 The NIS includes all inpatient admissions from a stratified sample of approximately 1000 US hospitals, yielding approximately 8 million records annually. The SID includes US state-specific censes of inpatient discharges. HCUP provides software for converting International Classification of Diseases, 9th Revision, Clinical Modification (ICD-9-CM) diagnosis codes to Elixhauser comorbidity indicators. Using diagnosis-related group codes, the software disregards ICD-9-CM diagnosis codes related to principal diagnoses to better identify comorbidities.
Beginning in 2004, cardiac arrhythmia (CA) was excluded from the comorbidity software following concerns about its reliability as a comorbidity.17 Unlike the NIS, the SID contains present-on-admission (POA) indicators accompanying each reported diagnosis, providing greater discriminative ability between comorbidities and hospital-acquired conditions. Thus, one can correctly apply van Walraven's weights for all 30 Elixhauser comorbidities in the SID using POA indicators. However, in the NIS where only 29 comorbidities are included and no POA indicators are available, researchers applying the VW score implicitly assign a CA comorbidity weight of 0, as opposed to the originally assigned 5 (VW weights range from −7 to 12).
Evidence suggests that the VW score may be sensitive to exclusion of CA in the derivation process. In van Walraven's analysis, CA was significantly correlated with valvular disease and the unadjusted and adjusted odds ratios for valvular disease indicated a positive and negative association with in-hospital mortality, respectively.4 Because regression models with correlated predictors can produce unstable coefficient estimates,18 rederiving the VW score without CA could produce different results.
We address the practical concern of applying the VW score in the NIS by deriving new summary scores and assessing their sensitivity to exclusion of CA. To our knowledge, we provide the first assessment of the VW score in a US national sample of hospital discharges.
Methods
Data Source
We utilized the 2009 Maryland SID to derive new summary scores due to the state's ethnically and geographically diverse population19 and sufficient sample size. We excluded maternity-related admissions, transfers in and out of the hospital, and same-day surgeries, combined with further reductions to maintain comparability with the VW score sample (n = 228,565). We applied HCUP comorbidity software version 3.517 to code the 29 currently available Elixhauser comorbidities; for CA, we used a previous version of the software from the last year CA was included (2004). Positive evidence for a comorbidity required a positive or exempt POA status accompanying the diagnosis code. For validation, we used 2009 NIS data, employing the same exclusion criteria as with the SID. We included ICD-9-CM diagnosis codes within each record's first 25 and 35 diagnoses for the NIS and SID samples, respectively.
Rederivation of the Summary Score
Replicating the VW score derivation methods, we derived 2 new summary scores—SID30 and SID29—by creating multivariable logistic regression models for in-hospital mortality using the full 30 or 29 (excluding CA) Elixhauser comorbidities, respectively, as predictors. We used backward stepwise elimination, retaining variables with P<0.05. Dividing regression coefficients by the smallest absolute coefficient, rounded to the nearest integer, produced the comorbidity weights.20 Nonretained Elixhauser comorbidities received 0-point weights. We summed the assigned weights for each Elixhauser comorbidity to calculate the summary score for each hospitalization. We derived the new scores using SAS, version 9.3 (SAS Institute, Cary, NC).
Comparison of Various Adjustment Techniques
We applied the rederived summary and VW scores to 2009 NIS data. To compare the performance of these composite scores and other comorbidity measures, we created 7 multi-variable logistic regression models predicting in-hospital mortality. Our baseline model included predictors used in another assessment21 of the Elixhauser comorbidities: age, sex, race, length of stay, expected primary payer, and an operation status indicator, defined by the presence of an ICD-9-CM procedure code in either the major diagnostic or therapeutic AHRQ Procedure Classes.22 Other models were created by adding the following predictors to the baseline model: (1) binary indicators for the 29 available Elixhauser comorbidities (Binary29); (2) VW score; (3) SID30 score; (4) SID29 score; (5) a count of Elixhauser comorbidities (Count); and (6) a categorical variable defined by 0, 1, 2, or ≥3 Elixhauser comorbidities (Count4). To account for the stratified sampling scheme present in NIS data, we incorporated discharge sampling weights in all models.23,24
To assess the validity of the comorbidity adjustments, we examined several model performance criteria. We compared overall model performance using the scaled Brier score (range, 0%–100%; higher values indicate better perfor-mance).25,26 Calibration (ie, the agreement between observed outcome incidences and a model's predicted probabilities) was assessed graphically. Discrimination, a measure of each model's ability to distinguish which patients died in hospital, was compared using the concordance (c) statistic. We graphed receiver-operating characteristic curves for visual presentation of the c statistics. Relative to the baseline model, we compared the 6 comorbidity-adjusted models using net reclassification improvement (NRI),27–30 which measures the degree of improvement in predicted probabilities of in-hospital mortality when adding a comorbidity adjustment to the baseline model. Higher NRI values indicate better reclassification. We used bootstrap methods to compute 95% confidence intervals for performance measures and to compare c statistics. We used R, version 3.0.031 for model comparisons.
Results
Rederivation of Summary Scores
The 2009 Maryland SID contains 773,472 inpatient admissions to 51 community hospitals. Of these, 550,104 admissions from 50 hospitals met inclusion criteria. We randomly selected 228,565 of these admissions for re-derivation of the summary score with all 50 hospitals represented. Mean patient age was 59.9 (SD = 18.7) with 45.2% female. The median length of stay was 3 days (interquartile range, 2–5 d) and 26.6% of admissions involved an operation. The in-hospital mortality rate was 2.2%. Table 1 displays the prevalence of each comorbidity across the samples. For most comorbidities, the prevalence was higher in our derivation sample than either van Walraven's or Elixhauser's sample.
Table 1. Prevalence of Elixhauser Comorbidity Groups in Elixhauser's Sample (Elixhauser), van Walraven's Derivation Sample (VW), and our Derivation Sample of 2009 Maryland State Inpatient Database Data (MD 2009).
| Prevalence (%) | Unadjusted Odds Ratio | Adjusted Odds Ratio | Weights | ||||||||
|---|---|---|---|---|---|---|---|---|---|---|---|
|
|
|
|
|
||||||||
| Elixhauser | VW | MD 2009 | VW | MD2009 | VW | SID30 | SID29 | VW | SID30 | SID29 | |
| Congestive heart failure | 4.0 | 9.6 | 9.3 | 3.37 | 3.94 | 1.96 | 1.99 | 2.47 | 7 | 9 | 9 |
| Cardiac arrhythmia | 6.8 | 11.2 | 13.7 | 2.96 | 3.23 | 1.71 | 1.81 | NA | 5 | 8 | NA |
| Valvular disease | 1.8 | 3.0 | 7.2 | 2.05 | 2.12 | 0.91 | −1 | 0 | 0 | ||
| Pulmonary circulation disorder | 0.3 | 1.9 | 3.7 | 3.36 | 3.38 | 1.48 | 1.48 | 1.60 | 4 | 5 | 5 |
| Peripheral vascular disease | 2.6 | 4.7 | 7.8 | 2.19 | 2.09 | 1.26 | 1.37 | 1.43 | 2 | 4 | 4 |
| Hypertension | 17.9 | 20.2 | 57.2 | 1.65 | 1.21 | 0.87 | 0.90 | 0 | −2 | −1 | |
| Paralysis | 1.8 | 2.2 | 2.6 | 2.51 | 1.76 | 1.93 | 1.34 | 1.36 | 7 | 4 | 3 |
| Other neurological disorders | 2.7 | 4.6 | 8.9 | 2.49 | 1.80 | 1.83 | 1.44 | 1.45 | 6 | 5 | 4 |
| Chronic pulmonary disease | 9.9 | 8.8 | 20.7 | 2.24 | 1.61 | 1.36 | 1.29 | 1.30 | 3 | 3 | 3 |
| Diabetes, complicated | 7.8 | 9.5 | 20.8 | 1.63 | 1.23 | 1.08 | 0 | 1 | 0 | ||
| Diabetes, uncomplicated | 4.1 | 6.1 | 5.5 | 2.00 | 1.45 | 0.86 | 0 | 0 | −1 | ||
| Hypothyroidism | 2.7 | 2.3 | 11.3 | 1.73 | 1.32 | 0 | 0 | 0 | |||
| Renal failure | 3.3 | 7.5 | 13.8 | 3.00 | 2.78 | 1.63 | 1.74 | 1.77 | 5 | 7 | 6 |
| Liver disease | 1.3 | 2.3 | 3.3 | 4.04 | 2.18 | 2.97 | 1.73 | 1.73 | 11 | 7 | 5 |
| Peptic ulcer disease | 0.8 | 0.7 | 0.1 | 2.13 | 1.67 | 0 | 0 | 0 | |||
| AIDS/HIV | 0.4 | 0.5 | 0.7 | 1.75 | 0.85 | 0 | 0 | 0 | |||
| Lymphoma | 0.5 | 2.0 | 0.8 | 2.54 | 2.64 | 2.55 | 1.84 | 1.84 | 9 | 8 | 6 |
| Metastatic cancer | 2.4 | 7.4 | 2.4 | 3.86 | 4.25 | 3.30 | 3.59 | 3.55 | 12 | 17 | 13 |
| Solid tumor without metastasis | 6.0 | 11.7 | 2.1 | 2.89 | 2.82 | 1.47 | 2.15 | 2.18 | 4 | 10 | 8 |
| Rheumatoid arthritis | 1.2 | 2.0 | 2.8 | 1.38 | 1.17 | 0 | 0 | 0 | |||
| Coagulopathy | 1.5 | 4.2 | 5.2 | 3.05 | 4.29 | 1.30 | 2.48 | 2.55 | 3 | 12 | 9 |
| Obesity | 2.3 | 1.3 | 17.4 | 0.90 | 0.65 | 0.64 | 0.67 | 0.67 | −4 | −5 | −4 |
| Weight loss | 1.1 | 1.6 | 4.8 | 3.64 | 3.99 | 1.85 | 2.10 | 2.13 | 6 | 10 | 8 |
| Fluid/electrolyte disorders | 13.3 | 12.4 | 27.2 | 3.28 | 3.41 | 1.61 | 2.31 | 2.38 | 5 | 11 | 9 |
| Blood loss anemia | 1.6 | 1.1 | 1.6 | 1.92 | 1.31 | 0.81 | 0.79 | 0.82 | −2 | −3 | −2 |
| Deficiency anemia | 7.3 | 1.8 | 22.7 | 1.84 | 1.92 | 0.80 | −2 | 0 | 0 | ||
| Alcohol abuse | 2.9 | 3.1 | 6.7 | 1.42 | 0.80 | 0.85 | 0 | 0 | −2 | ||
| Drug abuse | 1.5 | 2.1 | 7.4 | 0.58 | 0.35 | 0.50 | 0.44 | 0.43 | −7 | −11 | −8 |
| Psychoses | 1.4 | 2.8 | 5.7 | 1.28 | 0.66 | 0.65 | 0.64 | 0 | −6 | −4 | |
| Depression | 1.5 | 5.1 | 13.4 | 1.02 | 0.75 | 0.73 | 0.66 | 0.66 | −3 | −5 | −4 |
Unadjusted odds ratios for van Walraven's sample (VW) and our sample (MD 2009). Adjusted odds ratios from final models and associated weights for van Walraven's sample (VW) and our models using all 30 original Elixhauser comorbidities (SID30) and the 29 that excluded cardiac arrhythmia (SID29).
Table 1 contains the odds ratios and associated weights for each comorbidity and each score. In comparing the VW score to our rederived scores, comorbidities with substantial differences in adjusted odds ratios and corresponding weights included liver disease, lymphoma, and coagulopathy.
Comparison of Models Using NIS Data
More than 98% of admissions had predicted probability of in-hospital mortality between 0.002 and 0.2 for all models. Within this range of predicted probability, all models displayed reasonable calibration; although, the Binary29, VW score, SID30, and SID29 models displayed slight miscalibration among patients with predicted probabilities of in-hospital mortality between 0.002 and 0.01 (Fig. 1). All models displayed miscalibration above predicted probabilities of 0.2, although less than about 0.9% of admissions (depending on the model) had such high predicted probabilities.
Figure 1.
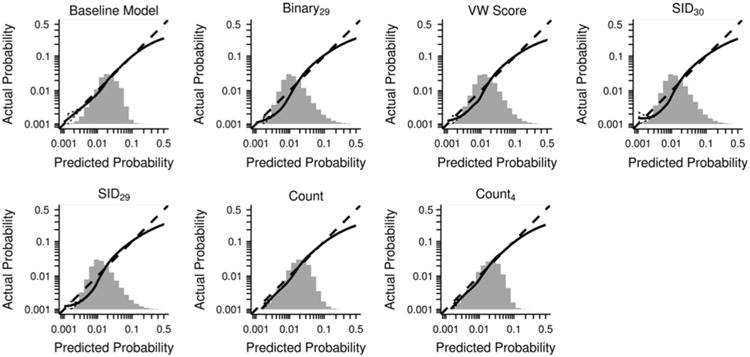
Calibration plots for logistic regression models predicting in-hospital mortality. The plots display the relationship between predicted mortality and observed mortality. Perfect calibration is represented by the 45-degree line. Predictors in baseline model were age, sex, race, length of stay, expected primary payer, and occurrence of operation. Other models include the variables in the baseline model in addition to the specified comorbidity adjustment. The solid line represents a nonparametric smooth curve (lowess algorithm). The dashed curves represent a 95% confidence band for each calibration curve. For relative comparison of distributions, histograms of predicted probabilities of in-hospital mortality are overlaid on the x-axis. Binary29—all 29 Elixhauser comorbidities included as binary indicators. VW score—weighted summary score derived by van Walraven. SID30—weighted summary score derived in 2009 Maryland State Inpatient Database data using all 30 original Elixhauser comorbidities. SID29—weighted summary score derived in 2009 Maryland State Inpatient Database data using 29 Elixhauser comorbidities (excluded cardiac arrhythmia). Count—summary score obtained by summing the number of Elixhauser comorbidities. Count4—categorical variable defined by the presence of 0, 1, 2, or ≥3 Elixhauser comorbidities.
Table 2 displays numerical performance measures for each model. The baseline model demonstrated poorest discrimination, followed closely by the Count and Count4 models. The Binary29, SID29, SID30, and VW score models had substantially better discriminative ability, with SID29 and SID30 slightly outperforming the VW score. Figure 2 depicts receiver-operating characteristic curves for the models. All pairs of c statistics were significantly different (all Bonferroni-adjusted P < 0.0001). Scaled Brier scores demonstrated similar patterns. Compared with the baseline model, the Binary29 model increased predicted probabilities in 61.3% of patients who died and decreased predicted probabilities in 73.4% of patients discharged alive, resulting in the highest NRI. The composite score models had much higher NRI than the Count and Count4 models.
Table 2. Performance Measures for Various Logistic Regression Models Where In-Hospital Mortality is the Outcome.
| c Statistic (95% CI) | Scaled Brier Score (95% CI) | Compared With Baseline Model | |||||
|---|---|---|---|---|---|---|---|
|
| |||||||
| NRI (95% CI) | Mortalities % Increased (p1,up) | Nonmortalities % Increased (p0,up) | Mortalities % Decreased (p1,down) | Nonmortalities % Decreased (p0,down) | |||
| Baseline | 0.724 (0.724–0.726) | 0.011 (0.009–0.014) | — | — | — | — | |
| Binary29 | 0.809 (0.808–0.810) | 0.037 (0.035–0.039) | 0.694 (0.687–0.700) | 61.3 | 26.6 | 38.7 | 73.4 |
| VW score | 0.793 (0.792–0.794) | 0.03 (0.028–0.032) | 0.624 (0.619–0.629) | 58.7 | 27.5 | 41.3 | 72.5 |
| SID30 | 0.804 (0.803–0.805) | 0.035 (0.033–0.037) | 0.673 (0.667–0.678) | 60.9 | 27.3 | 39.1 | 72.7 |
| SID29 | 0.802 (0.801–0.804) | 0.034 (0.032–0.036) | 0.652 (0.647–0.658) | 60.8 | 28.2 | 39.2 | 71.8 |
| Count | 0.745 (0.744–0.747) | 0.016 (0.015–0.018) | 0.352 (0.346–0.358) | 52.9 | 35.3 | 47.1 | 64.7 |
| Count4 | 0.737 (0.736–0.739) | 0.014 (0.012–0.016) | 0.469 (0.463–0.475) | 66.9 | 43.4 | 33.1 | 56.6 |
Predictors in the baseline model included age, sex, race, length of hospital stay, expected primary payer, and operation status. The other models that further adjusted for comorbidity included all predictors in the baseline model.
Let pi,up and pi,down (i = 0 for discharged alive, i=1 for in-hospital mortality) represent the proportion of patients whose predicted probabilities increased and decreased, respectively, in the comorbidity-adjusted model compared with the baseline model. NRI is given by: NRI = (p1, up−p1, down)+(p0,down−p0,up).
Binary29—all 29 Elixhauser comorbidities included as binary indicators.
VW score—weighted summary score derived by van Walraven.
SID30—weighted summary score derived in 2009 Maryland State Inpatient Database data using all 30 original Elixhauser comorbidities.
SID29—weighted summary score derived in 2009 Maryland State Inpatient Database data using 29 Elixhauser comorbidities (excludes cardiac arrhythmia).
Count—summary score obtained by summing the number of Elixhauser comorbidities.
Count4—categorical variable defined by the presence of 0, 1, 2, or ≥ 3 Elixhauser comorbidities.
CI indicates confidence interval; NRI, net reclassification improvement.
Figure 2.
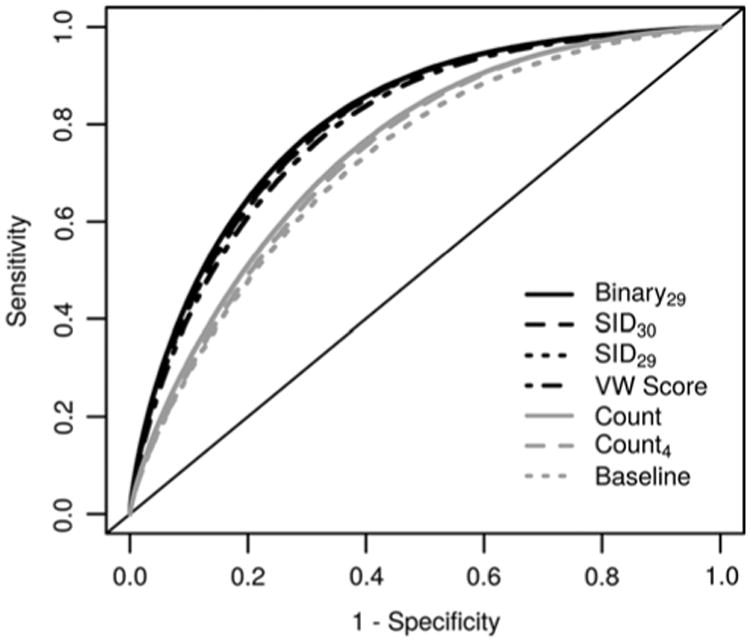
Receiver-operating characteristic (ROC) curves for logistic regression models predicting in-hospital mortality. Predictors in baseline model were age, sex, race, length of stay, expected primary payer, and occurrence of operation. Other models include the variables in the baseline model in addition to the specified comorbidity adjustment. Binary29— all 29 Elixhauser comorbidities included as binary indicators. VW score—weighted summary score derived by van Walraven. SID30—weighted summary score derived in 2009 Maryland State Inpatient Database data using all 30 original Elixhauser comorbidities. SID29—weighted summary score derived in 2009 Maryland State Inpatient Database data using 29 Elix-hauser comorbidities (excluded cardiac arrhythmia). Count— summary score obtained by summing the number of Elix-hauser comorbidities. Count4—categorical variable defined by the presence of 0, 1, 2, or ≥3 Elixhauser comorbidities.
Discussion
Using 2009 Maryland SID data, we rederived van Walraven's summary score for the original 30 and reduced set of 29 Elixhauser comorbidities. We examined the performance of various Elixhauser comorbidity adjustment techniques using 2009 NIS data. Several comorbidities had substantially higher prevalence in our population than in either van Walraven's or Elixhauser's population. Although these differences may be real, other reasons for these discrepancies may include changes in coding practices or structural changes in the populations analyzed. Our rederived weights remained fairly similar for 29 versus 30 comorbid-ities, but differed from van Walraven's weights.
Despite differences in comorbidity prevalence and derived weights, the VW score performed well in the 2009 NIS dataset. Our rederived scores performed only minimally better than the VW score on all performance measures. Models incorporating composite scores performed nearly as well as the Binary29 model. The Count and Count4 models had substantially poorer performance on all measures except calibration. The observed miscalibrations among low-risk patients (< 0.01 predicted probability) for the Binary29, VW score, SID29, and SID30 models were minimal.
The composite scores developed here or by van Walraven can be readily applied to administrative datasets by summing the assigned weights for each comorbidity present in the record. We include a SAS macro and R function to calculate the various composite scores (see text files, Supplemental Digital Contents 1 and 2, http://links.lww.com/MLR/A901 and http://links.lww.com/MLR/A902). The SID30 score had minimal but statistically significant better discrimination than the SID29 or VW scores in the 2009 NIS dataset. Researchers using the NIS data may wish to summarize comorbidity with the SID30 score; however, it is not clear whether the SID30 score would have superior performance in other datasets.
Our study has limitations. We modeled in-hospital mortality, whereas others32,33 have proposed that 30-day mortality represents a less-biased alternative. We derived our scores using statistical criteria; clinical knowledge is needed to determine each comorbidity's importance. Our summary scores were derived using administrative data and may not be applicable to studies involving primary or prospective data collection. Codes used to determine comorbidity may not accurately portray a patient's true comorbidity status.4 Some comorbidities were interrelated (range of c statistics for comorbidities regressed on the other 28, excluding CA: 0.61–0.85). Finally, our analysis was based on all inpatient admissions; the validity of composite scores within specific conditions requires further assessment.
Our use of a diverse population including 50 Maryland hospitals in 2009 to derive summary scores represents a strength of our study. Further, we used POA indicators to refine patients' comorbidity status and externally validated ours and van Walraven's summary scores in 2009 NIS data. To our knowledge, this is the first study to validate any Elixhauser summary score in US national inpatient data. Finally, we used multiple measures to provide a robust comparison of model performance.
van Walraven's composite score is valid in the NIS, despite being derived using all 30 original Elixhauser co-morbidities instead of the 29 currently available in the NIS. Our rederived scores similarly outperformed van Walraven's score by a small margin, implying that inclusion/exclusion of CA in summary score derivation matters little, even though CA was a strong predictor of in-hospital mortality. Models adjusting for comorbidity using composite scores substantially outperformed models using simple comorbidity counts that may not adequately adjust for comorbidity. Researchers wishing to summarize Elixhauser comorbidities with a single value should utilize van Walraven's score or those derived in this study.
Supplementary Material
Acknowledgments
The authors thank the Neurological Institute Center for Outcomes Research and Evaluation. They also thank Nancy Obuchowski for suggesting the use of various performance measures to compare models and Srividya Ramachandran for editorial assistance.
Footnotes
The authors declare no conflict of interest.
Supplemental Digital Content is available for this article. Direct URL citations appear in the printed text and are provided in the HTML and PDF versions of this article on the journal's Website, www.lww-medical care.com.
References
- 1.Kaplan MH, Feinstein AR. The importance of classifying comorbidity in evaluating the outcome of diabetes mellitus. J Chronic Dis. 1974;27:387–404. doi: 10.1016/0021-9681(74)90017-4. [DOI] [PubMed] [Google Scholar]
- 2.Elixhauser A, Steiner C, Harris DR, et al. Comorbidity measures for use with administrative data. Med Care. 1998;36:8–27. doi: 10.1097/00005650-199801000-00004. [DOI] [PubMed] [Google Scholar]
- 3.Charlson M, Pompei P, Ales KL, et al. A new method of classifying prognostic comorbidity in longitudinal studies: development and validation. J Chronic Dis. 1987;40:373–383. doi: 10.1016/0021-9681(87)90171-8. [DOI] [PubMed] [Google Scholar]
- 4.van Walraven C, Austin PC, Jennings A, et al. A modification of the Elixhauser comorbidity measures into a point system for hospital death using administrative data. Med Care. 2009;47:626–633. doi: 10.1097/MLR.0b013e31819432e5. [DOI] [PubMed] [Google Scholar]
- 5.Stukenborg G, Wagner D, Connors AJ. Comparison of the performance of two comorbidity measures, with and without information from prior hospitalizations. Med Care. 2001;39:727–739. doi: 10.1097/00005650-200107000-00009. [DOI] [PubMed] [Google Scholar]
- 6.Southern D, Quan H, Ghali W. Comparison of the Elixhauser and Charlson/Deyo methods of comorbidity measurement in administrative data. Med Care. 2004;42:355–360. doi: 10.1097/01.mlr.0000118861.56848.ee. [DOI] [PubMed] [Google Scholar]
- 7.Dominick KL, Dudley TK, Coffman CJ, et al. Comparison of three comorbidity measures for predicting health service use in patients with osteoarthritis. Arthritis Rheum. 2005;53:666–672. doi: 10.1002/art.21440. [DOI] [PubMed] [Google Scholar]
- 8.Lieffers JR, Baracos VE, Winget M, et al. A comparison of Charlson and Elixhauser comorbidity measures to predict colorectal cancer survival using administrative health data. Cancer. 2011;117:1957–1965. doi: 10.1002/cncr.25653. [DOI] [PubMed] [Google Scholar]
- 9.Yu DT, Black E, Sands KE, et al. Severe sepsis: variation in resource and therapeutic modality use among academic centers. Crit Care. 2003;7:R24–R34. doi: 10.1186/cc2171. [DOI] [PMC free article] [PubMed] [Google Scholar]
- 10.Shetty K, Bhattacharya J. Changes in hospital mortality associated with residency work-hour regulations. Ann Intern Med. 2007;147:73–80. doi: 10.7326/0003-4819-147-2-200707170-00161. [DOI] [PubMed] [Google Scholar]
- 11.Dailiana Z, Papakostidou I, Varitimidis S, et al. Surgical treatment of hip fractures: factors influencing mortality. Hippokratia. 2013;17:252–257. [PMC free article] [PubMed] [Google Scholar]
- 12.Carney CP, Jones L, Woolson RF. Medical comorbidity in women and men with schizophrenia: a population-based controlled study. J Gen Intern Med. 2006;21:1133–1137. doi: 10.1111/j.1525-1497.2006.00563.x. [DOI] [PMC free article] [PubMed] [Google Scholar]
- 13.Brasel KJ, Guse CE, Layde P, et al. Rib fractures: relationship with pneumonia and mortality. Crit Care Med. 2006;34:1642–1646. doi: 10.1097/01.CCM.0000217926.40975.4B. [DOI] [PubMed] [Google Scholar]
- 14.Dumont TM, Tranmer BI, Horgan MA, et al. Trends in neurosurgical complication rates at teaching vs nonteaching hospitals following duty-hour restrictions. Neurosurgery. 2012;71:1041–1046. doi: 10.1227/NEU.0b013e31826cdd73. [DOI] [PubMed] [Google Scholar]
- 15.Austin SR, Wong YN, Uzzo RG, et al. Why summary comorbidity measures such as the Charlson comorbidity index and Elixhauser score work. Med Care. 2013;00:1–8. 23. doi: 10.1097/MLR.0b013e318297429c. [DOI] [PMC free article] [PubMed] [Google Scholar]
- 16.Agency for Healthcare Research and Quality. Rockville, MD: [Accessed November 13, 2013]. Available at: http://www.ahrq.gov/cpi/about/index.html. [Google Scholar]
- 17.Version 35 Healthcare Cost and Utilization Project (HCUP) Rockville, MD: Agency for Healthcare Research and Quality; 2009. [Accessed November 13, 2013]. HCUP Comorbidity Software [computer program] Available at: http://www.hcup-us.ahrq.gov/toolssoftware/comorbidity/comorbidity.jsp. [Google Scholar]
- 18.Farrar DE, Glauber RR. Multicollinearity in regression analysis. Rev Econ Stat. 1967;49:92–107. [Google Scholar]
- 19.United States Census Bureau. [Accessed December 10, 2013]; Available at: https://www.census.gov.
- 20.Sullivan LM, Massaro JM, D'Agostmo RB. Presentation of multivariate data for clinical use: the Framingham study risk score functions. Stat Med. 2004;23:1631–1660. doi: 10.1002/sim.1742. [DOI] [PubMed] [Google Scholar]
- 21.Tsai J, Abe K, Boulet SL, et al. Predictive accuracy of 29-comorbidity index for in-hospital deaths in US adult hospitalizations with a diagnosis of venous thromboembolism. PLoS One. 2013;8:e70061. doi: 10.1371/journal.pone.0070061. [DOI] [PMC free article] [PubMed] [Google Scholar]
- 22.Healthcare Cost and Utilization Project (HCUP) Rockville, MD: Agency for Healthcare Research and Quality; 2013. HCUP Procedure Classes. Available at: http://www.hcup-us.ahrq.gov/toolssoftware/procedure/procedure.jsp. [PubMed] [Google Scholar]
- 23.Lumley T. Analysis of complex survey samples. J Stat Softw. 2004;9:1–19. [Google Scholar]
- 24.Lumley T. Survey: analysis of complex survey samples. [Accessed December 15, 2014];2012 Available at: http://cran.r-project.org/web/packages/survey/index.html.
- 25.Hu B, Palta M, Shao J. Properties of R(2) statistics for logistic regression. Stat Med. 2006;25:1383–1395. doi: 10.1002/sim.2300. [DOI] [PubMed] [Google Scholar]
- 26.Steyerberg EW, Vickers AJ, Cook NR, et al. Assessing the performance of prediction models: a framework for traditional and novel measures. Epidemiology. 2010;21:128–138. doi: 10.1097/EDE.0b013e3181c30fb2. [DOI] [PMC free article] [PubMed] [Google Scholar]
- 27.Pencina MJ, D'Agostino RB, Sr, D'Agostino RB, Jr, et al. Evaluating the added predictive ability of a new marker: from area under the ROC curve to reclassification and beyond. Stat Med. 2008;27:157–172. doi: 10.1002/sim.2929. [DOI] [PubMed] [Google Scholar]
- 28.Pencina MJ, D'Agostino RB, Vasan RS. Comments on “integrated discrimination and net reclassification improvements—practical advice”. Stat Med. 2008;27:207–212. [Google Scholar]
- 29.Pencina MJ, Steyerberg EW, D'Agostino RB. Extensions of net reclassification improvement calculations to measure usefulness of new biomarkers. Stat Med. 2011;30:11–21. doi: 10.1002/sim.4085. [DOI] [PMC free article] [PubMed] [Google Scholar]
- 30.Harrell FE., Jr Hmisc: Harrell Miscellaneous. [Accessed December 15, 2014];2013 Available at: http://cran.r-project.org/package=Hmisc.
- 31.R Core Team. A Language and Environment for Statistical Computing [computer program], version 301. Vienna, Austria: R Foundation for Statistical Computing; 2013. [Google Scholar]
- 32.Lezzoni LI. Risk Adjustment for Measuring Health-Care Outcomes. 3rd. Chicago, IL: Health Administration Press; 2003. [Google Scholar]
- 33.Volpp KG, Rosen AK, Rosenbaum PR, et al. Mortality among hospitalized Medicare beneficiaries in the first 2 years following ACGME resident duty hour reform. JAMA. 2007;298:975–983. doi: 10.1001/jama.298.9.975. [DOI] [PubMed] [Google Scholar]
Associated Data
This section collects any data citations, data availability statements, or supplementary materials included in this article.