Abstract
We have developed a new table-top technique for collecting wide-field Fourier transform infrared (FTIR) microscopic images by combining a femtosecond pulse shaper with a mid-IR focal plane array. The pulse shaper scans the delay between a pulse pair extremely rapidly for high signal-to-noise, while also enabling phase control of the individual pulses to under-sample the interferograms and subtract background. Infrared absorption images were collected for a mixture of W(CO)6 or Mn2(CO)10 absorbed polystyrene beads, demonstrating that this technique can spatially resolve chemically distinct species. The images are sub-diffraction limited, as measured with a USAF test target patterned on CaF2 and verified with scalar wave simulations. We also find that refractive, rather than reflective, objectives are preferable for imaging with coherent radiation. We discuss this method with respect to conventional FTIR microscopes.
OCIS codes: (110.4234) Multispectral and hyperspectral imaging; (300.6300) Spectroscopy, Fourier transforms; (300.6340) Spectroscopy, infrared; (320.5540) Pulse shaping; (110.3080) Infrared imaging; (110.4980) Partial coherence in imaging
1. Introduction
The structural sensitivity of Fourier transform infrared (FTIR) vibrational spectroscopy has long made it an attractive candidate as a microscopic contrast agent. The only requirement for detection is an infrared active chemical bond, which means that molecular systems intrinsically possess the labels necessary for chemical imaging. For this reason, researchers have worked for decades to develop imaging in the mid-infrared [1–4]. Most of that work has relied on thermal sources, whose low fluxes limit the signal-to-noise that can be obtained. With a weak source, improvements in signal-to-noise can only be made at the cost of spatial resolution [5]. Synchrotron sources are ~1000 brighter and so provide better signal-to-noise while maintaining high resolution [6,7]. The ideal light source would be as widely available as a thermal source and as bright as a synchrotron.
In the last few years, large advances have been made in table top femtosecond lasers that can now generate mid-IR light with fluxes comparable to synchrotrons. The repetition rates of these sources (typically 1-5 kHz) make them compatible with the readout rates now possible with focal plane arrays (FPA) made of mercury cadmium telluride (MCT). With an FPA, it is possible to measure continuous images over a large area, as compared to spatially scanning an area using a single point detector.
To generate an IR spectral image with an FPA, one can scan the laser wavelength, as has recently been done using quantum cascade lasers [3], or create an interferogram and scan its delay as is done in an FTIR microscope. In the FTIR approach, a Michelson or similar interferometer is used to create two overlapping infrared beams and then mechanically translate a leg of the interferometer to scan the relative delay. Mid-infrared pulse shapers now make it possible to control the time and frequency profiles of mid-IR light so that pulse sequences for creating interferograms can be computer generated [8–10]. Optical pulse-shaping has been used in CARS and two-photon imaging [11,12]. Mid-IR pulse shaping was recently used to obtain near-diffraction limited 2D IR images by point-to-point scanning [13]. A pulse shaper using a Ge acousto-optic modulator has no moving parts and so can instantaneously set the interferometric delay to any value within its resolution. In addition, the phase of the pulses that generate the interferogram can be set independent of the delay, which enables sub-Nyquist sampling and background subtraction, with a scan rate set by the repetition rate of the laser.
In this article, we combine the high power of a table top IR source with mid-IR pulse shaping and multiplexed FPA detection to measure wide-field, sub-diffraction limited, FTIR images. We explore chemical imaging using a sample of metal-carbonyl compounds absorbed in polystyrene beads and determine the resolution using a standard USAF test target. We demonstrate background subtraction and rotating frame data collection using phase cycling. We also compare the spectral images collected with coherent and diffuse radiation.
2. Methods
2.1 Instrument layout
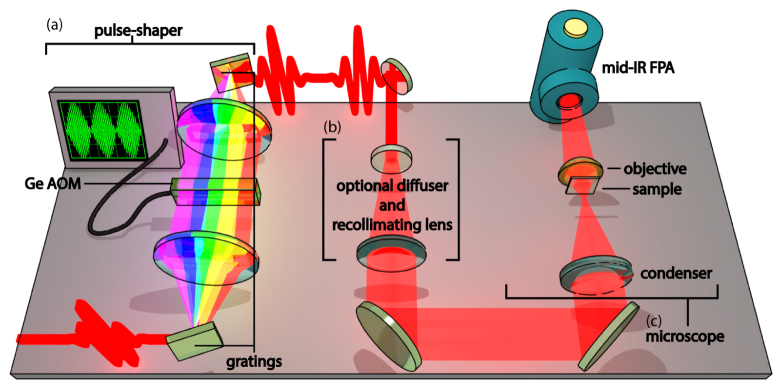
The layout of our instrument is shown in Fig. 1. The methods used for pulse shaping are based on those described previously in [14]. Briefly, 100 fs mid-IR pulses, centered at 5 μm and generated by difference frequency generation in AgGaS2 from the outputs of an optical parametric amplifier (TOPAS, Light Conversion) pumped by a 1 kHz amplified Ti:Sapphire laser (Libra, Coherent Libra), are modulated in the frequency domain using a 4f-geometry Ge AOM based shaper to generate double pulses which are then directed into a home built transmissive microscope. The microscope consists of a 150 mm focal length CaF2 spherical lens (Thor Labs) used as the condenser to focus the beam in front of the sample, which then expands over a distance of ~6 mm to the size of the region of the sample to be imaged, thereby providing uniform illumination. For images presented herein, a 12.5 mm focal length, 0.7 NA, aspherical ZnSe lens (Edmund Optics) is used as an objective to map an image of the sample onto a 128128 MCT mid-IR FPA, which is placed either 150 or 440 mm away in order to generate either 12 × or 36 × images, respectively. For comparison purposes, measurements were also performed using a finite corrected 74x, 0.65 NA Schwarzschild type reflective objective (ReflX, Edmund Optics).
Fig. 1.
Diagram of the experimental setup showing the (a) Ge-AOM based pulse shaper, (b) the optional diffuser/recollimating device used for incoherent imaging and (c) the microscope.
We also report images using a 2 mm thick CaF2 diffuser made either with 240 grit sand paper, or by sandblasting with 36 grit beads (PIKE Technologies). The diffuser was placed after the shaper to degrade the coherence of the laser beam [15]. If the diffuser is used, the beam is recollimated by adding a 150 mm focal length CaF2 lens, with a 20 mm focal length, 0.3 NA, CaF2 lens (Thor Labs) acting as a condenser. The diffuser was placed in a motorized rotating mount and rotated at ~2 Hz.
The 128128 mid-IR FPA was read out at the repetition rate of the laser, using a Teledyne Xcelera PCIe frame-grabber. During acquisition, the frame grabber is triggered by the pulse shaper to collect 40k frames, which are written directly to memory before being averaged and saved, after which the frame-grabber resets to read another trigger. This method results in a drop in duty cycle of about 5% during the processing of the memory buffer but allows for data acquisition over indefinitely long periods of time.
A negative chrome USAF resolution pattern, etched on CaF2 (Max Levy Autograph) was used to measure the spatial resolution of the optical system.
2.3 Numerical simulations
All numerical simulations and calculations were performed using custom MATLAB codes. Simulated images of the USAF test target were carried out in the Fresnel diffraction limit. A detailed description of the theoretical methods can be found in the Appendix.
2.4 Sample preparation
Two samples of Polystyrene beads (106-125 μm, Polysciences Inc.) with absorbed metal-carbonyl compounds were prepared, one using W(CO)6 as the absorbate and the other Mn2(CO)10. The beads were swelled in a saturated chloroform solution of the absorbate for 2 hours. Following this, the two samples were diluted into methanol, spun down, washed in methanol, mixed in a 1:1 ratio, and dried under nitrogen before being suspended in water and deposited between two CaF2 windows (2 mm and 0.5 mm thick, Crystran Ltd.) with a 100 μm Teflon spacer. Beads saturated with W(CO)6 have optical densities of about 0.8.
3. Results and discussion
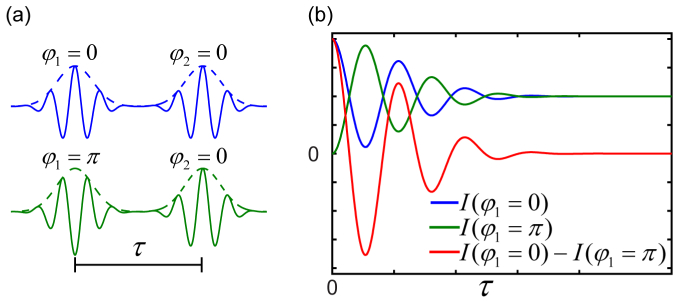
Computer control of the phase and amplitude of the acoustic wave in the Ge crystal of the shaper was used to generate a pair of pulses with a well-defined time-delay and relative phase, as shown in Fig. 2. The pulse sequence is updated at the laser repetition rate, enabling rapid acquisition, background subtraction and unambiguous undersampling. To illustrate, consider the intensity measured from a monochromatic component of the field:
| (1) |
where is the imposed delay between the two fields, with the relative phase of the first and second pulses, , controlling the phase of the cross term between the pulses. Using a 2-frame phase cycling scheme, every value was generated twice, once with a relative phase of 0 and then again with a phase change of , as seen in Fig. 2(a). The difference between adjacent data points could then be taken to give the interferogram alone:
| (2) |
as illustrated in Fig. 2(b). Thus, this 2-frame phase cycling scheme removes the background of the laser pulses themselves every other laser shot, improving signal to noise by a factor of ~2.
Fig. 2.
(a) Illustration of shaped pulse pairs with relative phase shifts of zero (blue) and π (green). (b) Simulated interferograms for the two cases depicted in (a), according to color, along with their difference (red). Subtracting the phase cycled interferograms doubles the interference signal while removing the laser background.
In addition to the phase shifts, the phase of the moving pulse,, was also controlled to manipulate the apparent frequency of the measured interferograms. By making , the apparent carrier-wave frequency of the interferogram can be shifted to any desired value. To demonstrate, Fig. 3 shows three measured interferograms using different values of the rotating frame frequency,, and their Fourier transforms. The carrier-wave can be shifted all the way to zero-frequency, leaving only the envelope. The envelope is the important quantity to know, because it, not the carrier frequency, contains the interferences that create the amplitudes, peak spacings, and linewidths in the final FTIR spectrum. After Fourier transformation, the frequency axis is corrected by adding back . By shifting the carrier frequency, fewer data points are needed to sample the interferogram so that it can be collected more quickly with no risk of aliasing, which has been shown to improve signal-to-noise in 2D IR experiments [16].
Fig. 3.
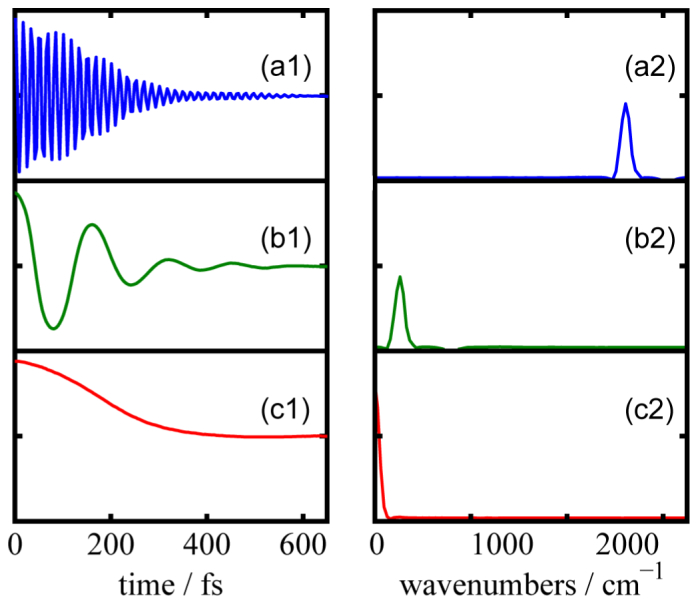
(a1-c1) Measured one-sided interferograms, generated using rotating frame frequencies of (a) 0 (b) 1800 and (c) 2000 cm−1, along with their respective Fourier transforms (a2-c2). Phase cycling shifts the apparent carrier frequency so that fewer data points are needed to sample the interferogram.
For all the measured FTIR images in this study, a rotating frame frequency of 1800 cm−1 was used, and one-sided interferograms were collected using 2-frame phase cycling, 50 fs steps, to a final delay of 8.5 ps, giving a spectral resolution of 0.5/[2.99 × 1010(cm/s) × 8.5 × 10⁻¹²s] = 1.8 cm−1. Averaging times for the samples and test targets presented here were ~30 and ~10 minutes, respectively. Thus, the interferogram was sampled with 170 delays, whereas one would need about 1200 delays to sample at the fundamental frequency if one could not collect in the rotating frame. Measuring all of the delays faster results in better signal-to-noise [16].
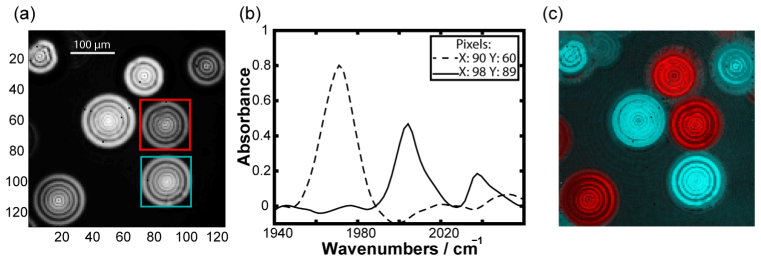
Shown in Fig. 4 are images of polystyrene beads labeled with either W(CO)6 or Mn2(CO)10 metal-carbonyls at 12 × magnification. Figure 4(a) plots an image of the integrated transmitted IR intensity and so has no frequency resolution. The polystyrene beads are visible as concentric rings of light. The beads are visible because the optical density of the surrounding water is higher than that of the beads, but this does not present a problem in extracting absorption spectra of the metal-carbonyls because the water spectrum is broad and featureless in this frequency range. Shown in Fig. 4(b) are absorption spectra measured at the pixels indicated, which are for beads enclosed in the cyan and red boxes. Absorbances were calculated by referencing to a region on the same image containing only water, and a third order polynomial fit was used to remove the water absorbance. One spectrum has a peak at 1971 cm−1 while the other has peaks at 2004 and 2038 cm−1. These spectra correspond to W(CO)6 and Mn2(CO)10, respectively. Using these frequencies, it is straightforward to identify which beads contain W(CO)6 or Mn2(CO)10, as shown by the false color images in Fig. 4(c) plotted for the absorbance measured at 1971 cm−1 (red) and 2004 cm−1 (cyan), respectively. Notice that there is no correlation between the intensity of the beads in the integrated intensity image of Fig. 4(a) and the false color image; frequency specificity is needed to identify the chemical composition of each bead.
Fig. 4.
Images of a mixture of Mn2(CO)10 or W(CO)6 soaked polystyrene beads suspended in water. (a) Transmitted IR light image of bead sample. (b) Fourier transform infrared (FTIR) absorption spectra of different beads, as indicated by pixel numbers. (c) False color FTIR absorption image. The W(CO)6 (1971 cm−1) absorption is mapped to red while the Mn2(CO)10 (2004 cm−1) is colored in cyan.
We note that the frequencies of W(CO)6 or Mn2(CO)10 are slightly red shifted by 4-12 cm−1 from previous measurements of these compounds in aprotic solvents [14,17], which we attribute to differences in hydration. Support for this claim can be seen in the baseline. The two dips in the baseline of the W(CO)6 spectrum between 1990 and 2040 cm−1 are not due to poor signal to noise, but rather to Mn2(CO)10 that has dissolved into the water and thus has a slight absorbance in the region used as a reference.
The concentric ring pattern visible within each bead is due to the spatial coherence of the laser source used in these measurements and represent a combination of diffraction and refraction effects coming from the transmissive and highly spherical beads [18]. We have also collected incoherent images by adding a rotating diffuser system, following Kole et al. [19], to lower the spatial coherence of our beam as described in Methods above. In Fig. 5, FTIR absorption images of a W(CO)6-containing polystyrene bead collected with and without the rotating diffuser show that we can eliminate coherent fringes by rotating at ~2 Hz while maintaining the same averaging time. Interestingly, the absorption signal integrated over the entire bead for the two experiments are the same within 5%. It is often assumed that coherent imaging is inferior to incoherent imaging for resolving objects near the diffraction limit [20], although fringe features in the image might be exploitable in future experiments for holographic generation of 3 dimensional distributions of chemical species [21]. Nonetheless, these measurements show that high quality coherent or incoherent images can both be collected with our setup.
Fig. 5.
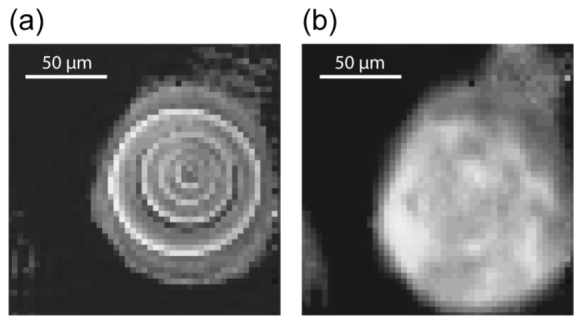
FT-IR absorption images of a bead containing W(CO)6 measured at 1970 cm−1 with (a) no diffuser and (b) a rotating diffuser.
At a magnification of 12 × , the images in Fig. 4 span 422 × 422 μm2 with each pixel covering 3.3 × 3.3 μm2. At that magnification, each pixel is larger than the best possible spatial resolution. To quantify the spatial resolution of our microscope, we increased the magnification to sample the largest possible spatial frequency of the field, which is fixed by the numerical aperture of the objective and λ to be ν = (7 μm)−1. The Nyquist sampling theorem demands pixels spaced at 1/(ν × 2), or 3.5 μm, though oversampling by a factor of ~4 (or 8 pixels per airy disk) is a more conservative limit that accounts for pixel size and image contrast [22]. We performed numerical calculations (see Appendix) to conclude that an oversampling rate of ~6 pixels per Airy disk is sufficient to provide contrast of >20% at the distance specified by the Rayleigh criterion. We therefore chose an effective pixel size of 1.1 μm, meaning a magnification of 36 × , to measure our resolution. The high spatial coherence of our laser beam makes resizing of our illuminated region to the new 140 × 140 μm2 area easily attainable, even in the case where a diffuser is used to make the beam partially incoherent (throughput of the microscope is high enough that, in all experiments, the shaper output was attenuated by >50% to avoid detector saturation), and absorption images of the beads are readily collected at this higher spatial resolution (data not shown).
With 36 × magnification in place, transmission images of the group 7 elements of a USAF resolution pattern on CaF2 are shown in Fig. 6(a) for a rotating diffuser experiment and Fig. 6(b) for a fully incoherent scalar-wave simulation performed using an idealized optical setup (see Appendix for details). The 1951 USAF resolution test chart is a common standard for imaging systems, where resolution is determined by the smallest element that gives better than 20% contrast between the minimum between two lines and the line intensity. From the cut through the group 7 elements, in Fig. 6(c), for the experiment (blue points), it can be seen that our microscope achieves a resolution of 3.11 μm. Interestingly, our experiment clearly outperforms the resolution predicted by the simulation (red curve). Comparison of our resolution to the Rayleigh criterion for our experimental conditions, 0.61 × λ/NA = 4.3 μm [23], shows that we exceed the classical diffraction limit for incoherent imaging by a significant amount.
Fig. 6.
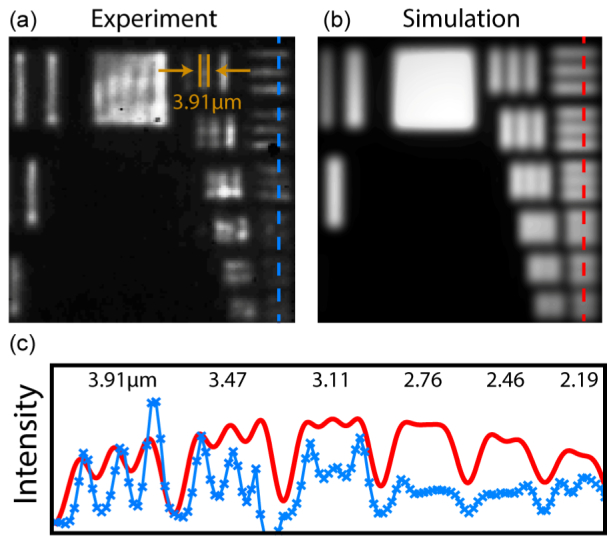
Experimental and simulated transmission images of group 7 of a USAF resolution pattern at λ = 5 μm. (a) Experimental image using a rotating diffuser and (b) a simulated image using incoherent illumination. (c) Cuts through the resolution elements in the experiment (blue) and simulation (red) labeled with element linewidths, as indicated by the dashed lines in (a) and (b).
Sub-diffraction imaging has been seen previously in synchrotron-based FTIR microscopy [24]. That work attributed sub-diffraction resolution to the mode quality created by a Schwarzschild objective, which we discuss below. Another factor that could create sub-diffraction resolution is the partial coherence of the laser beam, which has also been discussed with regard to synchrotron sources [25,26].
To explore the effects that a reflective objective would have on our coherent imaging system, we used a 74 × , 0.65 NA reflective objective to image our USAF resolution pattern. The major difference between refractive and reflective objectives like a Schwazchild objective is that the latter uses a small convex mirror that obscures light near the center of the aperture, effectively putting a high-pass filter on the images it forms. Simulated point-spread-functions for refractive (blue) and reflective (green) objectives with the same numerical aperture are shown in Fig. 7(a). The central (zero order) distribution of the reflective object is narrower for the reflective objective, while the diffraction wings are larger. As an illustration, Fig. 7 (b-c) shows simulated coherent images of group 6, element 1 (7.8 μm width lines), for both the refractive and reflective case. The wings cause large amplitude modulations in the image. Experimentally, we found that these effects were too severe from the reflective objective to produce high-quality images near the diffraction limit, even when using the rotating diffuser (not shown). From these simulated and experimental results we can conclude that, for the case of a highly spatially coherent source, refractive objectives are preferable for high resolution imaging.
Fig. 7.
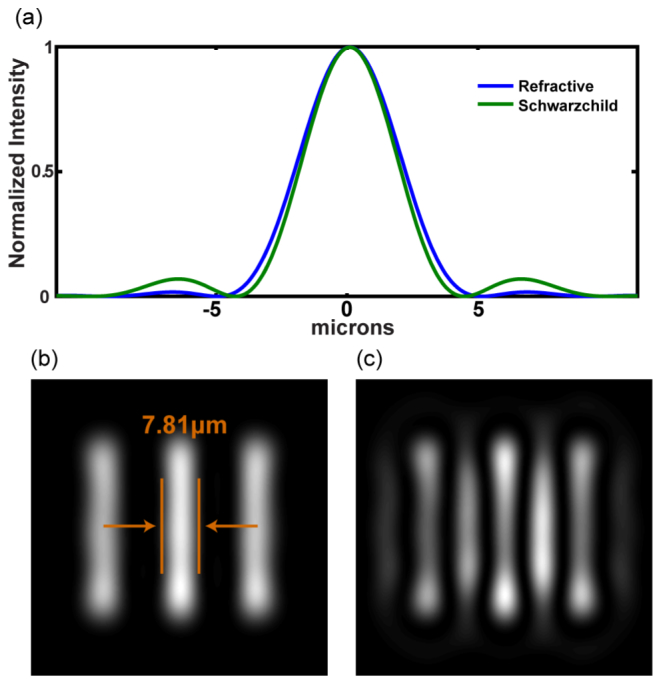
(a) A cut through the simulated intensity point-spread-function for a refractive (blue) and a Schwarzchild (green) objective, the later using a central obscuration 0.2 times the size of the outer diameter. Simulated images of Group 6 element 1 for (b) a refractive and (c) Schwarzchild objective.
We have also compared our signal-to-noise to that reported by Hughes et al. who used a similar imaging setup and FPA, but with a glow-bar rather than a laser for the mid-IR source. They obtained a signal-to-noise ratio of 42 for an 8 minute acquisition. The estimated root mean squared noise level of our microscope without the diffuser, based on the 100% level line method [27], referenced against a pixel in the same image, for a 40 second acquisition is 3.4%. With this noise level, we get a signal-to-noise ratio of ~100 under the same conditions. The single biggest source of noise in our data is from the shot-to-shot fluctuations of the laser, which are much larger than the glow-bar. The signal-to-noise might be further improved with a more stable laser, or more sophisticated pulse sequences such as with non-sequential delays to reduce correlated noise, or narrow band frequency scanning measurements when only a narrow spectral range is of interest [14,19,28].
Perhaps the greatest disadvantage to using a fs laser based FT-IR microscope comes in regards to spectral bandwidth. Common table top mid-IR laser systems are tunable between 3 and 8 μm, but only deliver about 300 cm−1 of spectral bandwidth at one time. That being said, great strides have been made in recent years in the development of continuum lasers, and next generation mid-IR sources will likely become competitive with thermal FTIR sources in regards to bandwidth [29–31]. If a high quality supercontinuum IR laser source became available, the factors limiting the spectral range of our instrument would become dispersion in the transmissive optics [32] and the number of spectral elements (i.e. bandwidth) of the shaper [33].
4. Conclusions
We have presented a new technique for performing wide-field FTIR microscopy using a table top laser source, a mid-IR pulse shaper, and an MCT FPA. Our optical design takes advantage of the large energies and high spatial coherence of a femtosecond laser source to produce a microscope with high throughput, even when using a diffuser to produce partially incoherent signals similar to those measured in traditional glow-bar based FTIR microscopes. We showed that with our method we can perform shot-to-shot background elimination and unambiguous undersampling of delays to allow rapid scanning, producing chemical images with high signal-to-noise in minutes. We also demonstrated that our optical system achieves diffraction limited resolution using conventional refractive optics.
There are roughly 2000 femtosecond laser systems worldwide that could be modified into the instrument reported here. In addition, the use of femtosecond laser pulses opens the door to new directions for wide-field IR microscopy. Chemical, materials or biological events could be triggered and then monitored with sub-picosecond time-resolution. Variations analogous to step-scan FTIR spectroscopy might be performed but with improved time-resolution. Additional pulses would enable ultrafast 2D IR spectra to be collected from which vibrational couplings, energy transfer kinetics, and solvent dynamics could all be measured, as is beginning to be explored by Baiz et al. with point-to-point 2D IR imaging [13]. One of the biggest challenges with IR imaging is scatter from inhomogeneous samples, which causes phase artifacts in conventional experiments [34]. The potential for phase cycling to remove these artifacts using pulse shaping represents a new opportunity to study these systems.
Acknowledgments
Research reported in this publication was supported by the National Institute of General Medical Sciences of the National Institutes of Health under Award Number R01GM102387. ALS is supported by a Diversity Supplement to NIH NIDDK 79895. MTZ is co-owner of PhaseTech Spectroscopy which manufactures mid-IR pulse shapers and markets FPA detectors.
5. Appendix: numerical methods
In order to choose an effective pixel size to adequately sample images at the diffraction limit, we simulated the effect of pixilation on two Airy patterns overlapping at the distance defined by the Rayleigh criterion by convoluting the pattern with a square window set to different fractions of the Airy disk diameter, as can be seen in Fig. 8
Fig. 8.
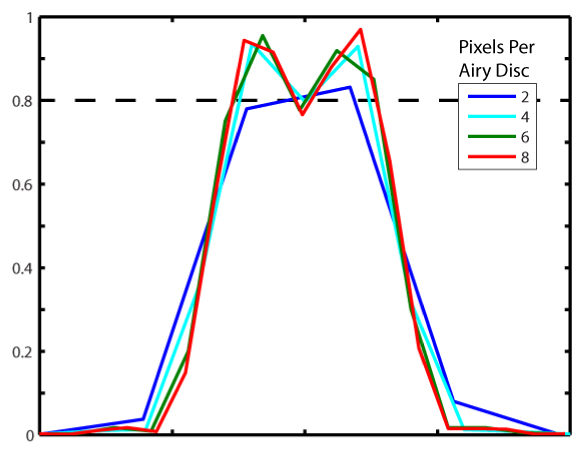
Two overlapping Airy patterns set to the distance defined by the Rayleigh criterion, convoluted with windows of different size to simulate pixilation
. We found that a sampling rate of 6 pixels per Airy pattern was sufficient to give better than 20% contrast.
We employed a scalar-wave Fourier optics approach to simulate the action of the microscope and sample on the input light. The simulated microscope is pictured in Fig. 9
Fig. 9.
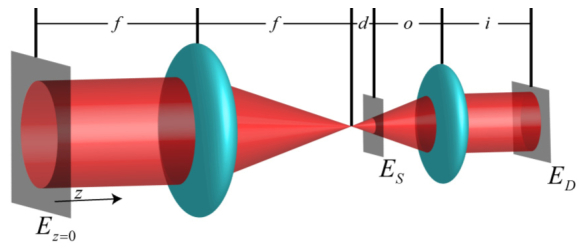
Scheme of the simulated optical system.
, where a condenser lens of focal length focuses the laser light down at a distance before the sample, after which it illuminates the sample with a diverging wave-front, and finally the field is imaged onto the detector with the objective lens.
Following Reddy et al. [35], we use Dirac notation to simplify the spectral decomposition of the field, where the scalar amplitude of the electric field,, in some plane perpendicular to the optical axis, z, can be described by the projection of a state vector, , onto either the real-space basis vectors , i.e. , or the plane wave basis, , i.e. , where is the Fourier transform of . For a monochromatic plane wave, is just the projection of the wave-vector onto the plane perpendicular to the optical axis and is called the spatial frequency, so that free-space propagation in the z direction can be described by:
| (3) |
where is the effective wavelength along z of the plane wave .
Making the Fresnel (small angle) approximation ():
| (4) |
where a constant phase factor and the integration limits have been dropped for clarity. From Eq. (4), it becomes straightforward to express propagation in real-space by use of the identity operator, :
| (5) |
By the convolution theorem, Eq. (3) becomes:
| (6) |
By projecting onto, Eq. (6) becomes the Fresnel diffraction equation. Thus, the free-space propagator,, can now be expressed in either the spatial frequency or real-space bases:
| (7) |
| (8) |
The action of an ideal lens of focal length on the field front is expressed by the operator:
| (9) |
where is the aperture of the lens.
Using these operators, and treating the sample as a linear transmissive mask,, the field incident on the detector can be expressed as:
| (10) |
Two special cases of a lens operator sandwiched between two propagators can be used to greatly simplify Eq. (10), as evaluating the propagators directly for high numerical aperture systems can become computationally impractical. The first case propagates the field from one focal length before the condenser lens to one focal length after:
| (11) |
By making the substitution :
| (12) |
Using Eq. (5), and substituting back for:
| (13) |
Meaning that the field at the lens focus is just the convolution of the Fourier transforms of the field at with the aperture, scaled by
The second special case concerns the formation of an in-focus image of the sample onto the detector:
| (14) |
Using Eq. (6):
| (15) |
After expanding the quadratic terms, applying the thin lens formula (), and rearranging the order of integration, Eq. (15) becomes:
| (16) |
Recognizing the right-most integral in Eq. (14) as a Fourier transform:
| (17) |
Where M is the magnification of the image at the detector (). This shows that, neglecting a quadric phase across the wave front, the field incident on the detector is a convolution of the magnified image with , which is often called the coherent point spread function, or PSF.
Eq. (15) completes the set of operations we need to be able to simulate the experimental scenario depicted in Fig. 9, which is expressed in the equation:
| (18) |
Where , which operates on the field at the focus of the condenser lens in order to propagate it to the sample, remains the only explicit integration of the Fresnel diffraction equation. Since the size scale at the focus,, compares well to the region illuminated on the sample, , such an integration is not as computationally taxing as it would have been to explicitly propagate the field along the other distances, and .
For an experiment using square-law detection, the measured quantity is the magnitude of the field squared, integrated over a long time period relative to the dynamic properties of the field:
| (19) |
The loss of phase information of the field upon detection has important consequences on the effect of spatial coherence on the measurement. In the limiting case of a fully coherent wave front:
| (20) |
For the completely incoherent case, all cross terms between field components originating from different parts of the sample vanish, and the intensity simplifies to:
| (21) |
meaning that, in the incoherent case, the effective PSF is the square of the coherent PSF, and the signal can, in principle, be directly deconvoluted without the need for phase retrieval [36].
References and links
- 1.Lewis E. N., Treado P. J., Reeder R. C., Story G. M., Dowrey A. E., Marcott C., Levin I. W., “Fourier transform spectroscopic imaging Using an infrared focal-plane array detector,” Anal. Chem. 67(19), 3377–3381 (1995). 10.1021/ac00115a003 [DOI] [PubMed] [Google Scholar]
- 2.Snively C. M., Katzenberger S., Oskarsdottir G., Lauterbach J., “Fourier-transform infrared imaging using a rapid-scan spectrometer,” Opt. Lett. 24(24), 1841–1843 (1999). 10.1364/OL.24.001841 [DOI] [PubMed] [Google Scholar]
- 3.Yeh K., Kenkel S., Liu J.-N., Bhargava R., “Fast infrared chemical imaging with a quantum cascade laser,” Anal. Chem. 87(1), 485–493 (2015). 10.1021/ac5027513 [DOI] [PMC free article] [PubMed] [Google Scholar]
- 4.Hughes C., Henderson A., Kansiz M., Dorling K. M., Jimenez-Hernandez M., Brown M. D., Clarke N. W., Gardner P., “Enhanced FTIR bench-top imaging of single biological cells,” Analyst (Lond.) 140(7), 2080–2085 (2015). 10.1039/C4AN02053G [DOI] [PubMed] [Google Scholar]
- 5.Bhargava R., “Infrared spectroscopic imaging: the next generation,” Appl. Spectrosc. 66(10), 1091–1120 (2012). 10.1366/12-06801 [DOI] [PMC free article] [PubMed] [Google Scholar]
- 6.Jamin N., Dumas P., Moncuit J., Fridman W. H., Teillaud J. L., Carr G. L., Williams G. P., “Highly resolved chemical imaging of living cells by using synchrotron infrared microspectrometry,” Proc. Natl. Acad. Sci. U.S.A. 95(9), 4837–4840 (1998). 10.1073/pnas.95.9.4837 [DOI] [PMC free article] [PubMed] [Google Scholar]
- 7.Baker M. J., Trevisan J., Bassan P., Bhargava R., Butler H. J., Dorling K. M., Fielden P. R., Fogarty S. W., Fullwood N. J., Heys K. A., Hughes C., Lasch P., Martin-Hirsch P. L., Obinaju B., Sockalingum G. D., Sulé-Suso J., Strong R. J., Walsh M. J., Wood B. R., Gardner P., Martin F. L., “Using Fourier transform IR spectroscopy to analyze biological materials,” Nat. Protoc. 9(8), 1771–1791 (2014). 10.1038/nprot.2014.110 [DOI] [PMC free article] [PubMed] [Google Scholar]
- 8.Kaindl R. A., Wurm M., Reimann K., Hamm P., Weiner A. M., Woerner M., “Generation, shaping, and characterization of intense femtosecond pulses tunable from 3 to 20 μm,” J. Opt. Soc. Am. B 17(12), 2086 (2000). 10.1364/JOSAB.17.002086 [DOI] [Google Scholar]
- 9.Witte T., Zeidler D., Proch D., Kompa K. L., Motzkus M., “Programmable amplitude- and phase-modulated femtosecond laser pulses in the mid-infrared,” Opt. Lett. 27(2), 131–133 (2002). 10.1364/OL.27.000131 [DOI] [PubMed] [Google Scholar]
- 10.Shim S.-H., Strasfeld D. B., Fulmer E. C., Zanni M. T., “Femtosecond pulse shaping directly in the mid-IR using acousto-optic modulation,” Opt. Lett. 31(6), 838–840 (2006). 10.1364/OL.31.000838 [DOI] [PubMed] [Google Scholar]
- 11.Dudovich N., Oron D., Silberberg Y., “Single-pulse coherently controlled nonlinear Raman spectroscopy and microscopy,” Nature 418(6897), 512–514 (2002). 10.1038/nature00933 [DOI] [PubMed] [Google Scholar]
- 12.Ogilvie J. P., Débarre D., Solinas X., Martin J.-L., Beaurepaire E., Joffre M., “Use of coherent control for selective two-photon fluorescence microscopy in live organisms,” Opt. Express 14(2), 759–766 (2006). 10.1364/OPEX.14.000759 [DOI] [PubMed] [Google Scholar]
- 13.Baiz C. R., Schach D., Tokmakoff A., “Ultrafast 2D IR microscopy,” Opt. Express 22(15), 18724–18735 (2014). 10.1364/OE.22.018724 [DOI] [PMC free article] [PubMed] [Google Scholar]
- 14.Skoff D. R., Laaser J. E., Mukherjee S. S., Middleton C. T., Zanni M. T., “Simplified and economical 2D IR spectrometer design using a dual acousto-optic modulator,” Chem. Phys. 422, 8–15 (2013). 10.1016/j.chemphys.2012.08.019 [DOI] [PMC free article] [PubMed] [Google Scholar]
- 15.Lowenthal S., Joyeux D., “Speckle removal by a slowly moving diffuser associated with a motionless diffuser,” J. Opt. Soc. Am. 61(7), 847 (1971). 10.1364/JOSA.61.000847 [DOI] [Google Scholar]
- 16.Manning C. J., Griffiths P. R., “Noise Sources in Step-Scan FT-IR Spectrometry,” Appl. Spectrosc. 51(8), 1092–1101 (1997). 10.1366/0003702971941755 [DOI] [Google Scholar]
- 17.King J. T., Baiz C. R., Kubarych K. J., “Solvent-dependent spectral diffusion in a hydrogen bonded “vibrational aggregate”,” J. Phys. Chem. A 114(39), 10590–10604 (2010). 10.1021/jp106142u [DOI] [PubMed] [Google Scholar]
- 18.Kim K., Park Y., “Fourier transform light scattering angular spectroscopy using digital inline holography,” Opt. Lett. 37(19), 4161–4163 (2012). 10.1364/OL.37.004161 [DOI] [PubMed] [Google Scholar]
- 19.Kole M. R., Reddy R. K., Schulmerich M. V., Gelber M. K., Bhargava R., “Discrete frequency infrared microspectroscopy and imaging with a tunable quantum cascade laser,” Anal. Chem. 84(23), 10366–10372 (2012). 10.1021/ac302513f [DOI] [PMC free article] [PubMed] [Google Scholar]
- 20.Redding B., Cerjan A., Huang X., Lee M. L., Stone A. D., Choma M. A., Cao H., “Low spatial coherence electrically pumped semiconductor laser for speckle-free full-field imaging,” Proc. Natl. Acad. Sci. U.S.A. 112(5), 1304–1309 (2015). 10.1073/pnas.1419672112 [DOI] [PMC free article] [PubMed] [Google Scholar]
- 21.Dixon L., Cheong F. C., Grier D. G., “Holographic deconvolution microscopy for high-resolution particle tracking,” Opt. Express 19(17), 16410–16417 (2011). 10.1364/OE.19.016410 [DOI] [PubMed] [Google Scholar]
- 22.Stelzer, “Contrast, resolution, pixelation, dynamic range and signal-to-noise ratio: fundamental limits to resolution in fluorescence light microscopy,” J. Microsc. 189(1), 15–24 (1998). 10.1046/j.1365-2818.1998.00290.x [DOI] [Google Scholar]
- 23.Born M., Wolf E., Principles of Optics, 7th ed. (Cambridge Univ Press, 1999). [Google Scholar]
- 24.Nasse M. J., Walsh M. J., Mattson E. C., Reininger R., Kajdacsy-Balla A., Macias V., Bhargava R., Hirschmugl C. J., “High-resolution Fourier-transform infrared chemical imaging with multiple synchrotron beams,” Nat. Methods 8(5), 413–416 (2011). 10.1038/nmeth.1585 [DOI] [PMC free article] [PubMed] [Google Scholar]
- 25.Carr G. L., “Resolution limits for infrared microspectroscopy explored with synchrotron radiation,” Rev. Sci. Instrum. 72(3), 1613 (2001). 10.1063/1.1347965 [DOI] [Google Scholar]
- 26.Beale A. M., Jacques S. D. M., Weckhuysen B. M., “Chemical imaging of catalytic solids with synchrotron radiation,” Chem. Soc. Rev. 39(12), 4656–4672 (2010). 10.1039/c0cs00089b [DOI] [PubMed] [Google Scholar]
- 27.Griffiths P. R., De Haseth J. A., Fourier Transform Infrared Spectrometry, 2nd ed. (Wiley-Interscience, 2007). [Google Scholar]
- 28.Kise D. P., Magana D., Reddish M. J., Dyer R. B., “Submillisecond mixing in a continuous-flow, microfluidic mixer utilizing mid-infrared hyperspectral imaging detection,” Lab Chip 14(3), 584–591 (2014). 10.1039/C3LC51171E [DOI] [PMC free article] [PubMed] [Google Scholar]
- 29.Petersen P. B., Tokmakoff A., “Source for ultrafast continuum infrared and terahertz radiation,” Opt. Lett. 35(12), 1962–1964 (2010). 10.1364/OL.35.001962 [DOI] [PubMed] [Google Scholar]
- 30.Thomson M. D., Blank V., Roskos H. G., “Terahertz white-light pulses from an air plasma photo-induced by incommensurate two-color optical fields,” Opt. Express 18(22), 23173–23182 (2010). 10.1364/OE.18.023173 [DOI] [PubMed] [Google Scholar]
- 31.Yu Y., Zhang B., Gai X., Zhai C., Qi S., Guo W., Yang Z., Wang R., Choi D.-Y., Madden S., Luther-Davies B., “1.8-10 μm mid-infrared supercontinuum generated in a step-index chalcogenide fiber using low peak pump power,” Opt. Lett. 40(6), 1081–1084 (2015). 10.1364/OL.40.001081 [DOI] [PubMed] [Google Scholar]
- 32.Chan K. L. A., Kazarian S. G., “Correcting the effect of refraction and dispersion of light in FT-IR spectroscopic imaging in transmission through thick infrared windows,” Anal. Chem. 85(2), 1029–1036 (2013). 10.1021/ac302846d [DOI] [PubMed] [Google Scholar]
- 33.Shim S.-H., Strasfeld D. B., Zanni M. T., “Generation and characterization of phase and amplitude shaped femtosecond mid-IR pulses,” Opt. Express 14(26), 13120–13130 (2006). 10.1364/OE.14.013120 [DOI] [PubMed] [Google Scholar]
- 34.Bassan P., Byrne H. J., Bonnier F., Lee J., Dumas P., Gardner P., “Resonant Mie scattering in infrared spectroscopy of biological materials--understanding the ‘dispersion artefact’,” Analyst (Lond.) 134(8), 1586–1593 (2009). 10.1039/b904808a [DOI] [PubMed] [Google Scholar]
- 35.Reddy R. K., Walsh M. J., Schulmerich M. V., Carney P. S., Bhargava R., “High-definition infrared spectroscopic imaging,” Appl. Spectrosc. 67(1), 93–105 (2013). 10.1366/11-06568 [DOI] [PMC free article] [PubMed] [Google Scholar]
- 36.Goodman J. W., Introduction to Fourier Optics, 2nd ed. (McGraw-Hill, 1996). [Google Scholar]


