Abstract
Background:
It is of significant importance to assess the extent of hepatic steatosis in living donor liver transplant (LDLT) surgery to ensure optimum graft regeneration as well as donor safety.
Aim:
To establish the accuracy of non-invasive imaging methods including computed tomography (CT), dual-echo in- and opposed-phase magnetic resonance imaging (MRI), and MR spectroscopy (MRS) for quantification of liver fat content (FC) in prospective LDLT donors with histopathology as reference standard.
Settings and Design:
This retrospective study was conducted at our institution on LDLT donors being assessed for biliary and vascular anatomy depiction by Magnetic Resonance Cholangiopancreatography (MRCP) and CT scan, respectively, between July 2013 and October 2014.
Materials and Methods:
Liver FC was measured in 73 donors by dual-echoT1 MRI and MRS. Of these, CT liver attenuation index (LAI) values were available in 62 patients.
Statistical Analysis:
CT and MRI FC were correlated with histopathological reference standard using Spearman correlation coefficient. Sensitivity, specificity, positive predictive value, negative predicative value, and positive and negative likelihood ratios with 95% confidence intervals were obtained.
Results:
CT LAI, dual-echo MRI, and MRS correlated well with the histopathology results (r = 0.713, 0.871, and 0.882, respectively). An accuracy of 95% and 96% was obtained for dual-echo MRI and MRS in FC estimation with their sensitivity being 97% and 94%, respectively. False-positive rate, positive predictive value (PPV), and negative predicative value (NPV) were 0.08, 0.92, and 0.97, respectively, for dual-echo MRI and 0.03, 0.97, and 0.95, respectively, for MRS. CT LAI method of fat estimation has a sensitivity, specificity, PPV, and NPV of 73%, 77.7%, 70.4%, and 80%, respectively.
Conclusion:
Dual-echo MRI, MRS, and CT LAI are accurate measures to quantify the degree of hepatic steatosis in LDLT donors, thus reducing the need for invasive liver biopsy and its associated complications. Dual-echo MRI and MRS results correlate better with histological results in the study, as compared to CT LAI method for fat quantification.
Keywords: Computed tomography liver attenuation index, dual-echo magnetic resonance imaging, hepatic steatosis, liver fat quantification, living donor liver transplantation, MR spectroscopy
Introduction
Liver transplantation is a revolutionary treatment for patients with end-stage liver failure. Over the past decade, the demand for this procedure has steadily increased, primarily due to an epidemic of hepatitis B and C related liver disease.[1,2,3] Living donor liver transplantation (LDLT) surgery was introduced in 1989 to overcome the severe shortage of size-matched deceased donor (DD) organs for pediatric recipients.[4] Given the increasing shortage of DD grafts for adults, living donation (LD) was then explored as a potential solution to the shortage of DD organs for adults also.
LDLT has the advantage of surgery being done at an optimal time before the recipient's health deteriorates unduly. In addition, the recipient receives a high-quality organ due to thorough donor evaluation and shorter cold ischemic time.[5,6] Maximizing donor safety is critical as adult-to-adult living liver donation becomes more common and complications resulting in donor morbidity and mortality become apparent. Steatosis is one of the many variables that influence a potential donor's eligibility. Excessive hepatic steatosis is harmful in two ways - it places the recipient at risk for primary dysfunction of the graft and affects the recovery of the donor after partial hepatectomy.[7,8,9] Though liver graft volume calculation and biliary and vascular anatomy assessment can accurately be performed by cross-sectional imaging techniques, the gold standard for accurate quantification of hepatic steatosis is still liver biopsy.
Non-invasive imaging tools for liver fat estimation include ultrasound, computed tomography (CT), and magnetic resonance imaging (MRI) methods.[10,11,12,13] Ultrasound is not considered as a sufficient imaging tool for fat determination in liver because of its inherent limitation of being operator dependent. Also, it has limited accuracy in obese people and in cases with relatively lower grades of liver fat infiltration. CT fat quantification requires undesired radiation exposure in the examination of subjects and provides semi-quantitative liver fat content (FC) estimation.[11] MR methods, therefore, become the most desirable and useful technique. Various MR methods are available for the determination of liver content, including fat-sensitive T1-weighted Dixon MR imaging,[14,15,16,17,18,19] fat-selective MR imaging based on frequency-selective excitation or chemical shift selective images (spectral fat or water-selective imaging) known as IDEAL (Iterative Decomposition of water and fat with Echo Asymmetry and Least squares estimation),[20,21] and 1H-MR spectroscopy (MRS).[11,22]
It is desirable to avoid using invasive liver biopsy procedure in otherwise healthy liver donors as much as possible. We have tried to establish the accuracy of non-invasive imaging methods for quantifying liver fat to minimize the need for liver biopsy. In fact, the high sensitivity and specificity of MR hepatic FC estimation led the transplant physicians to make MR as the first imaging modality to be performed in liver donors before CT scan to save radiation exposure in patients with grade III hepatic steatosis.
Materials and Methods
Patient selection
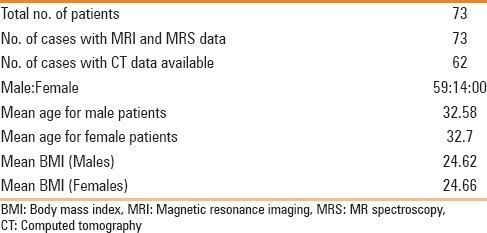
This retrospective study was conducted in our institution on healthy, living related liver donor candidates who underwent preoperative MR imaging for liver donation from July 2013 to October 2014. The study was approved by the institutional review board with waiver given for patient consent. A total of 73 patients were included who had liver fat quantification done by non-invasive imaging methods followed by preoperative or intraoperative histopathologic correlation. Of these 73 patients, 59 were male and 14 were female donors. The patients with deranged liver function tests or other systemic problems were excluded from the study. Patients’ height, weight, and Body Mass Index (BMI) were recorded.
Of the total 73 donors, 72 underwent hepatic resection for liver donation. The remaining one prospective liver donor who was suspected of having hepatic steatosis and subsequently underwent liver biopsy did not undergo surgery because of moderate (>30%) macrosteatosis. The maximum interval between imaging and biopsy was 20 days.
MRI system
In our study, liver FC was measured by dual-echo T1-weighted MR imaging [in-phase and out-of-phase (IP-OP)] and 1H-MRS. The MR FC estimation was used in predicting the appropriateness of liver donation in potential living related liver donors by using histopathologic results as the reference standard.
All patients underwent MRI before the liver biopsy within a short time interval, maximum being 20 days. MR examinations were performed in supine position on 3.0 T MR Scanner (Achieva; Philips, Netherlands) with a single-channel body coil and a phased-array sense torso coil. The commonly used field of view (FOV) for MRI studies was 450 × 340 mm. A three-plane localization imaging sequence was performed at the beginning of the examination.
MR spectroscopy
For in vivo 1H-MRS, a 20 × 20 × 20 mm3 voxel was placed in the right hepatic lobe (Couinaud segments V-VIII), avoiding major blood vessels, bile ducts, or liver edges seen on the localization images, and was shimmed automatically. Hepatic FC was measured by 1H respiratory-gated stimulated-echo acquisition mode (STEAM) spectroscopy by using a repetition time of 2000 ms. After a single pre-acquisition excitation pulse to balance T1 saturation on subsequent excitations, five stimulated-echo acquisition mode spectra were acquired at echo times of 15, 20, 25, 30, and 35 ms in a 72 s free breathing technique with respiratory triggering of excitation. This echo time range enabled reproducible T2 estimation while minimizing the confounding effects of fat-peak J coupling.[23,24] An average display spectrum of the five different TE spectra was obtained and areas of water and the three major fat spectral peaks (0.9, 1.3, and 2.1 ppm) were measured.[25] Hepatic fat fraction (HFF) was calculated as previously described and was expressed as HFF (=lipid peak area/(water peak area + lipid peak area) × 100).
A single experienced observer analyzed the spectra using MRI vendor supplied standard MRS post-processing software package followed by an in-house developed method to address the inherent effect of spin relaxation on metabolite estimation.
Dual-echo MRI
Dual in-phase, opposed-phase T1-based gradient echo image acquisition was performed in the axial plane during an end-expiratory breath-hold with an approximate acquisition time of 16 s. The two-point Dixon method based on phase-shift imaging[26] was used in which HFF is calculated by computing relative signal intensity (SI) decrease in the liver on opposed-phase images compared with in-phase images after taking a mean of twelve >1 cm2 regions of interest (ROIs) placed on multiple slices, taking care to avoid areas with vessels, motion artifacts, and partial volume effects. ROIs were placed at anatomically matched locations on paired images by using a co-registration tool available on the workstation to ensure assessment of similar liver parenchyma on in- and out-phase images. Because the tissue of interest is measured at a co-localized location at each TE, depth-dependent SI changes in image do not confound the results.
The dual-echoT1-weighted sequence parameters were as follows: Repetition time of 290 ms; echo time of 1.2 ms for OP images and 2.3 ms for IP images; flip angle, 70°; section thickness, 6 mm; matrix size, 288 × 188; FOV, 34 cm × 45 cm.
HFF was calculated as the percentage of relative SI loss of the liver on opposed-phase images compared to in-phase images, with the following formula: HFF = [(SIin − SIout)/2 × SIin] × 100, where SIin and SIout are SI of IP and OP images, respectively.[27]
MR imaging results were interpreted by an experienced radiologist who was blinded to clinical, laboratory, and histological findings.
CT system
Unenhanced CT examinations were performed with a Toshiba 64-section scanner and the parameters were: 120 kV, 200 mAs with dose modulation, section thickness of 5 mm, and an increment of 4 mm. A total of 12 ROIs were drawn in the liver parenchyma with area measuring >1 cm2 evenly distributed in the hepatic parenchyma, usually in the middle sections of liver, avoiding biliary, vascular, and extrahepatic structures. Similarly, 12 ROIs were drawn on splenic parenchyma. Data were processed by an experienced radiologist. Mean values of liver and splenic ROIs were recorded separately. Liver attenuation index (LAI) was calculated as: Mean liver attenuation − mean splenic attenuation.
Liver biopsy
Preoperative liver biopsy was performed in patients suspected of having liver steatosis based on imaging parameters, after taking informed consent from the patient to assess the presence of liver steatosis and the degree of fibrosis or other likely independent or competing liver diseases. In patients with normal FC on imaging, an intraoperative biopsy from the edge of liver graft was obtained during transplant surgery.
Preoperative biopsy technique
In preoperative setting, percutaneous needle liver biopsy was performed with an 18-gauge needle under local anesthesia and ultrasound guidance. In all patients, in order to obtain an adequate sample, biopsy specimens were obtained twice at two different sites in the right hepatic lobe. Liver specimens that were at least 1.5 cm in length and contained at least 10 complete portal tracts were considered adequate for histological assessment.
Grading
Steatosis is typically graded on a 0-3 scale based on the number of cells with intracellular vacuoles of fat:[28]
Grade 0 (normal) = up to 5% of cells affected
Grade 1 (mild) = 5-33% of cells affected
Grade 2 (moderate) = 34-66% of cells affected
Grade 3 (severe) = 67% or greater of cells affected.
Biopsy specimens were also evaluated for portal inflammation (0-2), lobular inflammation (0-3), ballooning degeneration (0-2), and fibrosis (stage 0-4).
Statistical analysis
The results were expressed as mean ± SD. CT and MR imaging FC were correlated with histopathologic reference standard obtained by preoperative or intraoperative liver biopsies using Spearman correlation coefficient. Receiver operating characteristic (ROC) curve analysis was also performed to determine the best cut-off values for MRI to predict any grade (mild, moderate, and severe) of hepatic steatosis. The area under the curve (AUC) was used to assess the accuracy of MRI. The best cut-off value was determined while balancing the best sensitivity with the lowest false-positive rate. Values for sensitivity, specificity, positive predictive value (PPV), negative predicative value (NPV), and positive and negative likelihood ratios with 95% confidence intervals were obtained. A likelihood ratio greater than 10 and less than 0.1 implies strong effects, whereas a likelihood ratio of 1 implies no effect.
The true positive rate is defined as the ratio of the number of correctly diagnosed fatty livers to the total number of fatty livers, which is therefore equivalent to sensitivity of a diagnostic test, and the false-positive rate is defined as the ratio of the number of normal livers diagnosed as fatty livers to the total number of normal livers.
Results
Patient characteristics
The mean age for male and female patients was 32.58 years (range 20-55 years) and 32.7 years (range 19-55 years), respectively. The mean BMI for male and female patients was 24.62 (range 17.19-34.84) and 24.66 (range 17.85-29.75), respectively. MR fat quantification data by dual phase sequence and MRS techniques and histopathology data were available in all patients. CT LAI data were available in 62 out of 73 patients. These results are summarized in Table 1.
Table 1.
Patient characteristics
Of the total 73 patients, the FC values obtained by dual phase MRI ranged between − 3.4 and 18.8 (median 1.7, mean 3.96, SD 5.73) and those obtained by MRS ranged from 0 to 31.50 (median 5.6, mean 8.47, SD 7.62). Of 62 patients in whom CT data were available, the CT LAI values ranged from − 15 to 20 (median 6, mean 5.3, SD 7.66).
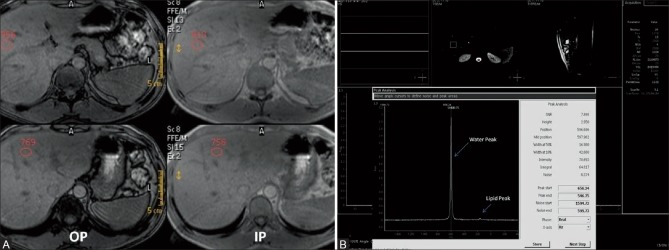
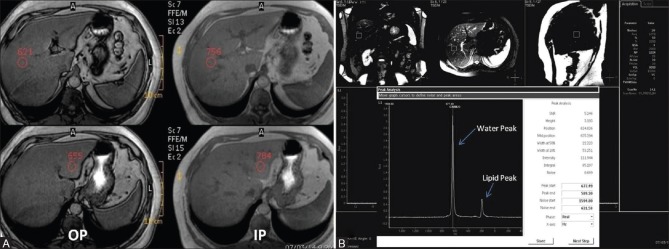
The MR images in representative patients with normal hepatic FC and with hepatic steatosis are given in Figures 1 and 2, respectively. The CT images in representative patients with normal liver FC and with hepatic steatosis are given in Figure 3a and b, respectively.
Figure 1 (A and B).
(A) Dual in and opposed phase MRI (A) and MR Spectroscopy (B) in a liver donor with normal liver fat content. (A) There is minimal signal drop on opposed phase images on comparison with in phase images and the mean HFF measures 0.3% (B) Single voxel MR Spectroscopy performed in right lobe of liver shows a very small lipid peak at 1.3 ppm (small arrow) with a large water peak at 4 ppm (long arrow) and the mean hepatic fat fraction measures 2.3% (B)
Figure 2 (A and B).
Dual phase MRI (A) and MR Spectroscopy (B) in a donor with grade I liver steatosis (Histopathological fat fraction 20%). (A) Dual in and opposed phase MRI demonstrates significant signal drop in hepatic parenchyma on opposed phase images on comparison with in phase images with HFF measuring 8.5% (B) Single voxel MR Spectroscopy reveals moderate sized lipid peak at 1.3 ppm (small arrow) with large water peak at 4 ppm (long arrow), HFF measuring 13.7%
Figure 3 (A and B).
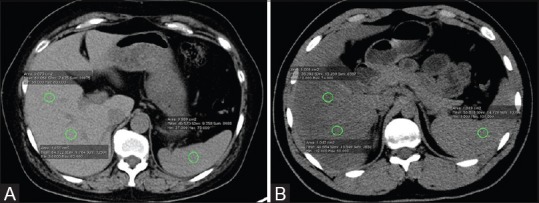
Noncontrast Axial CT scan images with ROIs placed in liver and splenic parenchyma to calculate LAI in a liver donor with normal hepatic fat content (A), and in another liver donor with hepatic steatosis (B)
The Box plot diagrams showing imaging results in all patients are given in Figure 4.
Figure 4 (A-C).
(A) Box plot diagrams to show results of CT LAI (B) MRS and (C) Dual echo MRI
Liver biopsy results
The liver FC obtained by preoperative or intraoperative biopsy ranged between 0 to 35 with a mean of 7.23 [95% confidence interval (CI), SD 9.31, median 2]. The imaging and biopsy results are summarized in Table 2.
Table 2.
Hepatic fat quantification results on imaging and liver biopsy

Out of total 73 patients, 44 patients had normal biopsy results (HFF <5%) and 29 patients had abnormal results (HFF >5%). Twenty-five patients had mild (5-29%) steatosis and four had moderate steatosis (>30%). None of the patients had severe steatosis. Lobular inflammation was present in two liver biopsies and none of the patients had ballooning of hepatocytes. None of the patients had portal fibrosis on liver biopsy.
Imaging correlation with biopsy results
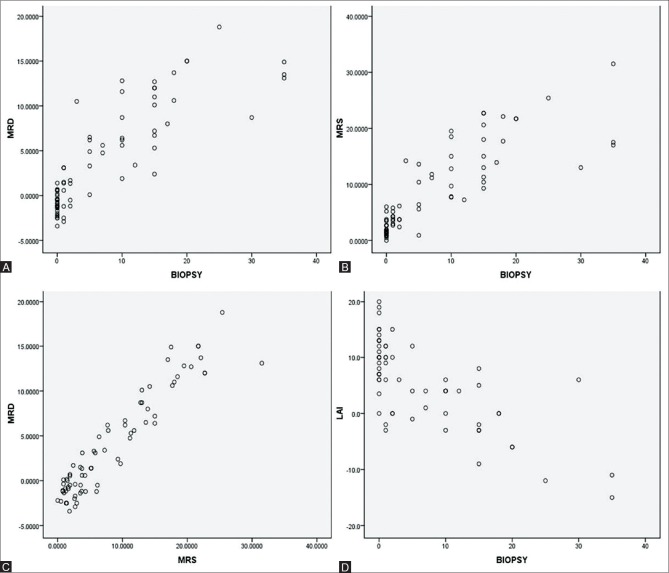
Dual-echo MR and MRS HFF values were strongly correlated with histological steatosis (correlation coefficients r = 0.871 and 0.882, respectively, P = 0.00; correlation being significant). CT LAI results also correlated with histological steatosis (correlation coefficient r = 0.713, P = 0.00; correlation being significant).
There was a strong correlation of CT LAI with dual-echo MRI and MRS HFF values (r = −0.691, P = 0.00 and r = −0.709, P = 0.00, respectively; correlation being significant)
There was a strong correlation between dual-echo MRI and MRS HFF values (r = 0.892, P = 0.00; correlation being significant). These results have been summarized in Table 3.
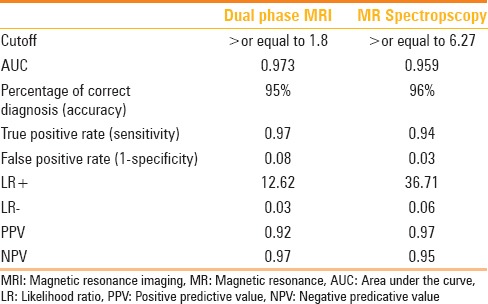
Table 3.
Diagnostic accuracy of Dual phase MRI and MR Spectroscopy for detecting hepatic steatosis
The scatter plot diagrams to show correlation between the results obtained by different modalities are shown in Figure 5.
Figure 5 (A-D).
The correlation between results obtained by different modalities is shown in scatterplots. (A) Scatterplot to show correlation between Dual echo MRI and biopsy values (B) Scatterplot to show correlation between MRS and biopsy values (C) Scatterplot to show correlation between Dual echo MRI and MRS values (D) Scatter plot to show correlation between CT LAI and Biopsy values
Comparative accuracy of various imaging modalities
The diagnostic accuracy of dual-echo MRI and MRS for detecting hepatic steatosis is shown in Table 3. Comparison could not be made with CT LAI due to its semi-quantitative nature.
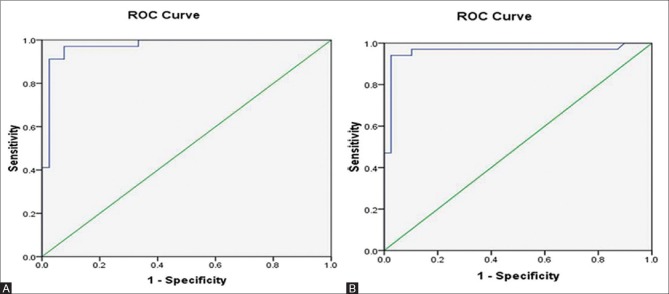
Dual-echo MRI had 97% sensitivity to diagnose hepatic steatosis at a threshold value of 1.8 with 95% accuracy. MRS had 94% sensitivity to diagnose liver steatosis at a threshold value of 6.27 with 96% accuracy.
The ROC curve analyses for dual-echo MRI and MRS are presented in Figure 6.
Figure 6 (A and B).
ROC curve analysis for (A) dual echo MRI and (B) MR Spectroscopy
CT LAI method of fat estimation has a sensitivity, specificity, PPV, NPV, and accuracy of 73%, 77.7%, 70.4%, 80%, and 75.8%, respectively.
Discussion
This study assesses the accuracy of CT, dual-echo MR imaging and MRS in liver FC estimation at 3.0 T, by using histopathology as the reference standard. It demonstrated good accuracy of both MR and CT imaging methods for detection and quantification of liver steatosis, the former showing stronger correlation with the biopsy results. While comparing the two MR methods for fat quantification, greater sensitivity was shown by dual-echo MR technique (97%) compared to MRS (94%). However, MRS is a more specific method showing less false-positive results (3%) compared to dual-echo MRI (8%). Due to the high PPV and NPV, MRI data can safely be used to assess liver steatosis and avoid an unnecessary liver biopsy.
CT fat quantification, though correlating well with biopsy results (correlation coefficient r = 0.715), is inferior to MR methods for liver fat estimation. It has further limitations in providing semi-quantitative nature of results rather than discrete values for FC.
The two MR methods correlated well with each other, thereby implying that MR liver fat estimation can reasonably be done even on scanners lacking the software for performing liver MRS. Furthermore, when compared to MRS, MRI is less time-consuming and technically demanding, and helps to non-invasively evaluate the entire liver parenchyma, resulting in a more complete assessment of liver FC.[29] This is particularly relevant in cases with heterogeneous hepatic steatosis in which sensitivity of liver biopsy is limited as less than 1/50,000th of the liver is available for histological analysis.[30] Even a single-voxel MRS usually includes only about 8-27 g of liver parenchyma in a voxel. However, due to the varying cut-off values on different scanners, some initial experience and biopsy correlation are required in the beginning to set one's own threshold values on a particular scanner.
In a very recent study including 46 patients undergoing liver resection, van Werven et al.[31] showed that T1-weighted dual-echo MR imaging was strongly correlated with histopathologic steatosis assessment (r = 0.85, P < 0.001). In the 23 patients with macrovesicular steatosis greater than 5%, dual-echo MR imaging showed an even stronger correlation with histopathologic examination (r = 0.92, P < 0.001) than in the overall group. Recent studies have validated the modified 2-point Dixon method against MRS in obese and lean adolescents who were at increased risk of having or developing hepatic steatosis, and found a very strong correlation between the two methods (r = 0.954, P < 0.001).[32,33] In a cohort of 28 (mean age, 15.9 ± 5.3 years) obese and lean subjects, Kim et al. demonstrated that a 2-point Dixon HFF cut-off of 3.6% provided a good sensitivity (80%) and specificity (87%), compared to MRS reference.[33] But the cut-off values obtained by ROC analysis in our study was slightly different – 1.8% for dual-echo MRI and 6.7% for MRS.
Recently, Idilman et al. have also established high correlation between MR HFF done by MR proton density fat fraction (PDFF) and MRS with histopathologic value, with no significant superiority of one method over another and with the correlation coefficient between MRI PDFF and MRS with histology-determined steatosis measuring 0.743 and 0.712, respectively.[34]
Hwang et al. also found similar results by using breath-hold triple-echo MR imaging and MRS in living liver donor candidates, with correlation coefficient values of triple-echo MR imaging and MRS with macrovesicular steatosis being 0.886 and 0.887, respectively. However, their sensitivity and specificity values measuring 90.9 and 86.2, respectively, were less compared to our study.[35]
Chiang et al. found that the MR IDEAL sequence has a sensitivity of 100% and specificity of 77.1% to detect hepatic steatosis (P < 0.0001, 5-95% CI). In their study, MR IDEAL fat fraction results were excellent in predicting amount of liver steatosis and had good correlation with the pathology grading (2.9 ± 0.9 and 8.3 ± 4.2, respectively; P < 0.0001).[20] Joe et al. also evaluated IDEAL technique to detect hepatic steatosis in potential liver donors and showed sensitivity and specificity of 100% and 91%, respectively, for IDEAL versus 87.5% and 97%, respectively, for in- and opposed-phase imaging.[36]
Aguero et al. studied the correlation between MRI fat fraction and histological steatosis in obese patients before and after bariatric surgery and provided a novel equation using measurement of hepatic triglyceride concentration known as Folch value which made MR fat estimation more robust.[37]
Fibrosis and inflammation may be present in patients with hepatic steatosis. Fishbein et al. showed that hepatic MRI, based upon chemical shift imaging, was not affected by the presence of fibrosis and was able to accurately quantify the hepatic FC even in patients with significant hepatic fibrosis.[26]
Since the first of these methods was introduced by Dixon in 1984,[14] many researchers have made modifications to the Dixon method to decrease its sensitivity to magnetic field inhomogeneity, e.g., with the “three-point” method proposed by Glover et al.,[15] and to reduce scan time, particularly with the introduction of fast gradient echo techniques.[26,38]
Our study has got some limitations, the first being lack of co-localization between the area of MRS fat estimation and the biopsy area. However, this is not believed to have much influence on our study results as none of our patients had geographic pattern of fat distribution on other fat imaging methods. Also, the results of MRS correlated well with other methods of fat estimation in almost all cases.
The second limitation of our study is use of dual-echo T1 gradient echo images without using T2* correction. In our dual-echo T1 Gradient echo sequences (GRE) images, no corrections for T1, T2*, or fat spectral complexity were made, and consequently, only MR signal intensities were evaluated. Recent studies have indicated that T1 weighting (flip angle) and T2 weighting (iron deposition) may interfere with accurate fat quantification.[39,40] However, in the study by van Werven et al., a strong correlation between T1-weighted dual-echo MR imaging and histopathologic results was demonstrated in the absence of any correction for T1, T2*, or fat spectral complexity.[39] In that study as well as in ours, the mean SI decay of 12 ROIs throughout the liver was measured, respectively. The T2* correction is important in cases where iron overload problems might lead to T2 changes. As liver iron deposition is a common secondary feature of many chronic liver diseases, SI loss on in-phase gradient-echo MR images caused by the presence of liver iron is a potential pitfall in the determination of liver fat percentage at opposed-phase MR imaging in patients with chronic liver diseases. Thus, the T2* correction is very important in cases where iron overload might lead to T2 changes, but none of our otherwise healthy liver donors had histological evidence of iron accumulation, consistent with a previous report of adult patients with non-alcoholic fatty liver disease (NAFLD) who were seen at a referral center without a special interest in disorders of iron storage.[41] Moreover, the dual gradient echo MR sequence used in our study is more practical to use due to its non-complexity and wider availability.
Authors of a few studies have compared the imaging modalities to assess steatosis, and findings showed strong significant correlation between MR imaging and 1H-MRS (r = 0.96-0.99) and between 1H-MRS and CT (r = 0.83). However, these results were not compared with liver biopsy results.[42,43,44,45] Few other studies, however, did compare the imaging modalities with histopathologic findings and showed substantial variation in correlations.[46,47,48,49,50]
Conclusion
Our study with histological validation shows that non-invasive imaging methods including dual-echo MRI, MRS, and CT LAI are accurate measures to detect and quantify the degree of hepatic steatosis in healthy living related liver donors, thus markedly reducing the need for invasive liver biopsy and its associated complications. With the recent rise in the incidence of NAFLD, liver fat estimation by MR imaging is particularly useful as it can be repeated several times to assess treatment response without any consideration for radiation exposure. In conclusion, MR, especially with its high accuracy and sensitivity compared to CT, proves to be a robust quantitative biomarker of hepatic steatosis and a non-invasive alternative to liver biopsy.
Financial support and sponsorship
Nil.
Conflicts of interest
There are no conflicts of interest.
Acknowlegements
Our sincere appreciation and gratitude is extended to Mr Kripal Gusain for his technical support. We thank Ms Ripsy Gauba for her assistance in statistical analysis.
References
- 1.Trotter JF, Wachs M, Everson GT, Kam I. Adult-to-adult transplantation of the right hepatic lobe from a living donor. N Engl J Med. 2002;346:1074–82. doi: 10.1056/NEJMra011629. [DOI] [PubMed] [Google Scholar]
- 2.Cattral MS, Molinari M, Vollmer CM, Jr, McGilvray I, Wei A, Walsh M, et al. Living-donor right hepatectomy with or without inclusion of middle hepatic vein: Comparison of morbidity and outcome in 56 patients. Am J Transplant. 2004;4:751–7. doi: 10.1111/j.1600-6143.2004.00405.x. [DOI] [PubMed] [Google Scholar]
- 3.Shah SA, Grant DR, Greig PD, McGilvray ID, Adcock LD, Girgrah N, et al. Analysis and outcomes of right lobe hepatectomy in 101 consecutive living donors. Am J Transplant. 2005;5:2764–9. doi: 10.1111/j.1600-6143.2005.01094.x. [DOI] [PubMed] [Google Scholar]
- 4.Strong RW, Lynch SV, Ong TH, Matsunami H, Koido Y, Balderson GA. Successful liver transplantation from a living donor to her son. N Engl J Med. 1990;322:1505–7. doi: 10.1056/NEJM199005243222106. [DOI] [PubMed] [Google Scholar]
- 5.Broelsch CE, Testa G, Alexandrou A, Malagó M. Living related liver transplantation: Medical and social aspects of a controversial therapy. Gut. 2002;50:143–5. doi: 10.1136/gut.50.2.143. [DOI] [PMC free article] [PubMed] [Google Scholar]
- 6.Karliova M, Malagó M, Valentin-Gamazo C, Reimer J, Treichel U, Franke GH, et al. Living-related liver transplantation from the view of the donor: A 1-year follow-up survey. Transplantation. 2002;73:1799–804. doi: 10.1097/00007890-200206150-00017. [DOI] [PubMed] [Google Scholar]
- 7.D’Alessandro AM, Kalayoglu M, Sollinger HW, Hoffmann RM, Reed A, Knechtle SJ, et al. The predictive value of donor liver biopsies for the development of primary nonfunction after orthotopic liver transplantation. Transplantation. 1991;51:157–63. doi: 10.1097/00007890-199101000-00024. [DOI] [PubMed] [Google Scholar]
- 8.Marsman WA, Wiesner RH, Rodriguez L, Batts KP, Porayko MK, Hay JE, et al. Use of fatty donor liver is associated with diminished early patient and graft survival. Transplantation. 1996;62:1246–51. doi: 10.1097/00007890-199611150-00011. [DOI] [PubMed] [Google Scholar]
- 9.Garcia Ureña MA, Colina Ruiz-Delgado F, Moreno González E, Jiménez Romero C, García García I, Loinzaz Segurola C, et al. Hepatic steatosis in liver transplant donors: Common feature of donor population? World J Surg. 1998;22:837–44. doi: 10.1007/s002689900479. [DOI] [PubMed] [Google Scholar]
- 10.Mehta SR, Thomas EL, Bell JD, Johnston DG, Taylor-Robinson SD. Non-invasive means of measuring hepatic fat content. World J Gastroenterol. 2008;14:3476–83. doi: 10.3748/wjg.14.3476. [DOI] [PMC free article] [PubMed] [Google Scholar]
- 11.Schwenzer NF, Springer F, Schraml C, Stefan N, Machann J, Schick F. Non-invasive assessment and quantification of liver steatosis by ultrasound, computed tomography and magnetic resonance. J Hepatol. 2009;51:433–45. doi: 10.1016/j.jhep.2009.05.023. [DOI] [PubMed] [Google Scholar]
- 12.Bohte AE, van Werven JR, Bipat S, Stoker J. The diagnostic accuracy of US, CT, MRI and 1H-MRS for the evaluation of hepatic steatosis compared with liver biopsy: A metaanalysis. Eur Radiol. 2011;21:87–97. doi: 10.1007/s00330-010-1905-5. [DOI] [PMC free article] [PubMed] [Google Scholar]
- 13.Cheng YF, Yu CY, Ou HY, Tsang LL, Huang TL, Chen TY, et al. Section 1. Image evaluation of fatty liver in living donor liver transplantation. Transplantation. 2014;97(Suppl 8):S3–6. doi: 10.1097/01.tp.0000446265.42019.f3. [DOI] [PubMed] [Google Scholar]
- 14.Dixon WT. Simple proton spectroscopic imaging. Radiology. 1984;153:189–94. doi: 10.1148/radiology.153.1.6089263. [DOI] [PubMed] [Google Scholar]
- 15.Glover GH, Schneider E. Three-point Dixon technique for true water/fat decomposition with B0 inhomogeneity correction. Magn Reson Med. 1991;18:371–83. doi: 10.1002/mrm.1910180211. [DOI] [PubMed] [Google Scholar]
- 16.Levenson H, Greensite F, Hoefs J, Friloux L, Applegate G, Silva E, et al. Fatty infiltration of the liver: Quantification with phase- contrast MR imaging at 1.5 T vs biopsy. AJR Am J Roentgenol. 1991;156:307–12. doi: 10.2214/ajr.156.2.1898804. [DOI] [PubMed] [Google Scholar]
- 17.Ma J. Dixon techniques for water and fat imaging. J Magn Reson Imaging. 2008;28:543–58. doi: 10.1002/jmri.21492. [DOI] [PubMed] [Google Scholar]
- 18.Glover GH. Multipoint Dixon technique for water and fat proton and susceptibility imaging. J Magn Reson Imaging. 1991;1:521–30. doi: 10.1002/jmri.1880010504. [DOI] [PubMed] [Google Scholar]
- 19.Lodes CC, Felmlee JP, Ehman RL, Sehgal CM, Greenleaf JF, Glover GH, et al. Proton MR chemical shift imaging using double and triple phase contrast cquisition methods. J Comput Assist Tomogr. 1989;13:855–61. doi: 10.1097/00004728-198909000-00020. [DOI] [PubMed] [Google Scholar]
- 20.Chiang HJ, Lin LH, Li CW, Lin CC, Chiang HW, Huang TL, et al. Magnetic resonance fat quantification in living donor liver transplantation. Transplant Proc. 2014;46:666–8. doi: 10.1016/j.transproceed.2013.11.050. [DOI] [PubMed] [Google Scholar]
- 21.Reeder SB, Robson PM, Yu H, Shimakawa A, Hines CD, McKenzie CA, et al. Quantification of hepatic steatosis with MRI: The effects of accurate fat spectral modeling. J Magn Reson Imaging. 2009;29:1332–9. doi: 10.1002/jmri.21751. [DOI] [PMC free article] [PubMed] [Google Scholar]
- 22.Szczepaniak LS, Nurenberg P, Leonard D, Browning JD, Reingold JS, Grundy S, et al. Magnetic resonance spectroscopy to measure hepatic triglyceride content: Prevalence of hepatic steatosis in the general population. Am J Physiol Endocrinol Metab. 2005;288:E462–8. doi: 10.1152/ajpendo.00064.2004. [DOI] [PubMed] [Google Scholar]
- 23.Hamilton G, Middleton M, Shiehmorteza M, Sirlin C. Berkeley, California: International Society for Magnetic Resonance in Medicine; 2009. The effect of J-coupling on absolute quantification of liver fat using MRS: A phantom study. Proceedings of the Seventeenth Meeting of the International Society for Magnetic Resonance in Medicine; p. 2149. [Google Scholar]
- 24.Hamilton G, Middleton MS, Bydder M, Yokoo T, Schwimmer JB, Kono Y, et al. Effect of PRESS and STEAM sequences on magnetic resonance spectroscopic liver fat quantification. J Magn Reson Imaging. 2009;30:145–52. doi: 10.1002/jmri.21809. [DOI] [PMC free article] [PubMed] [Google Scholar]
- 25.Bydder M, Hamilton G, Yokoo T, Sirlin CB. Optimal phased-array combination for spectroscopy. Magn Reson Imaging. 2008;26:847–50. doi: 10.1016/j.mri.2008.01.050. [DOI] [PMC free article] [PubMed] [Google Scholar]
- 26.Fishbein MH, Gardner KG, Potter CJ, Schmalbrock P, Smith MA. Introduction of fast MR imaging in the assessment of hepatic steatosis. Magn Reson Imaging. 1997;15:287–93. doi: 10.1016/s0730-725x(96)00224-x. [DOI] [PubMed] [Google Scholar]
- 27.Qayyum A, Goh JS, Kakar S, Yeh BM, Merriman RB, Coakley FV. Accuracy of liver fat quantification at MR imaging: Comparison of out-of-phase gradient-echo and fat-saturated fast spin-echo techniques-initial experience. Radiology. 2005;237:507–11. doi: 10.1148/radiol.2372040539. [DOI] [PubMed] [Google Scholar]
- 28.Brunt EM, Janney CG, Di Bisceglie AM, Neuschwander-Tetri BA, Bacon BR. Nonalcoholic steatohepatitis: A proposal for grading and staging the histological lesions. Am J Gastroenterol. 1999;94:2467–74. doi: 10.1111/j.1572-0241.1999.01377.x. [DOI] [PubMed] [Google Scholar]
- 29.Noureddin M, Lam J, Peterson MR, Middleton M, Hamilton G, Le TH, et al. Longitudinal comparison between MRI, MRS and histology-determined steatosis in NAFLD patients at two-time points in a randomized trial. Hepatology. 2013 Epub ahead of print. [Google Scholar]
- 30.El-Badry AM, Breitenstein S, Jochum W, Washington K, Paradis V, Rubbia-Brandt L, et al. Assessment of hepatic steatosis by expert pathologists: The end of a gold standard. Ann Surg. 2009;250:691–7. doi: 10.1097/SLA.0b013e3181bcd6dd. [DOI] [PubMed] [Google Scholar]
- 31.van Werven JR, Marsman HA, Nederveen AJ, Smits NJ, ten Kate FJ, van Gulik TM, et al. Assessment of hepatic steatosis in patients undergoing liver resection: Comparison of US, CT, T1-weighted dual-echo MR imaging, and pointresolved 1H MR spectroscopy. Radiology. 2010;256:159–68. doi: 10.1148/radiol.10091790. [DOI] [PubMed] [Google Scholar]
- 32.Kim H, Taksali SE, Dufour S, Befroy D, Goodman TR, Petersen KF, et al. Comparative MR study of hepatic fat quantification using single-voxel proton spectroscopy, two-point dixon and three-point IDEAL. Magn Reson Med. 2008;59:521–7. doi: 10.1002/mrm.21561. [DOI] [PMC free article] [PubMed] [Google Scholar]
- 33.Cali AM, De Oliveira AM, Kim H, Chen S, Reyes-Mugica M, Escalera S, et al. Glucose dysregulation and hepatic steatosis in obese adolescents: Is there a link? Hepatology. 2009;49:1896–903. doi: 10.1002/hep.22858. [DOI] [PMC free article] [PubMed] [Google Scholar]
- 34.Idilman IS, Keskin O, Celik A, Savas B, Halil Elhan A, Idilman R, et al. A comparison of liver fat content as determined by magnetic resonance imaging-proton density fat fraction and MRS versus liver histology in non-alcoholic fatty liver disease. Acta Radiol. 2015 doi: 10.1177/0284185115580488. Epub ahead of print. [DOI] [PubMed] [Google Scholar]
- 35.Hwang I, Lee JM, Lee KB, Yoon JH, Kiefer B, Han JK, et al. Hepatic steatosis in living liver donor candidates: Preoperative assessment by using breath-hold triple-echo MR imaging and 1H MR spectroscopy. Radiology. 2014;271:730–8. doi: 10.1148/radiol.14130863. [DOI] [PubMed] [Google Scholar]
- 36.Joe E, Lee JM, Kim KW, Lee KB, Kim SJ, Baek JH, et al. Quantification of hepatic macrosteatosis in living, related liver donors using T1-independent, T2*-corrected chemical shift MRI. J Magn Reson Imaging. 2012;36:1124–30. doi: 10.1002/jmri.23738. [DOI] [PubMed] [Google Scholar]
- 37.Jiménez-Agüero R, Emparanza JI, Beguiristain A, Bujanda L, Alustiza JM, García E, et al. Novel equation to determine the hepatic triglyceride concentration in humans by MRI: Diagnosis and monitoring of NAFLD in obese patients before and after bariatric surgery. BMC Med. 2014;12:137. doi: 10.1186/s12916-014-0137-y. [DOI] [PMC free article] [PubMed] [Google Scholar]
- 38.Borra RJ, Salo S, Dean K, Lautamäki R, Nuutila P, Komu M, et al. Nonalcoholic fatty liver disease: Rapid evaluation of liver fat content with in-phase and out-of-phase MR imaging. Radiology. 2009;250:130–6. doi: 10.1148/radiol.2501071934. [DOI] [PubMed] [Google Scholar]
- 39.Westphalen AC, Qayyum A, Yeh BM, Merriman RB, Lee JA, Lamba A, et al. Liver fat: Effect of hepatic iron deposition on evaluation with opposed-phase MR imaging. Radiology. 2007;242:450–5. doi: 10.1148/radiol.2422052024. [DOI] [PubMed] [Google Scholar]
- 40.Schwenzer NF, Machann J, Martirosian P, Stefan N, Schraml C, Fritsche A, et al. Quantification of pancreatic lipomatosis and liver steatosis by MRI: Comparison of in/opposed-phase and spectral-spatial excitation techniques. Invest Radiol. 2008;43:330–7. doi: 10.1097/RLI.0b013e31816a88c6. [DOI] [PubMed] [Google Scholar]
- 41.Younossi ZM, Gramlich T, Bacon BR, Matteoni CA, Boparai N, O’Neill R, et al. Hepatic iron and non-alcoholic fatty liver disease. Hepatology. 1999;30:847–50. doi: 10.1002/hep.510300407. [DOI] [PubMed] [Google Scholar]
- 42.Guiu B, Petit JM, Loffroy R, Ben Salem D, Aho S, Masson D, et al. Quantification of liver fat content: Comparison of triple-echo chemical shift gradient echo imaging and in vivo proton MR spectroscopy. Radiology. 2009;250:95–102. doi: 10.1148/radiol.2493080217. [DOI] [PubMed] [Google Scholar]
- 43.Machann J, Thamer C, Schnoedt B, Stefan N, Haring HU, Claussen CD, et al. Hepatic lipid accumulation in healthy subjects: A comparative study using spectral fat selective MRI and volume-localized 1H-MR spectroscopy. Magn Reson Med. 2006;55:913–7. doi: 10.1002/mrm.20825. [DOI] [PubMed] [Google Scholar]
- 44.Kawamitsu H, Kaji Y, Ohara T, Sugimura K. Feasibility of quantitative intrahepatic lipid imaging applied to the magnetic resonance dual gradient echo sequence. Magn Reson Med Sci. 2003;2:47–50. doi: 10.2463/mrms.2.47. [DOI] [PubMed] [Google Scholar]
- 45.Longo R, Ricci C, Masutti F, Vidimari R, Crocé LS, Bercich L, et al. Fatty infiltration of the liver. Quantification by 1H localized magnetic resonance spectroscopy and comparison with computed tomography. Invest Radiol. 1993;28:297–302. [PubMed] [Google Scholar]
- 46.Qayyum A, Chen DM, Breiman RS, Westphalen AC, Yeh BM, Jones KD, et al. Evaluation of diffuse liver steatosis by ultrasound, computed tomography, and magnetic resonance imaging: Which modality is best? Clin Imaging. 2009;33:110–5. doi: 10.1016/j.clinimag.2008.06.036. [DOI] [PMC free article] [PubMed] [Google Scholar]
- 47.Yoshimitsu K, Kuroda Y, Nakamuta M, Taketomi A, Irie H, Tajima T, et al. Noninvasive estimation of hepatic steatosis using plain CT vs. chemical-shift MR imaging: Significance for living donors. J Magn Reson Imaging. 2008;28:678–84. doi: 10.1002/jmri.21457. [DOI] [PubMed] [Google Scholar]
- 48.Cowin GJ, Jonsson JR, Bauer JD, Ash S, Ali A, Osland EJ, et al. Magnetic resonance imaging and spectroscopy for monitoring liver steatosis. J Magn Reson Imaging. 2008;28:937–45. doi: 10.1002/jmri.21542. [DOI] [PubMed] [Google Scholar]
- 49.Fishbein M, Castro F, Cheruku S, Jain S, Webb B, Gleason T, et al. Hepatic MRI for fat quantification: Its relationship to fat morphology, diagnosis, and ultrasound. J Clin Gastroenterol. 2005;39:619–25. doi: 10.1097/00004836-200508000-00012. [DOI] [PubMed] [Google Scholar]
- 50.Ataseven H, Yildirim MH, Yalniz M, Bahcecioglu IH, Celebi S, Ozercan IH. The value of ultrasonography and computerized tomography in estimating the histopathological severity of non alcoholic steatohepatitis. Acta Gastroenterol Belg. 2005;68:221–5. [PubMed] [Google Scholar]


