

ABSTRACT
The accumulation of ubiquitylated proteinaceous inclusions represents a complex process, reflecting the disequilibrium between aggregate formation and aggregate clearance. Although decreasing aggregate formation or augmenting aggregate clearance will ultimately lead to a diminished aggregate burden, in terms of disease pathogenesis, the different approaches can have distinct outcomes. Using a novel cell-based assay that can distinguish newly formed versus preformed inclusions, we demonstrate that two proteins previously implicated in the autophagic clearance of expanded polyglutamine inclusions, HspB7 and Alfy (also known as WDFY3), actually affect very distinct cellular processes to affect aggregate burden. Using this cell-based assay, we also establish that constitutive expression of the aggregation-prone protein can measurably slow the elimination of protein aggregates, given that not all aggregates appear to be available for degradation. This new assay can therefore not only determine at what step a modifier might influence aggregate burden, but also can be used to provide new insights into how protein aggregates are targeted for degradation.
KEY WORDS: Protein aggregation, Polyglutamine protein, Chaperone, Autophagy
Highlighted Article: Disequilibrium between aggregate formation and clearance leads to accumulation of aggregated proteins. We have created a new cell-based assay that can determine how modifiers can impact on aggregate burden.
INTRODUCTION
The accumulation of ubiquitylated proteinaceous inclusions is a hallmark of all adult onset neurodegenerative diseases. Although the degree to which these intracellular structures contribute to pathogenesis can be debated, it is clear that their accumulation is an aberrant cellular event. In mouse models of neurodegeneration, elimination of aggregation-prone proteins often correlates with the amelioration of pathogenesis (reviewed in Johnson et al., 2012; Yamamoto and Simonsen, 2010), implying that their elimination might help to reduce toxicity. As such, genetic modifiers of protein accumulation are often sought as potential therapeutic targets to combat adult-onset neurodegenerative disease.
The accumulation of disease-causing proteins is a complex process, reflecting disequilibrium between aggregate formation and aggregate clearance. Aggregate formation begins when the local concentration of the misfolded protein reaches a threshold to allow for seeding and oligomerization. Next, a series of consolidation steps ensue such that the oligomers aggregate into a larger aggregated structure, which can then, in a microtubule-dependent manner, evolve into a larger structure of several microns in diameter known as an aggresome. Aggresomes can form in mitotic and postmitotic cells; however, the classic perinuclear aggresomes that consolidate at the microtubule-organizing center are more commonly found in dividing cells (Kopito, 2000; Stiess et al., 2010). Aggregate clearance can occur at different points, with the aggregated oligomers as the most likely structure targeted for degradation by pathways such as macroautophagy (Ravikumar et al., 2005; Iwata et al., 2005a; Filimonenko et al., 2010). Macroautophagy is a lysosome-mediated pathway that eliminates cytosolic constituents that have been packaged into a transient organelle known as an autophagosome. Although it appears unlikely that a fully intact aggresome can be enveloped into a single autophagosome, smaller aggregated structures up to 1 μm in diameter have been found within these double-membraned structures (Filimonenko et al., 2010). Earlier structures that contribute to aggregate formation, such as misfolded monomeric or perhaps early oligomeric states of an aggregating proteins, might also depend on other degradative pathways, such as the proteasome or chaperone-mediated autophagy (Mak et al., 2010; Ortega and Lucas, 2014; Juenemann et al., 2013; Schipper-Krom et al., 2014; Thompson et al., 2009).
Although decreasing aggregate formation or augmenting aggregate clearance will ultimately lead to diminished aggregate burden, in terms of disease pathogenesis, the different approaches can have distinct outcomes. For example, if the sequestration of misfolded and aggregation prone proteins into inclusion bodies is an acute protective response (Arrasate et al., 2004), inhibition of aggregate formation could promote rather than reduce toxicity, despite decreasing aggregate burden. Conversely, whereas promoting clearance of the misfolded monomer might slow the rate of aggregate formation, such an intervention might not be effective when there is a predominance of preformed aggregates and newly formed aggregates make only a minor contribution. Therefore, to understand fully the potential impact of an approach on pathogenesis, it is important to distinguish experimentally at which state aggregate burden is being affected.
Recently, two very distinct proteins have been implicated in the macroautophagic clearance of a canonical aggregation-prone protein, a fragment of the mutant huntingtin protein with an expanded polyglutamine (polyQ) stretch. Overexpression of either the small heat shock protein B7 (HspB7) (Vos et al., 2010) or the selective macroautophagy adaptor protein Autophagy linked FYVE protein (Alfy, also known as WDFY3) (Filimonenko et al., 2010) leads to fewer protein aggregates and protects against toxicity in fly eye models of polyQ toxicity, suggesting that both proteins act in the same pathway. To explore this, we have created a novel cellular tool that can distinguish newly formed versus preformed inclusions. Using this model, we demonstrate that HspB7 and Alfy overexpression actually effect very distinct cellular processes to influence aggregate burden. Moreover, we establish that the rate of aggregate clearance can be directly affected by the presence of newly formed protein. This new assay can therefore not only determine at what step a modifier might impact on aggregate burden, but can be used to provide new insights into how protein aggregates are readied for degradation.
RESULTS
HspB7 and AlfyC decrease the aggregation of transiently transfected polyQ protein
HspB7 is a poorly characterized small heat-shock protein that is expressed primarily in cardiac and skeletal muscle (Vos et al., 2009). In a screen examining which small heat-shock proteins influence the detergent solubility of expanded polyQ proteins, transient overexpression of HspB7 was effective at preventing inclusion formation and diminishing toxicity in a fly eye model of polyQ toxicity, whereas HspB2, HspB3, HspB5 and HspB10 were not (Vos et al., 2010). To replicate the efficacy of HspB7, we transiently co-transfected a 17-amino-acid fragment of the huntingtin protein (17aaHtt) carrying an expanded polyQ mutation of 103 residues with a monomeric CFP (mCFP) tag (17aaHtt103Q–mCFP) (Yamamoto et al., 2006) with HspB7 or control (Ctrl, empty vector) (Fig. 1A). To measure the amount of SDS-insoluble proteins and soluble polyQ proteins, we used a filter-trap assay (FTA) (Fig. 1Ai,ii) and western blotting (Fig. 1Aiii,iv), respectively. As previously shown, at 24 h post-transfection, overexpression of HspB7 dramatically reduced the amount of insoluble polyQ protein. Unlike previous reports that showed no effect on the SDS-soluble fraction (Filimonenko et al., 2010), however, we found a modest but significant increase in the presence of HspB7.
Fig. 1.
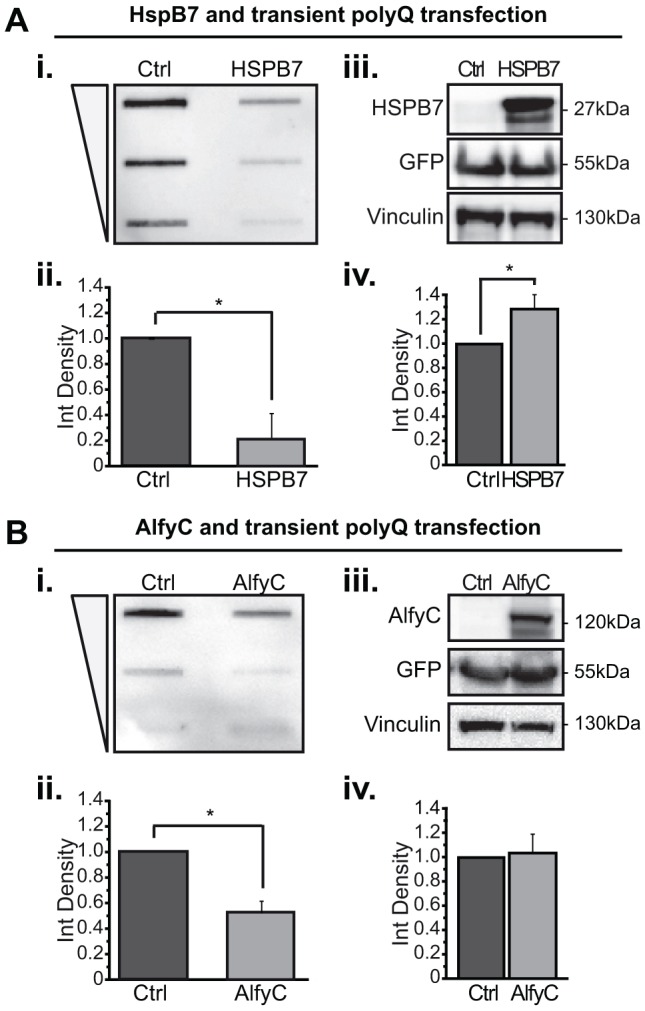
Overexpression of HspB7 or Alfy leads to a decreased amount of insoluble polyQ protein when 17aaHtt103Q–mCFP is transiently transfected. HeLa cells were co-transfected with 17aaHtt103Q–mCFP and either HspB7 (A) or a FLAG tagged C-terminal (2461–3526) construct of Alfy (AlfyC) (B). Samples were prepared at 24 h post-transfection. Samples were analyzed for detergent insoluble protein using a FTA (i,ii). Each sample is slotted across a threefold dilution from high to low, as denoted by the triangle. The densitometry measurement of the highest concentration is quantified. Soluble protein levels and sample loading was confirmed by immunoblotting (iii,iv). 17aaHtt103Q–mCFP protein is probed with anti-GFP antibody. Vinculin is used as a loading control for densitometry quantification. (A) HspB7 co-expression. (i,ii) Quantification of FTA reveals that HspB7 overexpression significantly decreases levels of detergent insoluble 17aaHtt103Q–mCFP protein with 103Q [F(1,4)=46.989; *P=0.0024]. (iii,iv) Western blot analysis also revealed overexpression of HspB7 leads to a small increase of SDS-soluble polyQ protein [F(1,4)=16.685; *P=0.0150]. (B) AlfyC co-expression. (i,ii) FTA reveals that AlfyC co-expression leads to a significant decrease in the amount of detergent insoluble 103Q protein [F(1, 4)=61.670; *P=0.0014]. (iii,iv) Immunoblotting reveals that AlfyC has no effect on the amount of SDS-soluble polyQ protein [F(1,4)=0.061; P=0.8172]. Data represented as mean+s.d. from n=3 independent experiments. Two-tailed ANOVAs were performed to determine statistical significance. Ctrl, empty vector.
Next, we performed similar experiments with Alfy (Fig. 1B). Alfy has been shown to be an adaptor for the selective macroautophagy-dependent degradation of ubiquitylated aggregates (Simonsen et al., 2004; Filimonenko et al., 2010; Clausen et al., 2010). We have previously reported that the overexpression of full-length Alfy or a 100-kDa C-terminal fragment of Alfy (AlfyC), which contains all the functional domains that are required to assist with macroautophagy, is sufficient to increase clearance of polyQ aggregate in stably transfected cell lines, a primary neuronal model and a transgenic fly eye model (Filimonenko et al., 2010). Given that transiently overexpressed polyQ proteins were not explored, we next co-transfected AlfyC with 17aaHtt103Q–mCFP. Similar to with HspB7, co-transfection of AlfyC decreased the SDS-insoluble fraction of 17aaHtt103Q–mCFP (Fig. 1B). Consistent with previous reports (Filimonenko et al., 2010), no change in SDS-soluble protein levels was observed. These data indicate that HspB7 and AlfyC can both diminish the amount of insoluble 17aaHtt103Q–mCFP caused by transient transfection of this expanded polyQ protein, whereas the SDS-soluble protein is differentially affected.
AlfyC, but not HspB7, stimulates clearance of preformed aggregates
Although HspB7 and AlfyC affected the amount of SDS-insoluble polyQ inclusions, co-transfection of a potential modifier with the aggregation-prone protein makes it difficult to determine when the modifier acts on its target. For example, as a chaperone protein, HspB7 might interfere with aggregate formation by maintaining the solubility of the expanded polyQ protein, or it might decrease the levels of polyQ oligomers or aggregates by increasing their degradation. To investigate further how HspB7 and AlfyC impacts on insoluble polyQ protein, we used a tetracycline (tet)-regulatable cell line stably expressing 17aaHtt103Q–mCFP or a similar construct with 65 polyQ residues (17aaHtt65Q–mCFP) (Fig. S1) (Yamamoto et al., 2006). Similar to in disease conditions, these cell lines demonstrate a steady state level of preformed inclusions when maintained in the ‘tet-on’ state, in which 30 to 40% of the cells are positive for aggregates. To eliminate expression, cells are exposed to doxycycline (dox), upon which clearance of aggregates is revealed. Thus, for these experiments, the polyQ-expressing cells were maintained continuously without dox, to maintain the presence of preformed aggregates. First, we overexpressed AlfyC in these cell lines. Similar to in conditions of transient expression, 72 h of AlfyC overexpression decreased the amount of insoluble polyQ protein under conditions of stable polyQ expression (Fig. 2Ai,ii). Levels of SDS-soluble 17aaHtt65Q were unaffected by AlfyC overexpression, consistent with Alfy being an adaptor for aggregated proteins (Fig. 2Aiii,iv).
Fig. 2.

Overexpression of AlfyC but not HspB7 leads to a decrease in the amount of preformed 17aaHtt65Q aggregates in a stably expressing polyQ cell line. (A) AlfyC was transfected into a stable cell line expressing 17aaHtt65Q–mCFP. The stable cell lines are maintained in the absence of dox, and are thus under continuous expression. Samples for FTA (i,ii) and western blotting (iii,iv) were prepared at 72 h post-transfection (n=3). AlfyC diminishes the amount of detergent-insoluble aggregated protein [F(1, 4)=55.902; *P=0.0017] (i,ii); however it has no effect on SDS-soluble 17aaHtt65Q [F(1 ,4)=0.063; P=0.8137] (iii,iv). (B) HspB7 was transfected under the same conditions as A, and samples were prepared for FTA (i,ii) after 24 (n=4), 48 (n=4) or 72 (n=3) hours post-transfection, and western blot analysis (iii,iv) after 24 (n=3), 48 (n=3) or 72 (n=2) hours post-transfection. Both show that HspB7 has no effect on the amount of SDS-insoluble [F(1, 16)=0.539; P=0.4734] or SDS soluble [F(1,10)=0.670; P=0.4321] 17aaHtt65Q–mCFP protein. Western blotting also shows that HspB7 protein decreased in levels within 72 h after transfection. (v,vi) Image-based analysis also reveals that HspB7 does not influence the percentage of cells with 17aaHtt103Q–mCFP aggregates (green) [F(1, 6)=0.366; P=0.5672]. Nuclei are stained with Hoechst 33342 (blue). 100 cells were counted per experimental replicate (n=2). Data represented as mean+s.d. from the number of independent experiments indicated above. Scale bars: 10 μm. Two-tailed ANOVAs were performed to determine statistical significance. Ctrl, empty vector.
We next determined whether HspB7 could reduce the levels of insoluble polyQ proteins under these conditions (Fig. 2B). Despite the robust response we observed in Fig. 1A, overexpression of HspB7 had no effect on either the SDS-soluble or -insoluble pool of polyQ protein in cells stably expressing 17aaHtt65Q–mCFP (Fig. 2Bi–iv) or 17aaHtt103Q–mCFP (Fig. S1). To confirm our findings, we also counted the number of CFP-positive inclusions per cell, which also showed no difference between HspB7 and control transfections (Fig. 2Bv,vi; Fig. S1C). These data indicate that unlike AlfyC, HspB7 cannot eliminate preformed polyQ inclusions, suggesting that these two proteins act in different pathways to affect the aggregate burden in cells.
Clearance of accumulated protein in inducible cell line expressing HaloTag-fused polyQ
Our findings represented in Figs 1 and 2 give rise to the question, when does HspB7 or Alfy exert its effect on aggregation? By merely relying on a single fluorophore tag, we are prevented from temporally distinguishing the aggregation events occurring in the cells. Thus, to permit the study of polyQ aggregation over time, we created an inducible stable cell line expressing an exon 1 fragment of Htt with 103 polyQ residues (exon1htt103Q) tagged with HaloTag (exon1Htt103Q–HaloTag) (Fig. 3). HaloTag-fused proteins can be irreversibly labeled with fluorescent dyes such as tetramethylrhodamine (TMR), Oregon Green or coumarin that have been covalently linked to a haloalkane component (Los et al., 2008). Given that ligand binding is irreversible, different fluorescent ligands can be used to pulse-label and study aggregation over time (Fig. S2A). To offer further experimental flexibility, we also used a tet-regulatable design (Fig. S2B) to permit comparison with existing single fluorophore cell lines, such as the 17aaHtt103Q–mCFP used in Fig. 2.
Fig. 3.

The inducible Exon1Htt103Q–HaloTag cell line demonstrates aggregate clearance upon dox administration. (A) EM48 immunofluorescence (green) confirms that the TMR-positive aggregates (red) represent aggregated exon1Htt103Q–HaloTag. Nuclei are stained with Hoechst 33342 (blue). (B) Time line outlining experimental design. Stable cell lines are maintained in the ‘on’ state. At time 0, cells are exposed to 0.5 μM TMR for 30 min, and then doxycycline (dox). Prior to analysis (0 h), and at 24, 48, 72 and 96 h later, cells are exposed to 1.5 mM Oregon Green (OG) for 30 min to label the newly formed exon1Htt103Q–HaloTag protein. (C,D) Representative images (C) and quantification (D) at time 0, 48 and 96 h after treatment with 1 μg/ml of dox. Examining the TMR (red) and Oregon Green (green) channel reveals no detectable Oregon Green staining. Quantification of all of the aggregates detected in both channels reveals that when expression is abolished, aggregates are no longer detectable after 72 h. Very little detectable Oregon-Green-positive structures are found, and the TMR-positive aggregates are primarily cleared. Data represented as mean+s.d. from n=4 independent experiments. An average of 1000 cells per time point was counted. Scale bars: 10 μm.
We have previously found that in our tet-regulatable cells stably expressing 17aaHttpolyQ–mCFP shutting off gene expression using dox leads to aggregate clearance in 3 to 5 days (Fig. S1) (Yamamoto et al., 2006). To ensure that the HaloTag tag did not affect aggregation or clearance, we examined tet-regulatable aggregate clearance in the exon1Htt103Q–HaloTag cells (Fig. 3). First, to ensure that HaloTag did not affect aggregation, cells were maintained in the gene-on state (i.e. no dox) for several passages, then exposed to TMR. We found that TMR-positive aggregates were recognized by the EM48 antibody, indicating that they were specific for the exon1Htt103Q protein (Fig. 3A). Next, using the HaloTag, we examined aggregate clearance with TMR and Oregon Green to label the different populations of exon1Htt103Q (Fig. 3B). Initially, prior to dox administration, TMR was added to label all of the existing exon1Htt103Q present before shutting off gene expression. Next, dox was administered to shut off exon1Htt103Q expression. After 0 to 96 h and, prior to fixation, Oregon Green was used to label any exon1Htt103Q that might have been newly expressed after dox treatment. Oregon-Green-positive protein would therefore be indicative of any significant leakiness of the tet-regulation.
Image-based analysis at time 0 h revealed that TMR efficiently labeled aggregate-like structures (Fig. 3B,C). At steady state, 40 to 50% of cells contained TMR-positive aggregates, but none were positive for Oregon Green (Fig. 3C,D), indicating that the concentration of TMR used fully occupied the available HaloTag-binding sites. Further analyses of TMR or Oregon Green staining revealed that, similar to with the 17aaHttpolyQ–mCFP cell lines, exposure to dox led to a decrease in the number of cells with aggregates over time. All TMR-positive aggregates were eliminated after 72 h of dox, although a substantial decrease occurred within 48 h (Fig. 3C,D). When examining for Oregon Green staining, there were no aggregates positive for Oregon Green, indicating that there was no detectable leakiness of exon1Htt103Q–HaloTag expression after dox treatment (Fig. 3C,D).
FTA and immunoblotting analyses against the HaloTag tag also showed that under similar conditions, there were no longer detectable levels of SDS-insoluble and soluble exon1Htt103Q–HaloTag protein after 48 h and 24 h, respectively (Fig. 4A). Lysosomal inhibition using 10 μM chloroquine (Chlor) significantly impeded the clearance of the insoluble polyQ but not of soluble polyQ protein (Fig. 4B), suggesting that only the aggregates were being degraded by macroautophagy, consistent with the data collected from mCFP-tagged cells lines (Yamamoto et al., 2006; Filimonenko et al., 2010). To determine whether exon1Htt103Q–HaloTag colocalizes to autophagosomes, we next examined primary cortical neurons generated from mice expressing a GFP-tagged form of the mammalian homolog of Atg8, MAP1 light chain 3B (LC3, also known as MAP1LC3B) (Mizushima et al., 2004), an autophagosome marker (Kabeya et al., 2000). Primary cortical neurons were transiently transfected with exon1Htt103Q–HaloTag and then exposed to TMR. Confocal microscopy revealed that TMR-positive structures colocalized to GFP–LC3 positive structures (Fig. 4C). In summary, these data indicate that the exon1Htt103Q–HaloTag can be used to monitor the formation and clearance of aggregated polyQ proteins.
Fig. 4.

The exon1HTT103Q–HaloTag aggregates are cleared in a lysosome-dependent manner. (A) FTA (i,ii) and western blotting (iii,iv) were used to study the clearance of exon1Htt103Q–Halotag (103Q-HT or HT) protein. Membranes were probed with an anti-HaloTag antibody. (i,ii) Detergent-insoluble exon1Htt103Q–HaloTag protein could no longer be detected after 48 h. Based on Fig. 3, this suggests that image-based analysis might be more sensitive for analysis of clearance in this cell line. (iii,iv) Western blot analysis shows that detergent-soluble protein is cleared within 24 h. (B) Exon1Htt103Q–HaloTag cells were exposed to 1 µg/ml dox without or with 10 µM of the lysosome inhibitor chloroquine (Chlor) for 48 h. Samples were analyzed by FTA (i,ii) or western blotting (iii). The presence of Chlor significantly impedes the clearance of the detergent insoluble protein [F(2, 6)=214.395, *P=0.0015]. Lysosomal inhibition did not retard the clearance of soluble exon1Htt103Q protein [F(2, 6)=2578.875, P=0.8616]. The accumulation of LC3 II (the lipidated form of LC3) signifies diminished autophagosome maturation, confirming lysosome inhibition. (C) Exon1Htt103Q–HaloTag colocalizes with GFP–LC3 in primary neurons. Primary cortical neurons generated from GFP–LC3 transgenic mice were transiently transfected with exon1Htt103Q–HaloTag, and exposed to TMR 24 h later. Data represented as mean+s.d. from n=3 independent experiments. Scale bar: 10 μm. Two-tailed ANOVAs were performed to determine statistical significance.
HaloTag tracks the formation and clearance of aggregates over time
Although using the tet-regulatable system in different systems has revealed that mitotic and postmitotic cells have the innate capacity to eliminate protein aggregates (Filimonenko et al., 2010; Yamamoto et al., 2006, 2000), it remains uncertain whether aggregate clearance can still occur under conditions of continuous expression. This apparent subtlety is relevant because it more accurately reflects the physiological conditions under which aggregate clearance would be occurring. It is plausible that under continuous expression, seeded aggregates would continue to evolve, owing to the continuous addition of newly forming oligomers. In this model, growing aggregates might not be properly targeted and/or trafficked for degradation. Additionally, the study of aggregate clearance in dividing cells can be further confounded by cytoplasmic dilution and asymmetric segregation (Rujano et al., 2006). Although the HaloTag will not necessarily eliminate the impact of dilution or segregation, unlike using a single fluorophore tag, a single population of aggregates can be tracked over time, despite the addition of new protein, thus making the confounds due to cell division less invisible. Therefore, we next used the exon1Htt103Q–HaloTag cell line to determine whether aggregates are degraded during constitutive expression of the polyQ protein (Fig. 5).
Fig. 5.

Exon1Htt103Q–HaloTag cell lines can be used to monitor aggregate formation, growth and clearance under the continuous presence of polyQ protein. (A) Schematic of the experiment design. Cells were exposed to 0.5 μM TMR (red) for 30 min. Prior to collection at the times indicated, cells were also exposed to Oregon Green (OG, green) for 30 min. (B–D) Representative images [at 0 h (B), 24, 48, 72 and 96 h (C)] and quantification (D) of TMR- or Oregon Green-positive aggregates. Areas highlighted in the white box are shown at higher magnification below the respective image. Cells reveal that aggregate clearance can occur during continuous expression of exon1Htt103Q–HaloTag. At 0 h all aggregates are TMR-positive with little to no detectable Oregon-Green-positive structures. As time progresses, there is a gradual shift such that after 96 h most of the TMR-positive aggregates are cleared and are positive for Oregon Green. (E,F) Under conditions of continuous expression, aggregates can be positive for two different HaloTag ligands. (E) Representative image of a coumarin-positive aggregate, which continued to grow to incorporate new TMR-positive exon1Htt103Q–HaloTag protein. 24 h after coumarin, TMR was administered to label this newly expressed protein. (F) Re-analysis of the data represented in D to include TMR-only, TMR and Oregon Green double-positive and Oregon-Green-only aggregates reveals that TMR-only aggregates are short lived and are either cleared or continue to further incorporate protein. By 96 h, most of the TMR-containing aggregates are eliminated and become mostly only positive for Oregon Green. Nuclei are stained with Hoechst 33342 (blue). Data represented as mean±s.d. from n=4 independent experiments. An average of 1000 cells per time point was counted. Scale bars: 10 μm.
To differentially label the pools of exon1Htt103Q, TMR and Oregon Green were used at different times. Similar to Fig. 3, cells were allowed to attain steady state under tet-on conditions. At time 0, cells were exposed to TMR to label all of the pre-existing protein. Next, to label the subsequently formed protein and aggregates, cells were labeled with Oregon Green 0, 24, 48, 72 or 96 h later, and then collected for analyses (Fig. 5A). First, TMR-positive versus the Oregon-Green-positive staining was examined. At time 0, similar to in Fig. 3D, there were many TMR-positive structures, but no Oregon-Green-only aggregates present (Fig. 5B). As time progressed, the number of TMR-positive aggregates decreased as the number of Oregon-Green-positive aggregates increased (Fig. 5C,D). These data indicate that aggregate clearance occurs despite continuous expression of exon1Htt103Q–HaloTag, and that clearance occurred in the background of new aggregates being formed. Furthermore, the rate at which the number of Oregon-Green-positive aggregates grew between 24 and 48 h (from 6±5% to 40±13%) compared to that at which the number TMR-positive aggregates fell (44±17% to 28±9%; mean±s.d. from n=4 independent experiments) suggests that the rate at which aggregates form is greater than the rate at which they are cleared. Finally, even after 96 h, the number of TMR-positive aggregates did not fully decline, indicating that although clearance can occur, TMR-positive structures persist much longer under constitutive expression of mutant protein than when mutant protein expression is eliminated after aggregate formation.
The analyses performed thus far examined the TMR-staining and Oregon Green staining independently of each other. As shown in Fig. 5C, the addition of Oregon Green after TMR can lead to the formation of aggregates that are positive for both ligands. This colocalization indicates the incorporation of newly formed Oregon-Green-positive protein into the pre-existing TMR-positive aggregates. This was confirmed by confocal analysis. When TMR was added 24 h after another HaloTag-ligand coumarin, coumarin-positive aggregates can be found surrounded by TMR-positive ones (Fig. 5E). Similar results can be seen with other HaloTag-ligand combinations (data not shown).
We next re-analyzed the data for TMR-only, Oregon Green-only, and TMR and Oregon Green double-positive aggregates. In the presence of dox, re-analysis had little impact, given that no substantial levels of mutant protein were being newly created (Fig. S3A). In contrast, under conditions of constitutive expression, segregating the TMR and Oregon Green double-positive aggregates revealed that TMR-only aggregates were eliminated within 72 h (Fig. 5F), which is similar to the rate observed in the presence of dox (Fig. 3D). Unlike dox-treatment, however, many of the TMR-only structures evolved into TMR and Oregon Green double-positive aggregates, indicating that addition of newly formed Oregon-Green-positive protein onto pre-existing TMR-positive aggregates accounts for the diminished clearance observed in Fig. 5D. The sum of TMR-only, TMR and Oregon Green double-positive, and Oregon Green-only aggregates were the same across all time points, confirming that the system had reached steady state (Fig. S3B). These data signify that in order to be degraded, aggregates must reach a state at which they no longer can incorporate newly synthesized protein. Analysis of the Oregon-Green-only structures revealed that aggregates can form de novo in the background of aggregate clearance and aggregate growth; however, during the time at which preformed inclusions are present, consolidation of newly formed protein into pre-existing aggregates is dominant to the formation of new ones. In summary, our analyses reveal that by using HaloTag to temporally label the aggregation-prone proteins, we can distinguish how aggregation evolves in the cell, and at what stage these structures can finally be eliminated.
HspB7 affects aggregate formation and AlfyC affects aggregate clearance
Having established our exon1Htt103Q–HaloTag cell line, we returned to HspB7 and AlfyC to test the hypothesis that HspB7 interferes with aggregate formation whereas AlfyC affects aggregate clearance (Fig. 6). We first examined the overexpression of HspB7 (Fig. 6A–C). HspB7 was transfected into exon1Htt103Q–HaloTag cells that were labeled with TMR to label the existing protein and aggregates. At 72 h post-transfection, cells were labeled with Oregon Green, then fixed and analyzed. Confirming our findings in 17aaHttpolyQ–mCFP cells (Fig. 2), HspB7 overexpression had no effect on the total number of aggregates (Fig. 6B). When broken down by ligand, HspB7 had no effect on TMR-only structures, no effect on TMR and Oregon Green double-positive structures but a significant effect on Oregon-Green-only structures. These data indicate that once an aggregate forms, HspB7 has little impact on its turnover (TMR-only), and cannot disrupt the further oligomerization of aggregates (both TMR and Oregon Green). By contrast, HspB7 reduced de novo formation of aggregates as revealed by the reduction of Oregon-Green-only structures. Nonetheless, they are but a small percentage of the total aggregates present (Fig. 6C), and thus there was little impact on the total aggregate population. This is consistent with what has been reported previously (Vos et al., 2010) and what we find here, that is, co-transfection of HspB7 with the aggregation-prone protein leads to a dramatic impact on aggregation by affecting the formation of SDS-insoluble inclusions. Although HspB7 continues to exert its function in Fig. 2, its effect is masked by the fact that very few aggregates are formed de novo in the presence of preformed inclusions. By using the HaloTag, this distinction could be observed.
Fig. 6.

HspB7 suppresses the formation of new aggregates, whereas AlfyC stimulates the clearance of aggregates that are no longer growing. Exon1Htt103Q–HaloTag cells were transfected with HspB7 or AlfyC with their respective Ctrl (empty vector). After exchanging the transfection medium, cells were exposed to TMR (red) to label pre-existing protein. After 48 to 72 h, Oregon Green (OG) was added to label newly expressed proteins, then cells were analyzed for TMR-only, TMR and Oregon Green double-positive and Oregon-Green-only positive structures. Nuclei are stained with Hoechst 33342 (blue). (A–C) HspB7-transfected cells. (A) Representative images 48 h after Ctrl or HspB7 transfection. Areas highlighted in the white boxes are shown at higher magnification below the respective image. (B) Quantification of TMR-only, Oregon Green double-positive and Oregon-Green-only aggregates normalized to Ctrl. Similar to in Fig. 2B, HspB7 does not decrease the total number of aggregates [F(1,10)=0.024; P=0.8800], because HspB7 does not affect the number of pre-existing (TMR-only) and growing (TMR and Oregon Green) aggregates [F(1,10)=4.224; P=0.697 and F(1,10)=1,149; P=3.090, respectively]. HspB7 overexpression, however, leads to a significant decrease of Oregon-Green-only aggregates [F(1,10)=12.247; *P=0.0057], indicating that HspB7 affects the formation of new aggregates. (C) Graphical representation of how the different aggregate stages are represented in the total number. Consistent with Fig. 5, the majority of the aggregates are TMR and Oregon Green double-positive, followed by TMR-only then Oregon Green-only. Therefore, despite the impact HspB7 had on Oregon-Green-only aggregates, there was not a significant impact on the total number of aggregates present. (D–F) AlfyC-transfected cells. (D) Representative images 72 h after Ctrl or AlfyC transfection. (E) Quantification of TMR-only, TMR and Oregon Green double-positive and Oregon-Green-only aggregates normalized to Ctrl. Similar to in Fig. 2A, AlfyC decreases the total number of aggregates [F(1,10)=32.595; P=0.0002]. This decrease is due to a significant decrease in TMR-only and Oregon-Green-only aggregates [F(1,10)=71.548; P<0.0001 and F(1,10)=11.111; P=0.0076, respectively]. There was no impact on the TMR and Oregon Green double-positive growing aggregates in the presence of AlfyC [F(1,10)=2.054; P=0.1823]. (F) Graphical representation of how the different aggregate stages are represented within the total number of aggregates. Data are represented as mean+s.d. from n=6 independent experiments. An average of 750 cells per time point was counted. Scale bars: 10 μm. Two-tailed ANOVAs were performed to determine statistical significance. n.s., not statistically significant.
We next examined the effect of AlfyC using the same protocol outlined above (Fig. 6D–F). Overexpression of AlfyC significantly decreased the total number of aggregates, and does so by decreasing TMR-only preformed inclusions and modestly reducing Oregon-Green-only inclusions. Interestingly, the overexpression of Alfy had no effect on the total number of TMR and Oregon Green double-positive structures. Taken together with Fig. 5, these data suggest that AlfyC can recognize protein aggregates that are preformed or newly formed and target them for degradation; however, aggregates that also contain newly formed proteins are somehow not available for Alfy-mediated targeting, thus limiting the efficacy of Alfy. Although it is possible that smaller, discrete TMR-only or Oregon-Green-only structures within the TMR and Oregon Green double-positive aggregates are being targeted for degradation, the efficiency is not such that the total number of TMR Oregon Green double-positive structures is diminished. Given that this latter pool of double-positive structures represent the clear majority of aggregates, identifying modifiers that affect this pool might have the greatest impact on aggregate burden.
DISCUSSION
The aberrant accumulation of aggregated proteins and their potential link to toxicity makes identifying modifiers of protein accumulation an attractive therapeutic target. Furthermore, understanding how these modifiers exert their mechanism of action is likely to be more beneficial than simply measuring aggregate load as a final outcome. By using irreversible labeling with a variety of fluorophore-based HaloTag ligands, we have been able to gain a greater understanding of the accumulation of a class of aggregation-prone proteins. We have found that preformed inclusions are degraded both in the presence and absence of newly synthesized protein, and that aggregates must reach a degradation-competent state to be targeted for elimination. Moreover, by examining the influence of two proteins previously described to inhibit protein accumulation similarly, we have been able to demonstrate that comparable outcomes can be reached by affecting discrete stages of protein accumulation and clearance.
This study highlights several points. First, we introduce a novel method by which we can distinguish how a given pathway or modifier affects protein accumulation. Different degradation pathways have been implicated in affecting the accumulation of aggregation-prone proteins, from proteasome-mediated degradation (Mishra et al., 2008; Iwata et al., 2009; Zhang et al., 2010; Urushitani et al., 2010; Ortega and Lucas, 2014; Schipper-Krom et al., 2014) to the lysosome-mediated pathway or macroautophagy as being the predominant pathway for aggregate clearance (Ravikumar et al., 2002; Iwata et al., 2005b; Yamamoto et al., 2006; Pankiv et al., 2007; Lamark et al., 2009; Fan et al., 2010; Lamark and Johansen, 2012; Odagiri et al., 2012; Castillo et al., 2014; Bae et al., 2014). Our ability to interrogate how each pathway might contribute to aggregate turnover has been limited by our inability to temporally characterize aggregate formation and clearance in cells. For example, although several studies indicate that macroautophagy eliminates aggregated proteins, the underlying molecular mechanism remains unclear. Currently, several molecular scaffolding proteins have been implicated in the process (Mijaljica et al., 2012; Lamark and Johansen, 2012; Rogov et al., 2014). We find that the molecular scaffold Alfy, which bridges the ubiquitylated protein with the core machinery involved in autophagosome formation (Filimonenko et al., 2010), targets aggregated structures for degradation rather than the detergent-soluble form. Moreover, the aggregates that can be targeted must be static and inert to newly synthesized aggregating proteins. Using a similar approach, the impact of the other implicated scaffolds, such as p62 (also known as SQSTM1) (Pankiv et al., 2007), NBR1 (Kirkin et al., 2009) and others (Korac et al., 2013; Rogov et al., 2014), can be examined with our newly created assay, to establish temporally when these scaffolds influence clearance. Further study might also determine how an aggregate transitions from a degradation-competent, TMR-only state to a TMR and Oregon Green double-positive state. One weakness of our approach, however, is that it is currently difficult to achieve sub-saturation levels of fluorescent intensity of a given dye, thus the actual amounts of protein rather than number of aggregated structures is difficult to interpret. The development of a dark HaloTag dye would help to dilute the amount of fluorescent dye used without affecting our ability to fully occupy the binding sites in the HaloTag. Nonetheless, our findings strongly suggest that even simply examining the number of structures transitioning between the two aggregated states might lead to strategies that will hasten the clearance of these otherwise persistent structures.
Next, our data revealed that even the most robust modifiers of aggregate formation can have a minimal effect on preformed inclusions. Of all the small heat-shock proteins examined, HspB7 was the most potent inhibitor of aggregation (Vos et al., 2010). Despite this, we found that in the presence of preformed inclusions, the ability of HspB7 to reduce aggregate load is minimal. Our findings suggest that HspB7 prevents the de novo formation of aggregates, but once preformed inclusions are present, newly formed aggregates make a relatively small contribution to total aggregate load, and thus the impact of HspB7 is lost. Although HspB7 affected a pre-aggregated structure, surprisingly, the chaperone did not prevent aggregate growth. This implies that HspB7 either affects newly formed aggregates by preventing the seeding event, or cannot sufficiently inhibit aggregate growth because the rate of oligomer incorporation is too great.
In summary, the final outcome of aggregate load is the sum of a complex series of discrete cellular events that can be differentially affected by modifiers. Although the ultimate goal of therapeutic approaches to treat neurodegeneration may be to diminish the abnormal accumulation of ubiquitylated proteins, simply focusing on this final outcome might mask the mechanism by which aggregate load is affected, which in turn might lead to disappointing outcomes when tested under physiological conditions. To overcome these limitations, we created an inducible stable cell line that temporally labels the aggregating protein to expose how a modifier influences aggregate load, and revealed that the mechanism of action, and hence therapeutic potential, of two apparently similarly acting proteins were quite distinct. Moreover, this assay revealed that the growing aggregate pool represents the majority of aggregates under conditions where aggregates are already present, thus leading to the prediction that identification of modifiers that prevent aggregates from incorporated newly formed proteins will have the greatest impact on aggregate burden and thus disease progression.
MATERIALS AND METHODS
Antibodies
The following antibodies were used for immunoblotting and/or FTA: rabbit anti-FLAG [polyclonal, 1:400 (2.5 µg/ml); Sigma]; mouse anti-GFP (polyclonal, 1:1000; Roche); chicken anti-GFP (1:1000; Abcam); rabbit anti-HaloTag (1:500; Promega); mouse anti-HspB7 (1:500; Abnova); rabbit anti-LC3B (ab48394, 1:1000; Abcam); and rabbit anti-vinculin (1:5000; Life Technologies). Mouse anti-EM48 (1:100; EMD Millipore, Billerica, MA) was used for immunofluorescence.
Plasmids
HspB7 and AlfyC constructs were created as previously described (Filimonenko et al., 2010; Vos et al., 2010). The Exon1htt103Q construct with alternating CAGCAA repeats was received from Alexei Kazantsev (MassGeneral Institute for Neurodegenerative Disease, Massachusetts General Hospital, USA) (Kazantsev et al., 1999). Exon1htt103Q–HaloTag construct was created by subcloning Exon1Htt103Q into pHT2 (Promega) using the restriction enzymes NheI and BamHI. This was subsequently subcloned into the NheI/NaeI sites in the pBi4 TetO inducible vector (Baron et al., 1995).
Cell culture
HeLa cell cultures were maintained in high-glucose Dulbecco's modified eagle medium (DMEM; Life Technologies) supplemented with 10% fetal bovine serum (FBS; Life Technologies) at 37°C and in a 5% CO2-containing atmosphere. 17aaHtt-polyQ–mCFP cell lines were maintained using 100 μg/ml of hygromycin (Life Technologies) and 50 μg ml−1 of G418 (Life Technologies) as described previously (Yamamoto et al., 2006). Lysosome inhibition was achieved using chloroquine (Chlor) (10 μM, Sigma). All cell lines were confirmed by PCR to be negative for mycoplasm, and are grown in the absence of penicillin and streptomycin.
Transfection
Cells were plated in a 6- or 24-wells plate and transfected 24 h later with AlfyC or HspB7 plasmid DNA alone using Lipofectamine (Life Technologies) or co-transfected with 17aaHtt65Q–mCFP or 17aaHtt103Q–mCFP using Lipofectamine 2000 (Life Technologies) according to the manufacturer's protocol. Single plasmid transfections were conducted with 1.0 μg of plasmid DNA in six-well plates and 0.3 μg of plasmid DNA in 24-well plates. Co-transfections were performed using 0.5 μg of 17aaHtt103Q–mCFP and 1.0 μg HspB7 or AlfyC plasmid DNA. Cells were incubated with transfection medium for 5 h then changed into DMEM with 10% FBS overnight. Cells were collected and analyzed as described in the respective figure legends. Briefly, for image-based analyses, cells were plated onto coverslips, treated as described, then mounted with ProLong Antifade Gold with DAPI (Molecular Probes).
Primary neurons
The use of GFP–LC3-expressing mice (Mizushima et al., 2004) complied with the Guide for Care and Use of Laboratory Animals and were approved by the IACUC committee at Columbia University. Mice were maintained in a 12-h-light–12-h-dark cycle in a temperature and humidity controlled environment, with ad libitum access to food and water. GFP–LC3-expressing mice (C57BL/6) were maintained as homozygous and genotyped as described previously (Kuma and Mizushima, 2008). Primary dissociated cortical cultures were prepared from postnatal day 0 (P0) pups. The cortical lobes were dissected in ice cold DMEM/F12 (Life Technologies) containing 10% heat-inactivated FBS and trypsinized for 30 min at 37°C, then triturated in fresh 10% FBS DMEM/F12 through a fire-polished glass pipette and filtered through a 40-μm nylon cell strainer. For transient transfection, cells were plated at a density of 1.0×10⁶ cells/well onto coverslips coated with 20 μg/ml poly D-lysine (Sigma) and 5 µg/ml mouse laminin (Life Technologies). The medium was changed 2 h after plating to Neurobasal medium (Life Technologies) containing 0.5 mM L-glutamine, 1× B27 supplement (Life Technologies), 2% heat-inactivated FBS and 1× antibiotic (Life Technologies). 1.5 μM coumarin HaloTag ligand (Promega) was added to the medium 24 h post-transfection for 1 h, followed by a complete change in medium. After 24 h 500 nM TMR HaloTag ligand (Promega) was added for 30 min and cells were fixed in 4% paraformaldehyde in PBS and mounted under coverslips with Prolong Antifade Gold (Life Technologies).
The exon1Htt103Q–HaloTag inducible cell line was created from the polyQ–HaloTag cell line using methods previously described (Cremona et al., 2011; Yamamoto et al., 2006). Briefly, pBi4-exon1Htt103Q-HT was co-transfected at a 1:10 ratio with Ptk-hygro into tTA-positive HeLa cells (Clontech). Selection of clones was achieved by using 800 µg ml−1 hygromycin. tTA-positive cells were maintained in medium that contained 50 µg ml−1 G418. A concentration of 1 μg/ml dox was sufficient to shut off production of new exon1Htt103Q–HaloTag protein. This cell line was maintained by culturing in the presence of 100 μg ml−1 of hygromycin and 50 μg ml−1 of G418. 500 nM TMR HaloTag ligand (Promega) or 1.5 μM Oregon Green HaloTag ligand (Promega) was incubated with the cells for 30 min at 37°C, followed by three washes with culture medium at the time points shown. For the experiments performed in Fig. 6, protein was labeled with TMR following a 5-h incubation in transfection medium.
Western blotting and FTA
Sample preparation
Cells were washed with PBS, trypsinized and pelleted. Cells were lysed in 1% PBS with Triton X-100 containing 8 M Urea, 5 mM EDTA, 100 mM NaCl and 50 mM Tris-HCl, and incubated on ice for 20 min. 1× protease/phosphatase inhibitor cocktail (Thermo Fisher Scientific) was freshly added each time to the lysis buffer. Transiently transfected polyQ samples were centrifuged at 2655 g, whereas stably expressing polyQ samples were centrifuged at 20,817 g. Samples were centrifuged in an Eppendorf 5417R at 4°C. Pellets were discarded and supernatants were used for both western blotting and filter trap assay. Protein concentrations of the supernatant fractions were determined by the DC protein assay reagent (Bio-Rad, Hercules, CA) and equal concentrations of protein were eluted in 4× LDS sample buffer (Life Technologies) and 50 mM 1,4-dithiothreitol (DTT, Sigma). Samples were processed for both FTA and western blot analysis to prevent extended exposure to urea.
Western blot analysis
20 μg of protein was boiled for 5 min and loaded on a 4–12% NuPAGE Bis-Tris gel (Life Technologies), and transferred onto PVDF membranes with a 0.2 μm pore size (Life Technologies). The blots were blocked for 1 h in PBS containing 1% Tween-20 and 3% BSA at room temperature, and probed overnight with primary antibodies at 4°C. Next day, membranes were washed three times with PBS containing 1% Tween-20 and incubated for 1 h with horseradish peroxidase (HRP)-conjugated secondary antibodies (Thermo Fisher Scientific) at a dilution of 1:5000 to 1:10,000. Signal was detected with SuperSignal WestDura Substrates (Thermo Fisher Scientific). Blots were developed using the VersaDoc Imaging system (Bio-Rad). The intensities of the different bands were measured using the software provided by the VersaDoc Imaging system.
Filter trap assay
Either three- or five-fold dilutions of protein was prepared and slotted onto a pre-washed (PBS 0.1% SDS) 0.2 μM cellulose acetate membrane (0.2 μM pore size, GE Healthcare Life Sciences, Marlborough, MA) using a Bio-Dot 29 microfiltration apparatus (Bio-Rad). Gentle suction was applied to trap the detergent and urea-insoluble protein. Membranes were then removed and washed three times with PBS containing 0.1% SDS, and blocked in PBS containing 1% Tween-20 with 3% BSA at for at least 2 h room temperature or overnight at 4°C, then processed in the same manner as for immunoblotting described above.
Aggregate counting
Cells readied for image-based analysis were plated on glass coverslips then processed as described in the figure legends. After the allotted time, coverslips were washed with PBS containing 100 μM CaCl2 and 1 mM MgCl2 then fixed with 4% paraformaldehyde in PBS. Nuclei were stained using 1 μg/ml Hoechst 33342 (Life Technologies) for 10 min. After three washing steps with PBS, the coverslips were mounted using ProLong Antifade Gold (Life Technologies). The images were acquired using a Leica SP5 confocal microscope (fields were acquired randomly, and adequate cell numbers were confirmed by imaging for Hoechst 33342) and counting of the aggregates was performed using Image J (NIH). For the quantification of these experiments, a minimum of 100 cells per condition per experiment were counted.
Statistical analyses, figure creation and software used
One or two-way two-tailed analyses of variance (ANOVA) were performed unless otherwise noted. All statistical analyses were performed using Statview 5.0 (SAS Institute, Cary, NC). The respective n-values were ascertained using power analyses. Adobe Creative Suite 5 (Photoshop and Illustrator) were used to create all figures, whereas quantification was performed using ImageJ (NIH).
Acknowledgements
We would like to thank the Kampinga and Yamamoto laboratories for their helpful input and critical reading of this manuscript.
Footnotes
Competing interests
The authors declare no competing or financial interests.
Author contributions
J.M.D. and E.E. conducted experiments; J.M.D., E.E., H.H.K. and A.Y. designed experiments and methodologies; E.E. and A.Y. analyzed data; E.E. and A.Y. wrote the manuscript.
Funding
This work was supported by the National Institutes of Health [grant numbers RO1 NS063973 to A.Y., RO1NS077111 to A.Y.]; Parkinson's Disease Foundation (to A.Y.); Prinses Beatrix Foundation (to E.E.); and the Marco Polo Fund, University of Groningen (to E.E. and H.H.K.). Deposited in PMC for release after 12 months.
Supplementary information
Supplementary information available online at http://jcs.biologists.org/lookup/suppl/doi:10.1242/jcs.179978/-/DC1
References
- Arrasate M., Mitra S., Schweitzer E. S., Segal M. R. and Finkbeiner S. (2004). Inclusion body formation reduces levels of mutant huntingtin and the risk of neuronal death. Nature 431, 805-810. 10.1038/nature02998 [DOI] [PubMed] [Google Scholar]
- Bae E.-J., Lee H.-J., Jang Y.-H., Michael S., Masliah E., Min D. S. and Lee S.-J. (2014). Phospholipase D1 regulates autophagic flux and clearance of alpha-synuclein aggregates. Cell Death Differ. 21, 1132-1141. 10.1038/cdd.2014.30 [DOI] [PMC free article] [PubMed] [Google Scholar]
- Baron U., Freundlieb S., Gossen M. and Bujard H. (1995). Co-regulation of two gene activities by tetracycline via a bidirectional promoter. Nucleic Acids Res. 23, 3605-3606. 10.1093/nar/23.17.3605 [DOI] [PMC free article] [PubMed] [Google Scholar]
- Castillo K., Nassif M., Valenzuela V., Rojas F., Matus S., Mercado G., Court F. A., van Zundert B. and Hetz C. (2014). Trehalose delays the progression of amyotrophic lateral sclerosis by enhancing autophagy in motoneurons. Autophagy 9, 1308-1320. 10.4161/auto.25188 [DOI] [PubMed] [Google Scholar]
- Clausen T. H., Lamark T., Isakson P., Finley K., Larsen K. B., Brech A., Øvervatn A., Stenmark H., Bjorkoy G., Simonsen A. et al. (2010). p62/SQSTM1 and ALFY interact to facilitate the formation of p62 bodies/ALIS and their degradation by autophagy. Autophagy 6, 330-344. 10.4161/auto.6.3.11226 [DOI] [PubMed] [Google Scholar]
- Cremona M. L., Matthies H. J. G., Pau K., Bowton E., Speed N., Lute B. J., Anderson M., Sen N., Robertson S. D., Vaughan R. A. et al. (2011). Flotillin-1 is essential for PKC-triggered endocytosis and membrane microdomain localization of DAT. Nat. Neurosci. 14, 469-477. 10.1038/nn.2781 [DOI] [PMC free article] [PubMed] [Google Scholar]
- Fan W., Tang Z., Chen D., Moughon D., Ding X., Chen S., Zhu M. and Zhong Q. (2010). Keap1 facilitates p62-mediated ubiquitin aggregate clearance via autophagy. Autophagy 6, 614-621. 10.4161/auto.6.5.12189 [DOI] [PMC free article] [PubMed] [Google Scholar]
- Filimonenko M., Isakson P., Finley K. D., Anderson M., Jeong H., Melia T. J., Bartlett B. J., Myers K. M., Birkeland H. C., Lamark T. et al. (2010). The selective macroautophagic degradation of aggregated proteins requires the PI3P-binding protein Alfy. Mol. Cell 38, 265-279. 10.1016/j.molcel.2010.04.007 [DOI] [PMC free article] [PubMed] [Google Scholar]
- Iwata A., Christianson J. C., Bucci M., Ellerby L. M., Nukina N., Forno L. S. and Kopito R. R. (2005a). Increased susceptibility of cytoplasmic over nuclear polyglutamine aggregates to autophagic degradation. Proc. Natl. Acad. Sci. USA 102, 13135-13140. 10.1073/pnas.0505801102 [DOI] [PMC free article] [PubMed] [Google Scholar]
- Iwata A., Riley B. E., Johnston J. A. and Kopito R. R. (2005b). HDAC6 and microtubules are required for autophagic degradation of aggregated huntingtin. J. Biol. Chem. 280, 40282-40292. 10.1074/jbc.M508786200 [DOI] [PubMed] [Google Scholar]
- Iwata A., Nagashima Y., Matsumoto L., Suzuki T., Yamanaka T., Date H., Deoka K., Nukina N. and Tsuji S. (2009). Intranuclear degradation of polyglutamine aggregates by the ubiquitin-proteasome system. J. Biol. Chem. 284, 9796-9803. 10.1074/jbc.M809739200 [DOI] [PMC free article] [PubMed] [Google Scholar]
- Johnson C. W., Melia T. J. and Yamamoto A. (2012). Modulating macroautophagy: a neuronal perspective. Future Med. Chem. 4, 1715-1731. 10.4155/fmc.12.112 [DOI] [PMC free article] [PubMed] [Google Scholar]
- Juenemann K., Schipper-Krom S., Wiemhoefer A., Kloss A., Sanz Sanz A. and Reits E. A. J. (2013). Expanded polyglutamine-containing N-terminal huntingtin fragments are entirely degraded by mammalian proteasomes. J. Biol. Chem. 288, 27068-27084. 10.1074/jbc.M113.486076 [DOI] [PMC free article] [PubMed] [Google Scholar]
- Kabeya Y., Mizushima N., Ueno T., Yamamoto A., Kirisako T., Noda T., Kominami E., Ohsumi Y. and Yoshimori T. (2000). LC3, a mammalian homologue of yeast Apg8p, is localized in autophagosome membranes after processing. EMBO J. 19, 5720-5728. 10.1093/emboj/19.21.5720 [DOI] [PMC free article] [PubMed] [Google Scholar]
- Kazantsev A., Preisinger E., Dranovsky A., Goldgaber D. and Housman D. (1999). Insoluble detergent-resistant aggregates form between pathological and nonpathological lengths of polyglutamine in mammalian cells. Proc. Natl. Acad. Sci. USA 96, 11404-11409. 10.1073/pnas.96.20.11404 [DOI] [PMC free article] [PubMed] [Google Scholar]
- Kirkin V., Lamark T., Sou Y.-S., Bjørkøy G., Nunn J. L., Bruun J.-A., Shvets E., Mcewan D. G., Clausen T. H., Wild P. et al. (2009). A role for NBR1 in autophagosomal degradation of ubiquitinated substrates. Mol. Cell 33, 505-516. 10.1016/j.molcel.2009.01.020 [DOI] [PubMed] [Google Scholar]
- Kopito R. R. (2000). Aggresomes, inclusion bodies and protein aggregation. Trends Cell Biol. 10, 524-530. 10.1016/S0962-8924(00)01852-3 [DOI] [PubMed] [Google Scholar]
- Korac J., Schaeffer V., Kovacevic I., Clement A. M., Jungblut B., Behl C., Terzic J. and Dikic I. (2013). Ubiquitin-independent function of optineurin in autophagic clearance of protein aggregates. J. Cell Sci. 126, 580-592. 10.1242/jcs.114926 [DOI] [PMC free article] [PubMed] [Google Scholar]
- Kuma A. and Mizushima N. (2008). Chromosomal mapping of the GFP-LC3 transgene in GFP-LC3 mice. Autophagy 4, 61-62. 10.4161/auto.4846 [DOI] [PubMed] [Google Scholar]
- Lamark T. and Johansen T. (2012). Aggrephagy: selective disposal of protein aggregates by macroautophagy. Int. J. Cell Biol. 2012, 736905 10.1155/2012/736905 [DOI] [PMC free article] [PubMed] [Google Scholar]
- Lamark T., Kirkin V., Dikic I. and Johansen T. (2009). NBR1 and p62 as cargo receptors for selective autophagy of ubiquitinated targets. Cell Cycle 8, 1986-1990. 10.4161/cc.8.13.8892 [DOI] [PubMed] [Google Scholar]
- Los G. V., Encell L. P., Mcdougall M. G., Hartzell D. D., Karassina N., Zimprich C., Wood M. G., Learish R., Ohana R. F., Urh M. et al. (2008). HaloTag: a novel protein labeling technology for cell imaging and protein analysis. ACS Chem. Biol. 3, 373-382. 10.1021/cb800025k [DOI] [PubMed] [Google Scholar]
- Mak S. K., Mccormack A. L., Manning-Bog A. B., Cuervo A. M. and Di Monte D. A. (2010). Lysosomal degradation of alpha-synuclein in vivo. J. Biol. Chem. 285, 13621-13629. 10.1074/jbc.M109.074617 [DOI] [PMC free article] [PubMed] [Google Scholar]
- Mijaljica D., Nazarko T. Y., Brumell J. H., Huang W.-P., Komatsu M., Prescott M., Simonsen A., Yamamoto A., Zhang H., Klionsky D. J. et al. (2012). Receptor protein complexes are in control of autophagy. Autophagy 8, 1701-1705. 10.4161/auto.21332 [DOI] [PMC free article] [PubMed] [Google Scholar]
- Mishra A., Dikshit P., Purkayastha S., Sharma J., Nukina N. and Jana N. R. (2008). E6-AP promotes misfolded polyglutamine proteins for proteasomal degradation and suppresses polyglutamine protein aggregation and toxicity. J. Biol. Chem. 283, 7648-7656. 10.1074/jbc.M706620200 [DOI] [PubMed] [Google Scholar]
- Mizushima N., Yamamoto A., Matsui M., Yoshimori T. and Ohsumi Y. (2004). In vivo analysis of autophagy in response to nutrient starvation using transgenic mice expressing a fluorescent autophagosome marker. Mol. Biol. Cell 15, 1101-1111. 10.1091/mbc.E03-09-0704 [DOI] [PMC free article] [PubMed] [Google Scholar]
- Odagiri S., Tanji K., Mori F., Kakita A., Takahashi H. and Wakabayashi K. (2012). Autophagic adapter protein NBR1 is localized in Lewy bodies and glial cytoplasmic inclusions and is involved in aggregate formation in alpha-synucleinopathy. Acta Neuropathol. 124, 173-186. 10.1007/s00401-012-0975-7 [DOI] [PubMed] [Google Scholar]
- Ortega Z. and Lucas J. J. (2014). Ubiquitin-proteasome system involvement in Huntington's disease. Front. Mol. Neurosci. 7, 77 10.3389/fnmol.2014.00077 [DOI] [PMC free article] [PubMed] [Google Scholar]
- Pankiv S., Clausen T. H., Lamark T., Brech A., Bruun J.-A., Outzen H., Øvervatn A., Bjørkøy G. and Johansen T. (2007). p62/SQSTM1 binds directly to Atg8/LC3 to facilitate degradation of ubiquitinated protein aggregates by autophagy. J. Biol. Chem. 282, 24131-24145. 10.1074/jbc.M702824200 [DOI] [PubMed] [Google Scholar]
- Ravikumar B., Duden R. and Rubinsztein D. C. (2002). Aggregate-prone proteins with polyglutamine and polyalanine expansions are degraded by autophagy. Hum. Mol. Genet. 11, 1107-1117. 10.1093/hmg/11.9.1107 [DOI] [PubMed] [Google Scholar]
- Ravikumar B., Acevedo-Arozena A., Imarisio S., Berger Z., Vacher C., O'Kane C. J., Brown S. D. M. and Rubinsztein D. C. (2005). Dynein mutations impair autophagic clearance of aggregate-prone proteins. Nat. Genet. 37, 771-776. 10.1038/ng1591 [DOI] [PubMed] [Google Scholar]
- Rogov V., Dötsch V., Johansen T. and Kirkin V. (2014). Interactions between autophagy receptors and ubiquitin-like proteins form the molecular basis for selective autophagy. Mol. Cell 53, 167-178. 10.1016/j.molcel.2013.12.014 [DOI] [PubMed] [Google Scholar]
- Rujano M. A., Bosveld F., Salomons F. A., Dijk F., van Waarde M. A. W. H., van der Want J. J. L., de Vos R. A. A. I., Brunt E. R., Sibon O. C. M. and Kampinga H. H. (2006). Polarised asymmetric inheritance of accumulated protein damage in higher eukaryotes. PLoS Biol. 4, e417 10.1371/journal.pbio.0040417 [DOI] [PMC free article] [PubMed] [Google Scholar]
- Schipper-Krom S., Juenemann K., Jansen A. H., Wiemhoefer A., van den Nieuwendijk R., Smith D. L., Hink M. A., Bates G. P., Overkleeft H., Ovaa H. et al. (2014). Dynamic recruitment of active proteasomes into polyglutamine initiated inclusion bodies. FEBS Lett. 588, 151-159. 10.1016/j.febslet.2013.11.023 [DOI] [PubMed] [Google Scholar]
- Simonsen A., Birkeland H. C. G., Gillooly D. J., Mizushima N., Kuma A., Yoshimori T., Slagsvold T., Brech A. and Stenmark H. (2004). Alfy, a novel FYVE-domain-containing protein associated with protein granules and autophagic membranes. J. Cell Sci. 117, 4239-4251. 10.1242/jcs.01287 [DOI] [PubMed] [Google Scholar]
- Stiess M., Maghelli N., Kapitein L. C., Gomis-Ruth S., Wilsch-Brauninger M., Hoogenraad C. C., Tolic-Norrelykke I. M. and Bradke F. (2010). Axon extension occurs independently of centrosomal microtubule nucleation. Science 327, 704-707. 10.1126/science.1182179 [DOI] [PubMed] [Google Scholar]
- Thompson L. M., Aiken C. T., Kaltenbach L. S., Agrawal N., Illes K., Khoshnan A., Martinez-Vincente M., Arrasate M., O'Rourke J. G., Khashwji H. et al. (2009). IKK phosphorylates Huntingtin and targets it for degradation by the proteasome and lysosome. J. Cell Sci. 187, 1083-1099. 10.1083/jcb.200909067 [DOI] [PMC free article] [PubMed] [Google Scholar]
- Urushitani M., Sato T., Bamba H., Hisa Y. and Tooyama I. (2010). Synergistic effect between proteasome and autophagosome in the clearance of polyubiquitinated TDP-43. J. Neurosci. Res. 88, 784-797. [DOI] [PubMed] [Google Scholar]
- Vos M. J., Kanon B. and Kampinga H. H. (2009). HspB7 is a SC35 speckle resident small heat shock protein. Biochim. Biophys. Acta 1793, 1343-1353. 10.1016/j.bbamcr.2009.05.005 [DOI] [PubMed] [Google Scholar]
- Vos M. J., Zijlstra M. P., Kanon B., van Waarde-Verhagen M. A. W. H., Brunt E. R. P., Oosterveld-Hut H. M. J., Carra S., Sibon O. C. M. and Kampinga H. H. (2010). HspB7 is the most potent polyQ aggregation suppressor within the HSPB family of molecular chaperones. Hum. Mol. Genet. 19, 4677-4693. 10.1093/hmg/ddq398 [DOI] [PubMed] [Google Scholar]
- Yamamoto A. and Simonsen A. (2010). The elimination of accumulated and aggregated proteins: A role for aggrephagy in neurodegeneration. Neurobiol. Dis. 43, 17-28. 10.1016/j.nbd.2010.08.015 [DOI] [PMC free article] [PubMed] [Google Scholar]
- Yamamoto A., Lucas J. J. and Hen R. (2000). Reversal of neuropathology and motor dysfunction in a conditional model of Huntington's disease. Cell 101, 57-66. 10.1016/S0092-8674(00)80623-6 [DOI] [PubMed] [Google Scholar]
- Yamamoto A., Cremona M. L. and Rothman J. E. (2006). Autophagy-mediated clearance of huntingtin aggregates triggered by the insulin-signaling pathway. J. Cell Biol. 172, 719-731. 10.1083/jcb.200510065 [DOI] [PMC free article] [PubMed] [Google Scholar]
- Zhang H., Rajasekaran N. S., Orosz A., Xiao X., Rechsteiner M. and Benjamin I. J. (2010). Selective degradation of aggregate-prone CryAB mutants by HSPB1 is mediated by ubiquitin–proteasome pathways. J. Mol. Cell Cardiol. 49, 918-930. 10.1016/j.yjmcc.2010.09.004 [DOI] [PMC free article] [PubMed] [Google Scholar]